Buy AMAZON now!! Huge discount sale for an ecommerce behemoth!
Technical Analysis
- Triple bounce off $101 level with big reaction upwards,
- this region used to be resistance now flipped support.
- Its also the 61.8% retracement level (golden zone for a rebound)
- stochastic RSI was in oversold, now rebounding
Trades:
Short term traders can look for a LONG from current level
For long term traders this is a good region to BUY MORE AMAZON
Amazon

AMZN Potential for Bullish Continuation | 8th August 2022On H4, with the price moving above the ichimoku cloud and the MACD histogram is above zero while RSI is also moving along the ascending channel , we have bearish bias that the price may rise from the buy entry at 145.05, which is in line with the 61.8% fibonacci retracement to the take profit at 156.74, which is in line with 78.6% fibonacci retracement . Alternatively, the price may drop to the stop loss at 133.77, which is in line with the 23.6% fibonacci retracement .
Any opinions, news, research, analyses, prices, other information, or links to third-party sites contained on this website are provided on an "as-is" basis, as general market commentary, and do not constitute investment advice. The market commentary has not been prepared in accordance with legal requirements designed to promote the independence of investment research, and it is therefore not subject to any prohibition on dealing ahead of dissemination. Although this commentary is not produced by an independent source, FXCM takes all sufficient steps to eliminate or prevent any conflicts of interest arising out of the production and dissemination of this communication. The employees of FXCM commit to acting in the clients' best interests and represent their views without misleading, deceiving, or otherwise impairing the clients' ability to make informed investment decisions. For more information about the FXCM's internal organizational and administrative arrangements for the prevention of conflicts, please refer to the Firms' Managing Conflicts Policy. Please ensure that you read and understand our Full Disclaimer and Liability provision concerning the foregoing Information, which can be accessed on the website.

AMZN HARMONIC CRABharmonic pattern crab setup
posting harmonic setup ideas to track results, chart analysis and harmonic setups on weekly charts

Amazon for a short term reversalUpgoing zigzag is complete coupled with divergence on momentum give a clear indication that we are to drop on this one in the very immediate future.
We are not in the business of getting every prediction right, no one ever does and that is not the aim of the game. The Fibonacci targets are highlighted in purple with invalidation in red. Confirmation level, where relevant, is a pink dotted, finite line. Fibonacci goals, it is prudent to suggest, are nothing more than mere fractally evident and therefore statistically likely levels that the market will go to. Having said that, the market will always do what it wants and always has a mind of its own. Therefore, none of this is financial advice, so do your own research and rely only on your own analysis. Trading is a true one man sport. Good luck out there and stay safe.

The future of Amazon on 1hour time frame If you like to know more what to do with Amazon
You can see this chart
And it will be able to help you to make a better decision

LongEntered here at 118. Going long so far nice gains.
Looking to gap fill soon enough. Just keep trialing the stop loss


Next Earning...?!How much do you expect it to be at the next E event? No where above $30!
Uber has strong tendency in moving downward; despite CEO's plan "focusing on profitability", they are loosing customers, and drivers are leaving them.
NOT REALLY recommended for long term view.

8/3/22 AMZNAmazon.com, Inc. ( NASDAQ:AMZN )
Sector: Retail Trade (Internet Retail)
Market Capitalization: $1.420T
Current Price: $139.52
Breakout Price: $140.70
Buy Zone (Top/Bottom Range): $129.20-$113.70
Price Target: $143.70-$146.00 (2nd), $154.00-$156.10 (3rd)
Estimated Duration to Target: 23-26d, 54-59d
Contract of Interest: $AMZN 8/26/22 145c, $AMZN 9/16/22 145c
Trade price as of publish date: $2.75/contract, $4.40/contract

Amazon (AMZN) trade updatesClosing of the GAP at the end of April for Amazon, which had lateralized after the split.
In a week characterized by a positive reaction from the markets, thanks to quarterly better than expected or, as in the case of amazon, less bad than expected and thanks also to a Fed that simply confirms what it had anticipated.
Now the key data will be those of July inflation, considering that some people think that the peak occurred in June.
They are up almost 40% on Amazon and 30% on Apple , two companies that are almost a safe haven asset in difficult times.
For this reason, I will not liquidate the whole position but on the contrary, I will accumulate should there be a retracement, which I expect.
In the short term, those who have had the skill to enter the $ 105 area could think of taking home the profits and preparing to accumulate on the retracement.
If you want to hold the position, $ 145 could be a possible target, considering the 200-period moving average, which is usually felt by the price.
On a volumetric level, the one-year POC holds firmly against $ 165, there are no possible areas for it to move, considering the huge amount of trading at that price level.
That's where I'll take some of the profits home.
Happy trading
Lazy Bull
DISCLAIMER: I am not a financial advisor. These posts, videos, and any other contents are for educational and entertainment purposes only. Investing of any kind involves risk. While it is possible to minimize risk, your investments are solely your responsibility. It is imperative that you conduct your own research. I am merely sharing my opinion with no guarantee of gains or losses on investments.

AMZN! to Keep in portfolioHello ladies and gentlemen, according to my graphical analysis of Amazon , I guess that this is the good time to buy the stock ,also the Golden Point confirm our probability to keep in portfolio.There is an interesting volume ,which gives a good probability to break the level mentionned in the chart..
If you have any suggestions,please write below.

Ascent in the short termThe price has rejected at a resistance level, we have a small correction in the previous support, and by hitting the static support with a higher strength, it attacks the dynamic resistance to break and experience the price up to the previous peak, and the possibility of retesting the price in that area We can see a drop again to experience lower prices.

$AMZN bearish wedge confirmed on 15mLast week I posted about a bearish wedge on $AMZN, Friday confirmed the break in the up trend. With many catalysts (headwinds) over the next couple days, this will be an interesting one to watch.
Positions: 105p Nov., 105p Dec.

Amazon at important resistanceAmazon
Short Term
We look to Sell at 125.79 (stop at 132.33)
Preferred trade is to sell into rallies. Previous resistance located at 126.00. There is scope for mild buying at the open but gains should be limited. Posted a Bullish Outside candle on the Daily chart.
Our profit targets will be 103.03 and 91.98
Resistance: 125.00 / 138.00 / 150.00
Support: 106.00 / 100.00 / 85.00
Disclaimer – Saxo Bank Group. Please be reminded – you alone are responsible for your trading – both gains and losses. There is a very high degree of risk involved in trading. The technical analysis, like any and all indicators, strategies, columns, articles and other features accessible on/though this site (including those from Signal Centre) are for informational purposes only and should not be construed as investment advice by you. Such technical analysis are believed to be obtained from sources believed to be reliable, but not warrant their respective completeness or accuracy, or warrant any results from the use of the information. Your use of the technical analysis, as would also your use of any and all mentioned indicators, strategies, columns, articles and all other features, is entirely at your own risk and it is your sole responsibility to evaluate the accuracy, completeness and usefulness (including suitability) of the information. You should assess the risk of any trade with your financial adviser and make your own independent decision(s) regarding any tradable products which may be the subject matter of the technical analysis or any of the said indicators, strategies, columns, articles and all other features.
Please also be reminded that if despite the above, any of the said technical analysis (or any of the said indicators, strategies, columns, articles and other features accessible on/through this site) is found to be advisory or a recommendation; and not merely informational in nature, the same is in any event provided with the intention of being for general circulation and availability only. As such it is not intended to and does not form part of any offer or recommendation directed at you specifically, or have any regard to the investment objectives, financial situation or needs of yourself or any other specific person. Before committing to a trade or investment therefore, please seek advice from a financial or other professional adviser regarding the suitability of the product for you and (where available) read the relevant product offer/description documents, including the risk disclosures. If you do not wish to seek such financial advice, please still exercise your mind and consider carefully whether the product is suitable for you because you alone remain responsible for your trading – both gains and losses.

AMZN looking weak here for short termafter breaking out from the wedge, is now getting rejected from the highlighted resistance zone. Looking weak till we are below this zone now..

Insiders Knew Something...(READ CAREFULLY)If you had watched Uber's chart in the past two weeks you have probably realized that it goes one day +5% the other day -5%, next day +4% and again -4% ....;
Experienced traders know that's a scary signal that indicates company is running out of money and is scrambling to survive with speculation !
This common phenomenon (+5%, -4%, +4%, -5% ...,) happens just few weeks prior to bankruptcy.
Speculation is because of no operating income...!!! Has lost more than 60% in the last year and is taking its last breaths.

$AMZN (Amazon) Stock - AnalysisIn my opinion, Amazon has completed (or is about to complete) a full market Supercycle: Impulse Wave (I) and Corrective Wave (II).
What I would anticipate would be for Amazon to accumulate during the recession and then emerge out of it with Supercycle Impulse Wave (III).


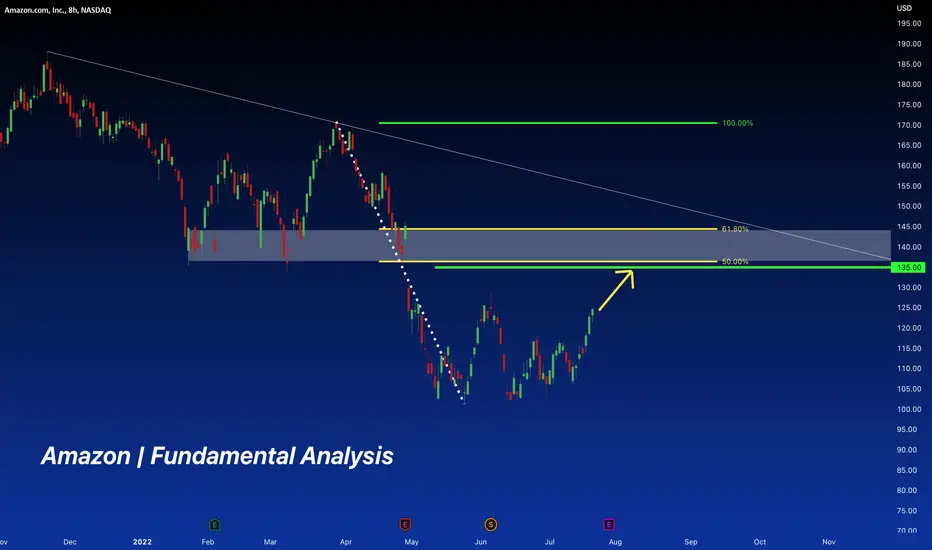
Amazon | Fundamental Analysis | Long Amazon will report its Q2 2022 results after the market closes on Thursday, July 28. An analyst call is scheduled for the same day at 5:30 p.m. ET.
Investors will likely approach the e-commerce and technology giant's report with some caution. Last quarter, the company's earnings fell short of Wall Street's expectations, while revenues were in line with the consensus forecast. While investors were undoubtedly unhappy with the final result, they were likely more concerned about the company's earnings outlook for the second quarter. It was significantly lower than analysts had forecast.
Investors are increasingly concerned about the macroeconomic situation. So far, continued high inflation has not had much of an effect on consumer spending overall. That could change, however, as more and more consumers are becoming concerned that the U.S. economy could slide into recession. If many consumers markedly reduce their discretionary spending, Amazon's e-commerce results would suffer.
Nevertheless, investors should be mindful of the bigger picture, as this company has seemingly countless current and potential long-term growth opportunities.
Here's what to watch out for in Amazon's upcoming report.
While Amazon does not make earnings guidance, it does in terms of operating results. Management expects operating results to range from an operating loss of $1 billion to an operating income of $3 billion. The company had $7.7 billion in operating income in last year's quarter.
The company faces a difficult comparable performance since it had a strong performance last year. One factor adding to the difficulty of comparisons is the postponement of its annual Prime Day event from Q2 last year to Q3 of this year. In addition, currency headwinds likely affected second-quarter earnings, as the U.S. dollar has strengthened against other currencies over the past year.
By comparison, Amazon's Q1 revenue rose 7% year over year (and 9% in constant currency) to $116.4 billion, a result that was in line with Wall Street's expected $116.3 billion and close to the upper end of the company's forecast range of $112 billion to $117 billion. By segment, sales in North America and Amazon Web Services rose 8% and 37%, respectively, while sales in the international segment fell 6%.
Last quarter's net loss was $3.8 billion, or $7.56 per share ($0.38 per share given the 20-for-1 stock split in June). This compared to a net income of $15.79 per share a year ago. That result was well below the consensus forecast of analysts, who had an expected net income of $8.48 per share.
Much of the shortfall was due to a $7.6 billion pre-tax loss from Amazon's investment in the common stock of electric car maker Rivian Automotive, which held an initial public offering (IPO) last November. Had this article not been in place, Amazon would have made a net profit, not a loss. However, it still would not have met Wall Street's expectations.
Amazon stock is likely to rise if management's Q3 outlook differs significantly from Wall Street's expectations.
The company provides a revenue forecast, but not an earnings forecast. However, the operating income forecast usually gives investors a rough idea of what percentage change management expects for the year.
Currently, analysts are predicting that Amazon's Q3 revenue will grow 15% year over year to $127.8 billion and that earnings per share will increase 16% to $0.36. Keep in mind that this quarter will get a boost from Prime Day compared to the Q2 last year.
Amazon Long! Possible 50% gains if you ask me. Trade carefully and yes, I am still expecting a recession!

#AMAZON have something to sayAmazon is in a range of 99 to 113 where i would recommend 131 targets to bee seen, Dont worry about springs! Like if it gies below 95 or so

AMAZON Generational Bottom and buy opportunityAmazon (AMZN) has been trading within the MA300 (red trend-line) and MA200 (orange trend-line) on the 1W time-frame for more than 2 months. In multi-year terms, this is the equivalent of a bottom formation within the Bullish Channel that started after the bottom of the Dotcom crash in September 2001.
More specifically, the 1W MA300 hasn't been touched since January 2009 (bottom of the housing crisis) and the last time a (Higher) Low was formed within the 0.236 - 0.382 Fibonacci retracement levels (Fib Channel applied on the pattern) was within October 2014 - January 2015.
With the 1W RSI rebounding after breaking inside its multi-decade Buy Zone (has done so only another 3 times in 21 years) and the 1W LMACD inevitably about to make a Bullish Cross, this seems like a golden multi-year buy opportunity for Amazon. The Higher High target has been the 0.786 Fibonacci level since late 2018.
--------------------------------------------------------------------------------------------------------
Please like, subscribe and share your ideas and charts with the community!
--------------------------------------------------------------------------------------------------------

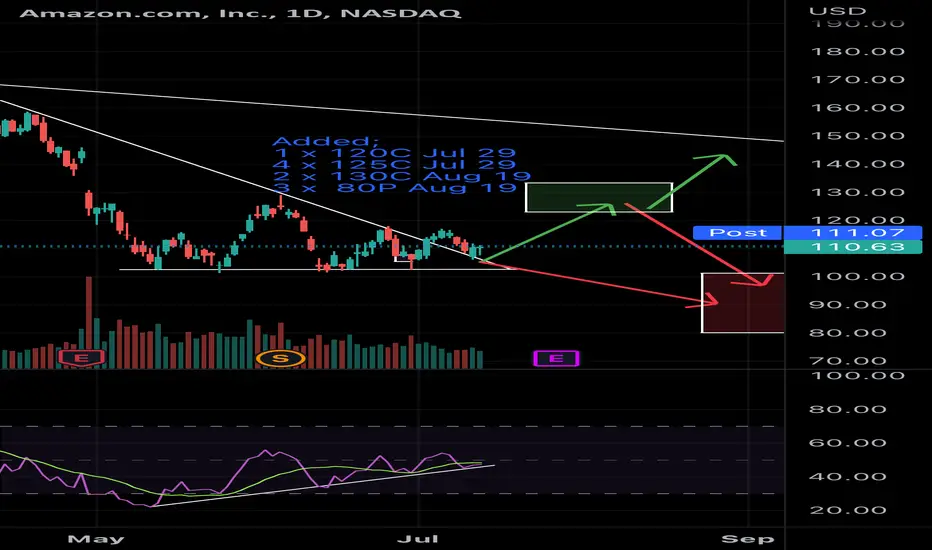
Amazon earnings Hey guys,
I’m really looking forward to amazing earnings!
Little biased here leaning towards the topside although my options spread does include bottom side cover.
I noticed Amazon broke out of the diagonal trend last week which I took some profits on… And retested yesterday with a little bit of a pop.
I’m expecting to see some excitement (next week) before earnings and planning on opening other straddle (earnings week) favouring the downside into early September.
This options spread cost around 9.5 credits and I feel fresh having both ends covered until Aug 19.