AMZN Amazon.com: 1D Chart ReviewHello friends, today you can review the technical analysis idea on a 1D linear scale chart for Amazon.com, Inc. (AMZN).
The chart is self-explanatory. Death cross on the 1D chart recently occurred. RSI and MFI is below the support line. Keep an eye on the Multi-Year Support Line if price starts to break down.
Included in the chart: Trend line, Support and Resistance Lines, RSI, MFI, Death Cross, Simple Moving Average, EMA Ribbons, Volume.
If you enjoy my ideas, feel free to like it and drop in a comment. I love reading your comments below.
I have additional charts below on cryptocurrencies, stocks and more to review. Check them out!
Disclosure: This is just my opinion and not any type of financial advice. I enjoy charting and discussing technical analysis. Don't trade based on my advice. Do your own research! #cryptopickk
Amazon

Scamazon - The Great Reset Of 2022This is the most obvious scam I've ever seen "earnings" yeah okay
meta FB uses aws, amzn sells rivn bs
NASDAQ:AMZN
Maybe they should Ask Amazon how much they lose per year to fraud.
short 3.2k+

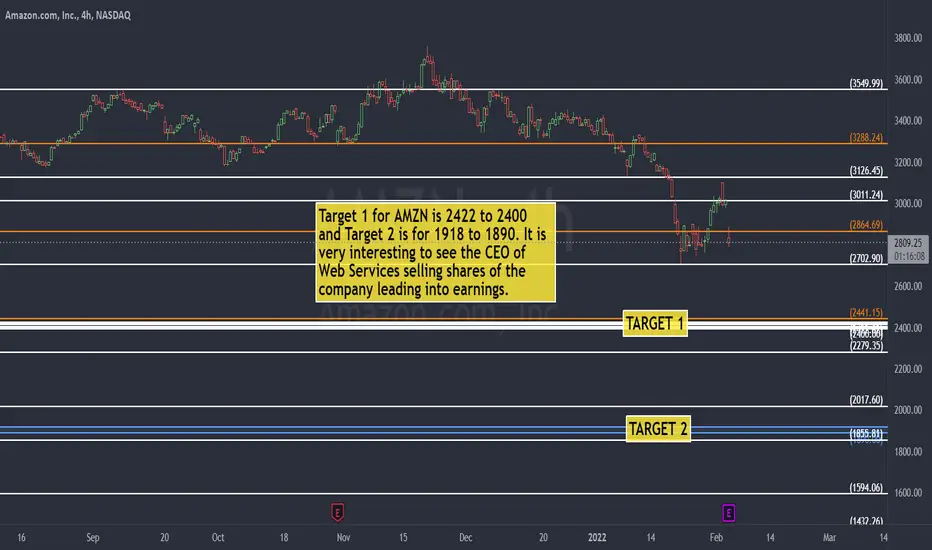
AMZN to the DownsideTarget 1 for AMZN is 2422 to 2400 and Target 2 is for 1918 to 1890. It is very interesting to see the CEO of Web Services selling shares of the company leading into earnings.
AMAZON -50% shortAmazon.com is a vast Internet-based enterprise that sells books, music, movies, housewares, electronics, toys, and many other goods, either directly or as the middleman between other retailers and Amazon.com's millions of customers. ... The company also makes the market-leading Kindle e-book readers.

HUGE Long-Term BUYING opportunity on PayPal #PYPLWe've just opened a LONG #PYPL (PayPal Holdings) position using 2.50% of our equity as we believe that the current post-earnings sell-off is quite overdone at these levels.
The stock is down over 58% from its all-time highs of $310 that it reached mid-summer last year. Our view is that while there are definitely issues related to the future growth trajectory of the company that investors are rightfully worried about, the current price action is pricing in the worst possible scenario for the company moving forward, which in our opinion has a very low probability of actually materializing. Furthermore, the weak forward guidance and the severely lowered investor expectations will make it that much easier for the company to beat its own forecasts in the coming months, considering its leadership position in its sector, thus surprising the street positively. This will then cause a chain reaction of positive analyst upgrades and price target revisions. Yes, this whole process might take some time to materialize, but if you are looking for a solid growth stock with a remarkable long-term potential to double your money, then #PYPL is a screaming buy anywhere around the $125-130 range.
There is no question about the fact that the miss on the bottom line (EPS) in the most recent earnings report together with the poor forward guidance that the management gave on the earnings call after have been the major drivers for the vicious sell-off that we are seeing today.
For 2022, management expects net revenue to increase about 15% to 17% (19% to 21% ex-eBay), and that’s below the roughly 18% analysts were forecasting. The earnings outlook wasn’t any better, with management forecasting adjusted earnings of $4.60 to $4.75, well below analyst estimates of $5.21.
On the new users front, PayPal expects to add about 15 million to 20 million net new active accounts this year, and analysts were forecasting growth of about 55 million. This was definitely one of the most disappointing components of the report.
However, we believe that the down-beat forward guidance given by the company is hugely blown out of proportions and it seems that investors have been very quick to forget that #PYPL is the leader in the digital payments space and could technically be considered as the largest digital bank in the world with over 300 million clients. Our analysis shows that the eBay transition that the company has been going through has definitely weighted on its financial performance. However, we are in the final stages of it and it will be over and done with by the second half of the year.
What investors need to focus on is the fact that the company’s growth rates excluding eBay have remained above 20%. In addition to that the #AMZN (Amazon) partnership with Venmo hasn’t even started yet, and PayPal is free to explore many new partnerships now that it is no longer constrained by its relationship with #EBAY (eBay) . Also, operating expenditure growth is also expected to moderate down the road, allowing management to flex the leverage in the business model and help expand margins.
Apart from adding the stock to our long-term corporate investment portfolio here, we've also opened few long-term CALL options on $PYPL, which we expect to substantially boost our portfolio returns in 2022.
Follow and copy us for more detailed market analyses, profitable trading ideas and a consistent portfolio performance.
Sincerely,
@DowExperts

AZMN the only giant who hasn`t made a stock split (yet)If you haven`t bought the dip:
Then you should know that AMZN is the only giant who hasn`t made a stock split yet.
Alphabet Inc. announced a 20-to-1 Stock Split yesterday.
And you all know how appealing were Apple , Tesla and Nvidia for retail investors after the stock splits!
My short term price target is $3150.
Looking forward to read your opinion about it.

that the market will play between!!!!With this analysis I believe that the market will play between
2798 AND 3156 OR MORE.

Amazon ready to go above 5000 zoneHi,
My thoughts on Amazon as a great growth company:
- To the end of 2022 we will reach 5000 dollar.
- This is a huge buying opportunity with high probability of success.
Have fun investing/trading!

Amazon Looking For Sellers at 3200/330IN this update we review the recent price action in Amazon an identify the next high probability trading opportunity and price objectives to target

AMAZON (AMZN) TA SCENARIO IDEASo I did a technical analysis on NASDAQ:AMZN and here is my idea/point:
Bearish:
(not perfect) hammer candle followed by a bearish confirmation
Stock in a clear downtrend
Ema not showing any trend reversal sign or upwards correction ( no crossing movement)
AMZN broke a strong support level
Bullish:
RSI showing a very Strong Support, so Price may bounce off ( MAY ), we need confirmation in the following Week/Days, I'll update the idea
For me, the stock is showing a lack of bullish signs and is therefore bullish, BUT wee still need confirmation on the RSI support Bounce-off/breaktrough.
------------------------------------------------------------------------------------------------------------------------------------------------------------------------------------------------
If you enjoyed this post and agree with me, a like and a sub would be very nice : )
Stay updated for more content
Have a nice Day : ) Bye!
------------------------------------------------------------------------------------------------------------------------------------------------------------------------------------------------

WALMART, sell short and I don't recommend to keep itsell short I don't recommend to keek this stock we have a pullback after a long uptrend

AMZN Amazon Oversold at June 2020 levelThis should be an interesting trade for this week.
AMZN Amazon stock is now oversold at recently touched its June 2020 level.
I think a bounce is most likely to the $3060 resistance level.
Looking forward to read your opinion about this.

GC GOLD FUTURESprepare to buy here, after a breakout,
if the market did not break the resistance or break without volume, stay away!
PROFESSIONAL TRADER TELLING YOU

AMAZON Breakout Confirmed! Sell!
Hello,Traders!
AMAZON broke the key support level
Which turned into a restiance
And the breakout is confirmed
So now I am bearish on the stock
And I think that there is high probability
That it will go further down
Sell!
Like, comment and subscribe to boost your trading!
See other ideas below too!


Is this the right time buy this Tech Monopoly??Amazon looking great for Long term Investment. Analysis is done on weekly timeframe.

Amazon and my shopping basketDisney, T Mobile, Amazon, Charter Communications, Netflix.
What do all of these companies have in common?
1) They are all >$100B market cap.
2) They all have >10B Gross Profits.
3) They are all at 52 Week Lows.
4) They're all on my shopping list.
Amazon just had it's worst week since 2018 after underperforming the S+P in 2021, but this behemoth isn't going anywhere. I don't need to tell you about the value of it's core ecommerce business that we all use, or the AWS that runs a huge chunk of the internet, the 2nd largest hosting provider with their cloud hosting servicing 42% of the top 10k websites by traffic (Source: BuiltWith), or the success of Prime through logistical brilliance, a successful streaming platform and acquisition of Wholefoods to make the most convenient home shopping platform in the world.
I don't have to tell you about the 31 acquisitions Amazon has made since 2017, 15 of those since 2019.
I don't have to tell you that Amazon is an incredible company that still has a long runway of success and innovation ahead in a growing number of sectors (drones? Yes please!)
That's why Amazon is one of my top choices for investment in 2022.
The business circumstances for each company deserve separate posts in their own right, but to put it simply these companies are the cream of the crop in their industries and we currently have a fire sale.
When the market dips, it's the perfect time to go shopping, and each of these companies deserve serious consideration in your portfolio. Do your own research and make your decisions, but when it comes time to go bargain hunting why not start with the best in class?
A few more stocks I'm looking at meet that >$100B market cap, >$10B gross profits, industry leaders but that are at 6 Month Lows include:
Estee Lauder
Target
Oracle
Blackrock
Salesforce
Alphabet (GOOG)
We can see where the market takes us this week, but I can say with certainty I'll be a buyer on a number of these names this week.

$AMZN Can Fall to This Zone At 2800 #AMAZONAmazon has been in consolidation, has created equal highs (double top) and now with a little push it can fall down to FCP zone while coming out of the consolidation zone. This may not even stop there but a bounce up can come from there.
Rules:
1. Never trade too much
2. Never trade without a confirmation
3. Never rely on signals, do your own analysis and research too
✅ If you found this idea useful, hit the like button, subscribe and share it in other trading forums.
✅ Follow me for future ideas, trade set ups and the updates of this analysis
✅ Don't hesitate to share your ideas, comments, opinions and questions.
Take care and trade well
-Vik
____________________________________________________
📌 DISCLAIMER
The content on this analysis is subject to change at any time without notice, and is provided for the sole purpose of education only.
Not a financial advice or signal. Please make your own independent investment decisions.
____________________________________________________

Amazon is gonna fall till 2000 first targetBecause of price action and RSI indicator we get price target of 2000. Load shorts.

TechaverseThe probability of a tech recovery is increasing. The sky isn't falling yet and inflation is going to be assumed to be peaking. Plus the end of the pandemic is in sight. Sentiment might start to shift soon. There are risks, as there always are, but they can be delayed much longer than expected and aren't much different than usual. Here are some names I am interested in at these levels
Adobe
Amazon
Shopify
Google
Metabook

KEY Levels Reached: Four Tech Stocks To Watch!
Hello,Traders!
We can see from the charts above that
AMAZON, NVIDIA, NETFLIX and FACEBOOK
All fell sharply and have reached strong key support levels
Or even the support clusters as in the case with NFLX and NVDA
So I will be watching these ones closely next week
Becasue IF these levels get broken, then these stocks
Will fall even further down and drag the main indecies with them
However, IF we see pullbacks and reversal patterns
We might be looking to enter into the long positions
From good levels with good discounts!
Like, comment and subscribe to boost your trading!
See other ideas below too!

BITCOIN AND AMAZONThe rise and fall of Bitcoin. Bitcoin being compared to #Amazon bubble during the year 1998 - 2000s. Very similar pattern, could it become a reality in the future? Will altcoin season pop-out anytime now?

Failure of the support floorAfter leaving the state of suffering and compactness, the price in the form of a rectangle is expected to correct to the desired bottom floor
