Amazon (NASDAQ:$AMZN) Slides 4% Amidst Cloud Growth SlowdownAmazon (NASDAQ: AMZN) shares slid nearly 4% in pre-market trading on Friday, as investors reacted to a slowdown in the company's cloud growth and a subdued sales forecast for the current quarter. The dip comes despite strong performance in Amazon's retail segment and a broader technical breakout that suggests the stock may be poised for a significant upward move in the coming months. Let’s dive into the technical and fundamental factors driving Amazon’s current market dynamics and why this dip could be a buying opportunity for long-term investors.
Cloud Growth Slowdown Weighs on Sentiment
Amazon Web Services (AWS), the company’s cloud computing division and a key profit driver, reported a 19% year-over-year revenue increase to $28.79 billion for the quarter. While this growth is impressive, it fell slightly short of analyst expectations of $28.87 billion, according to LSEG data. This miss has raised concerns about the competitive pressures AWS faces from rivals like Microsoft Azure and Google Cloud, as well as emerging low-cost competitors such as China’s DeepSeek.
Technical Outlook
From a technical perspective, Amazon’s stock chart tells an intriguing story. As of Friday’s pre-market trading, AMZN was down 2.78%, but the stock recently broke out of a falling trend channel, signaling a potential reversal of its previous downtrend. While the stock has yet to capitalize on this breakout, the current dip could be interpreted as a "shakeout" before a significant upward move.
Key technical indicators support this bullish thesis:
- Relative Strength Index (RSI): The RSI remains strong at 60, indicating that the stock is neither overbought nor oversold and has room to climb.
- Moving Averages: AMZN is trading well above its 50-day, 100-day, and 200-day moving averages, a sign of strong underlying momentum and bullish sentiment.
This technical setup suggests that the pre-market dip may be a temporary pullback rather than the start of a sustained downtrend. For traders and investors, this could present an attractive entry point.
Strong Revenue and Earnings Growth
Amazon’s financial performance in 2024 has been impressive, with revenue reaching $637.96 billion, a 10.99% increase compared to the previous year’s $574.79 billion. Earnings surged by 94.73% to $59.25 billion, reflecting the company’s ability to scale profitability even as it invests heavily in growth areas like AI and cloud infrastructure.
The company’s 12-month forward price-to-earnings (P/E) ratio of 37.3 is higher than peers like Alphabet (22.7) and Microsoft (30.1), but this premium is justified given Amazon’s diversified business model, dominant market position, and long-term growth potential.
Analyst Sentiment: Strong Buy Rating
Wall Street remains overwhelmingly bullish on Amazon. According to 43 analysts, the average rating for AMZN stock is a "Strong Buy," with a 12-month price target of $254.3, representing a 6.48% upside from the latest price. At least seven brokerages raised their price targets following the earnings report, bringing the median target to $260.
Analysts are optimistic about Amazon’s ability to navigate near-term challenges and capitalize on long-term growth opportunities in AI, cloud computing, and e-commerce. The company’s heavy investments in AI infrastructure, while weighing on margins in the short term, are expected to pay off handsomely in the coming years.
Amazon

AMZN Amazon Options Ahead of EarningsIf you haven`t bought AMZN before the previos earnings:
Now analyzing the options chain and the chart patterns of AMZN Amazon prior to the earnings report this week,
I would consider purchasing the 240usd strike price Calls with
an expiration date of 2025-2-7,
for a premium of approximately $6.40.
If these options prove to be profitable prior to the earnings release, I would sell at least half of them.

$AMZN is at risky area going into the earningsAmazon's last six earnings moves:
🟢 +7.5%
🔴 -12.7%
🟢 +3.4%
🟢 +8.2%
🟢 +8.7%
🟢 +11.4%
Options market expecting a 6.6% swing for NASDAQ:AMZN
Cloud drives 70% of profits
Retail? Barely profitable.
Amazon's market cap: $2.5T
For that price, you could own:
The entire Bitcoin market 5 times over
Every billionaire in the world’s top 500 list

UPDATE Amazon Sling shot to $276.41 thanks to being different!Amazon’s stock is booming while others face AI turbulence. AWS growth (19% expected) and smart AI use boost their lead.
Instead of fearing DeepSeek, Amazon partnered through AWS. Plus, their diverse streams—e-commerce, cloud, ads, and entertainment—keep them stable when rivals like Nvidia stumble.
So it's one of the bullish tech stocks but once again it is also highly diversified in other sectors which is actually helping maintain the share price.
Price>20 and 200MA
Broken above Rounding Bottom
Target $276.41

Amazon: Volatile!The Amazon stock has shown significant volatility recently but managed to recover its temporary losses of over 7% just as quickly. We still position the stock within the turquoise wave 3, which should have additional upside potential. Once this high is established—something that may have already occurred—we anticipate a wave 4 pullback before wave 5 completes the larger magenta wave (3) further to the upside. As you can see in the daily chart, this magenta wave (3) acts as a subwave of the green wave , which in turn should lead to the peak of the even larger beige wave III. Following this, we expect a more pronounced wave IV correction before another round of impulsive rallies drives the stock to new highs.

AMAZON - preparation for the Christmas Rally?Hi , dear traders we are watching how Amazon has formulated a very strong assending channel, currently their financials have been doing amazing and we are approaching the Christmas Rally and the finalization of the Q4 earnings. Their recent announcment that they would do heavy investing in AI would be extremely beneficial for the company and sould conclude the continuation of their bullrun.
Entry at 201$
Target 235$

Amazon Reaches New All-Time High: Should You Buy Now...?AMAZON has successfully surpassed its previous all-time high and has maintained a position above this critical level. This upward momentum presents an opportunity for traders to consider entering a long position on a pullback. A strategic entry point for this trade could be set at $235.50, where we can potentially capitalize on a rebound as the stock stabilizes. It's essential to monitor volume and market sentiment during this pullback to ensure a favorable risk-to-reward ratio for the trade.

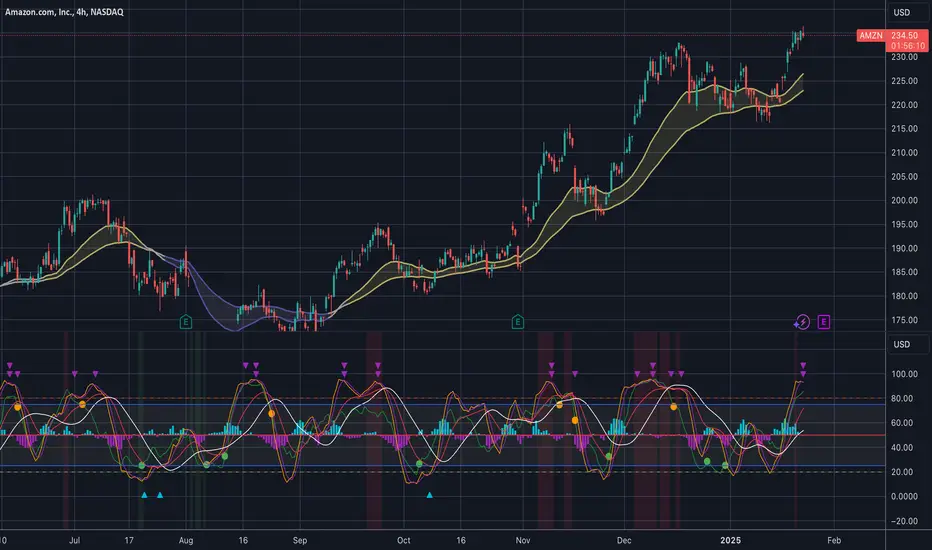
AMAZON going for a DIP on the 4HCrystal ball has spoken, AMZN is due for a small DIP.
Trend Analysis:
• The price is trading in an overall uptrend, respecting the 50 EMA (yellow) and 20 EMA (gold), indicating strong bullish momentum.
• Recent price action has formed higher highs and higher lows, maintaining bullish structure.
JP StochDemark Indicator Insights:
• The indicator is approaching overbought levels, currently crossing above the 80 threshold, which signals potential exhaustion in the short term.
• Bearish divergence is forming as price makes new highs while the indicator fails to confirm.
• Previous occurrences of such setups led to short-term pullbacks before continuation.
Support & Resistance Levels:
• Immediate resistance at $236-$238, aligning with recent highs.
• Short-term support at $ 225 , where moving averages align.
• Strong demand zone around $210-$215, coinciding with prior consolidation.
Trade Signal & Probability:
Bullish Bias : Continuation likely if price sustains above $ 230 with momentum confirmation.
Bearish Pullback : A corrective dip to the $225 zone is probable if momentum weakens.
Target Levels : Upside targets at $240 (psychological resistance) and $250 if momentum persists.
Risk Levels : Watch for breakdown below $225, which could trigger further downside to $215.
Conclusion :
Momentum remains bullish but overbought signals suggest caution.
Monitor for a healthy retracement before continuation. A break above $238 could confirm further bullish momentum.
Like the analysis? Follow, Subscribe for more...
Interesting Simetry in $AMZNStarting from the 5th of August 2024 every time NASDAQ:AMZN reaches an important Fibonacci level retraces around 7%, then moves higher.
Once it reached 0.618, the Fibonacci level corrected by 6.86% in 5 days and then moved higher.
We have another wave up followed by another correction this time 7.62% in 9 days.
And again another wave up followed by a correction of 7.51% in 10 days to Fibonacci level 1
Once it reached 1.618 Fib level retraced to 1.382 Fib level Correcting 7.24% in 18 days this time.

Nancy Pelosi bought Amazon Calls! 📈 Bullish Opportunity: Amazon (AMZN)
1️⃣ Bullish Flag Pattern with Premarket Breakout:
Amazon has formed a classic bullish flag pattern, which is a reliable continuation signal in an uptrend. The price has already broken out of the flag channel in the premarket session, signaling strong bullish momentum and potential for significant upside.
2️⃣ Amazon’s Cloud Leadership is Poised to Strengthen:
AWS (Amazon Web Services) continues to lead the cloud infrastructure market, controlling 33% of the market—more than Azure and Google Cloud combined, according to Canalys.
CEO Andy Jassy noted four consecutive quarters of reaccelerating AWS growth, with an annualized revenue run rate of $110 billion.
3️⃣ AI Advancements Reasserting Dominance:
While Microsoft is seen as the leader in the AI revolution, Amazon is catching up fast. Over the past 18 months, AWS released nearly twice as many machine learning and generative AI features as competitors combined.
These advancements are expected to make Amazon a leader in AI throughout 2025, further enhancing its cloud and technology business.
4️⃣ E-commerce Profitability Soaring:
CEO Andy Jassy’s focus on cost-cutting and logistics efficiency is delivering results:
Operating income in Amazon’s North American e-commerce segment grew by 87% in the first nine months of 2024.
Automation advancements, like robotics in fulfillment centers, have reduced processing times and improved cost efficiency by 25% during peak times.
These measures are driving higher profitability in its flagship e-commerce business, helping Amazon increase margins and drive long-term growth.
5️⃣ Undervalued and Strong Growth Potential:
Simply Wall Street estimates Amazon is trading at 40.5% below fair value, offering an attractive entry point for investors.
6️⃣ Smart Money Confidence:
Nancy Pelosi recently purchased Amazon calls 3 days ago!
7️⃣ Analyst Ratings:
Consensus: Strong Buy from top analysts.
Average Price Target: $245 (near-term expectations).
High Price Target: $280 (bullish scenario).
🎯 Strategy:
Enter now : $225.94 - $228.50
First Target : $240 (First resistance after breakout).
Second Target : $260 (Measured move from the flagpole).
Third Target : $280 (High-end analyst expectations).
Stop Loss: Based on the risk management.

AMAZON - Next day delivery of GAINS!NASDAQ:AMZN 📦
🔹Green H5 Indicator
🔹9ema Bullish Cross
🔹Bull Flag
🔹Bullish Wr%
🔹Volume Shelf Launch
🎯$233🎯$243 before March! ⏲️
Not financial advice

Amazon’s Stock Stuck in a Downhill Slope or Ready to Escape ?Amazon's stock price movement on a 4-hour timeframe, presenting a descending channel pattern. This pattern is often associated with bearish sentiment, as it reflects a market structure characterized by lower highs and lower lows, signaling a consistent effort by sellers to dominate price action.
Currently, the price is trading near the upper boundary of the channel, which acts as a dynamic resistance level. Historically, such resistance zones within descending channels tend to attract selling pressure, reinforcing the bearish outlook. If the price fails to break above this resistance and shows rejection signs (e.g., long wicks or bearish candlesticks), it could confirm a continuation of the downtrend, targeting the lower boundary of the channel as the next support level.
It is crucial to monitor this resistance area closely, as a breakout above the channel could shift the sentiment from bearish to bullish. For such a breakout to be credible, it must be accompanied by strong volume and decisive candlestick patterns, such as a bullish engulfing or a breakout gap. In that scenario, the price could invalidate the descending channel and initiate a reversal, targeting higher resistance levels.
Additionally, the broader market context and fundamental factors should be considered. If the stock is supported by positive catalysts or market sentiment, it could strengthen the likelihood of a breakout. Conversely, weak sentiment or negative news could intensify the bearish momentum, leading to further downside.
The chart currently reflects a bearish bias due to the descending channel structure. However, the key to determining the next move lies in the price action and volume near the upper resistance line, which will decide whether the pattern continues or reverses.

AMAZON WILL KEEP GROWING|LONG|
✅AMAZON is trading in an
Uptrend along the rising
Support line and we are
Already seeing a bullish rebound
And a move up from the support
Just as I predicted so we are
Bullish biased and we will be
Expecting a further
Bullish continuation
LONG🚀
✅Like and subscribe to never miss a new idea!✅

AMAZON Bullish Flag Pattern! Buy!
Hello,Traders!
AMAZON is trading in an
Uptrend and the stock
Has formed a bullish flag
Pattern so IF we see a
Bullish breakout then we
Will be expecting a
Further bullish continuation
Buy!
Comment and subscribe to help us grow!
Check out other forecasts below too!

AMAZON: Neutral on 1D signals a buy opportunity.AMAZON is neutral on its 1D technical outlook (RSI = 52.618, MACD = 1.360, ADX = 32.455) and is trading under its 4H MA50. With the long term pattern being a Channel Up and the price already hitting its bottom, this emerges as a medium term buy opportunity. The Channel's pullback has already met the 0.382 Fibonacci retracement condition, which is the level all three prior pullbacks hit before rebounding on a new bullish wave. Those waves hit at least the -0.382 Fibonacci extension on their way up, so that is our target (TP = 247.00).
See how our prior idea has worked out:
## If you like our free content follow our profile to get more daily ideas. ##
## Comments and likes are greatly appreciated. ##

Amazon Stock Analysis: Navigating the Path Between E-Commerce
Amazon Stock Analysis: Navigating the Path Between E-Commerce Strength and Market Volatility
Introduction
Hello, traders and investors! It’s Denis Mikheev from TheWaved™, here to deliver an in-depth analysis of Amazon’s stock (NASDAQ: AMZN). With the help of our premium tools and techniques, we’re diving deep into technical, VSA, and fundamental analysis to uncover the best strategies for the upcoming market movements. Let’s break down what’s happening with AMZN and set clear targets for trading this powerhouse of e-commerce.
Recent Performance and Market Context
Amazon’s current price sits at $219.27, with a noticeable decline from its 2024 absolute high of $233. This 5.89% drop aligns with recent sell-offs driven by macroeconomic headwinds and profit-taking from the December highs.
The stock is trading in a consolidation phase, sitting between strong support zones at $214.99 and $209.11 and resistance levels at $223 and $228. With the broader NASDAQ index displaying mixed momentum, Amazon remains a critical stock to watch.
Support Levels:
-
1. 214.99
2. 209.11
3. 198.78
4. 182.62
5. 177.95
Resistance Levels:
-
1. 214.99
2. 209.11
3. 198.78
4. 182.62
5. 177.95
Powerful Resistance Levels:
-
1. 180.095
2. 151.49
3. 116.04
4. 87.57
Technical Analysis: Key Levels and Trends
Support Levels: 214.99, 209.11, 198.78
Resistance Levels: 223.00, 228.00, 233.00
Key Moving Averages:
- MA50 (Hourly): 220.01
- MA200 (Hourly): 223.16
RSI Insights: The RSI-14 currently reads 52.91, indicating a neutral market condition but leaning towards bullish potential on strong volume signals.
These technical indicators suggest price consolidation, but with bullish potential as the RSI edges upward and MA200 looms as a key dynamic resistance level.
Volume Spread Analysis (VSA): Detecting Market Intentions
Analyzing VSA patterns from recent trading sessions reveals mixed signals. A notable “Buy Volumes Take Over” pattern on January 10 suggested short-term buying strength, but was quickly followed by a reversal due to increased sell volumes. This signals that smart money may be accumulating positions before a larger move.
Price Action and Patterns
On January 6, a strong “Buy Volumes Max” pattern indicated bullish intentions, but resistance at $228.23 capped further growth.
On January 7, a “VSA Sell Pattern 3rd” hinted at a bearish reversal, driving prices back to support levels.
Key takeaway: The interaction between support at $214.99 and resistance at $223 will be pivotal in determining the next directional breakout.
Fundamental Factors to Watch
Amazon’s fundamentals remain strong, with steady revenue growth driven by AWS (cloud services) and robust e-commerce performance during the holiday season. However, rising interest rates and inflationary pressures continue to dampen consumer spending and could act as a headwind.
Trading Plan: Targets and Stop-Loss Levels
Based on the current setup, here’s a practical trading roadmap:
Short-Term Bullish Scenario:
Entry: Above $223 after confirmation of a breakout.
Targets: $228, $233.
Stop-Loss: $220.
Bearish Alternative:
Entry: Below $214 with strong bearish candles.
Targets: $209, $198.78.
Stop-Loss: $217.
Forecast: Where Are We Headed?
In the short term, Amazon is poised for a potential bullish breakout if it clears resistance at $223. However, caution is warranted if macroeconomic conditions shift. Our long-term view remains cautiously optimistic, with a forecast targeting $240+ by Q2 2025 as the broader market stabilizes.
Conclusion and Call to Action
This analysis is powered by TheWaved™, utilizing advanced tools and methodologies. If you have any questions or want a deeper dive into our methods, feel free to reach out via direct messages. Remember, all the professional indicators and insights are available in the profile header. Follow for more ideas, and let’s trade smarter, not harder!
Concept of Rays
Explanation of the "Rays from the Beginning of Movement" Concept
Core Idea
My proprietary analysis method is based on using rays constructed on Fibonacci mathematical and geometric principles. These rays create a system of dynamic levels that help predict precise asset movements and identify key zones where price interactions occur. Price interaction with these rays signals probable scenarios: either a reversal or a continuation of movement, but only after interaction and the appearance of dynamic factors and patterns.
Why Predicting Specific Levels is Not Possible
Financial markets are nonlinear systems, where price movement is determined by numerous variables, including market volumes, liquidity, macroeconomic factors, and participant psychology. Instead of attempting to predict specific levels, I propose analyzing probabilities of price reaction at pre-calculated key zones. Price interaction with rays provides additional insights into the direction and strength of movement.
Stay sharp, trade safe, and may the markets favor your strategy!

AMAZON Will Keep Growing! Buy!
Hello,Traders!
AMAZON is trading in a
Strong uptrend along the
Rising support line so
After the retest of the
Support we will be expecting
A further bullish move up
Buy!
Comment and subscribe to help us grow!
Check out other forecasts below too!

AMAZON SUPPORT CLUSTER|LONG|
✅AMAZON is trading in an
Uptrend and the stock is
Now making a local correction
But will soon hit a support
Cluster of the rising and
Horizontal support lines
Around the 213.83$ area
So we are bullish biased
And we will be expecting
A further bullish move up
LONG🚀
✅Like and subscribe to never miss a new idea!✅

A Reversal on Amazon. AMZNAlways a purely technical approach, while trading is examined. A few factors to suggest a reversal play here, and we have a double divergence on RSX momentum, diminishing volumes on the profile, apparent Elliot flat possibly in motion and a triple drive completion in position of Wave B of the flat. Inherently, reversal plays come with a higher risk nearly always, yet can be quite profitable at times. Volatility, stochastic oscillators are suggestive on the weekly chart.
We are not in the business of getting every prediction right, no one ever does and that is not the aim of the game. The Fibonacci targets are highlighted in green or purple with invalidation in red. Confirmation level, where relevant, is a pink dotted, finite line. Fibonacci goals, it is prudent to suggest, are nothing more than merely fractally evident and therefore statistically likely levels that the market will go to. Having said that, the market will always do what it wants and always has a mind of its own. Therefore, none of this is financial advice, so do your own research and rely only on your own analysis. Trading is a true one man sport. Good luck out there and stay safe.

BABA 150+, looking forward and here is whyGoldman Sachs Is Bullish on China’s Stimulus
I have selected BABA and want to consider buy the deep strategy and here is why.
Alibaba’s stock has occasionally been undervalued compared to its peers, offering opportunities for investors seeking growth at a reasonable price.
P/E = 11.6, which is one of my favorites ratios, when Amazons P/E higher 45 atm.
Investing in Alibaba Group can be attractive for several reasons.
First of all its still E-commerce Leadership in China. Alibaba is a dominant player in China’s massive e-commerce market (and not only in China), which has immense growth potential due to increasing internet penetration and consumer spending. Platforms like Taobao, Tmall, and Lazada position Alibaba as a market leader in both domestic and international markets.
Alibaba not just a e-commerce marketplace and Babas Cloud is the largest cloud service provider in China and one of the global leaders, competing with Amazon AWS, Microsoft Azure, and Google Cloud. The cloud computing segment has been growing rapidly and has significant potential for profitability and scalability.
And the last and the most significant case from BABA - they invest heavily in AI, logistics automation, fintech, and consumer analytics, keeping it at the forefront of technological advancements in its industry.
Meantime geopolitical tensions, especially, U.S.-China trade tensions and potential delisting threats and slower economic growth in China could impact on stock prices.

Amazon I Strong Growth Projections - Next Long Opportunity Welcome back! Let me know your thoughts in the comments!
** Amazon Analysis - Listen to video!
We recommend that you keep this pair on your watchlist and enter when the entry criteria of your strategy is met.
Please support this idea with a LIKE and COMMENT if you find it useful and Click "Follow" on our profile if you'd like these trade ideas delivered straight to your email in the future.
Thanks for your continued support!Welcome back! Let me know your thoughts in the comments!

NVIDIA 200 BEFORE 2026 !!! CAFE CITY STUDIO
NVIDIA (NVDA) has been at the forefront of technological innovation, particularly in the realms of AI and graphics processing, positioning it well for significant stock price growth. Here are several reasons why NVIDIA's stock might hit $200 by 2025:
Dominance in AI and Data Center Markets:
NVIDIA's GPUs are the backbone for many AI and machine learning applications. Their leadership in this space, especially with the advent of AI-driven technologies across industries, is expected to keep revenue growth robust. The company's data center segment has seen exponential growth, with analysts predicting a continued upward trend due to the increasing demand for computing power in AI applications.📷📷📷
Strategic Product Roadmap:
NVIDIA's product pipeline, including the Blackwell architecture, is anticipated to propel the company forward. The Blackwell chips, expected to launch in 2025, are designed to push performance boundaries for AI applications, potentially capturing more market share and driving revenue. The expectation around these new architectures creates a bullish outlook for
NVIDIA's stock.📷📷
Strong Financial Performance:
NVIDIA's financial results have consistently outperformed expectations. For instance, Q2 FY 2025 saw a revenue increase of 122% year over year, demonstrating the company's ability to maintain high growth rates. Despite a natural slowdown expected due to tougher year-over-year comparisons, the company's growth is still projected to be impressive at around 43% for FY 2026, supporting a narrative of sustained stock price appreciation.📷📷
High Barriers to Entry and Market Moats:
The complexity and performance of NVIDIA's offerings create high barriers for competitors, ensuring NVIDIA's market leadership. Analysts highlight NVIDIA's 24-month technological lead in AI GPUs, with high switching costs for customers locked into NVIDIA's ecosystem. This moat is expected to support premium pricing and market share retention, which could translate into stock value growth.📷📷
Analyst Optimism:
Numerous Wall Street analysts have set price targets for NVIDIA well above its current levels, with some predicting it could hit $200 or more by 2025. These forecasts are based on NVIDIA's strong fundamentals, technological edge, and market position in AI and computing solutions.📷📷
Market Sentiment and Valuation:
Even though NVIDIA's stock trades at a premium valuation (62 times trailing earnings as of recent data), analysts believe that its growth trajectory justifies this price. If NVIDIA continues to meet or exceed growth expectations, its valuation could expand further, driving the stock price towards $200. However, achieving this target would require either a significant earnings surge or a market sentiment favoring even higher multiples for tech growth stocks.📷
Global AI Adoption:
Posts on X highlight the ongoing global shift towards AI, with NVIDIA at the forefront. The demand for NVIDIA's computing solutions is expected to grow as AI becomes more integral to various sectors, from automotive to cloud computing, thereby supporting stock price growth.

Amzn wk longsAmazon wk showing longs. We can use this demand for daytrades upto its departure area only. After hitting departure we will decide either we go up or down.
