Amazonlong

Amazon starts to look bullish Weekly chart looks good. We are in an uptrend as of today. We have reached support at the 100 moving average. Anticipating a move up this coming week.

Amazon to return to above $2000I've been watching Amazon for a while now with the expectations of a return to its past levels of over $2000 and it seems the time for that may be just around the corner. Here I've displayed NASDAQ:AMZN completing a Gartley pattern on a weekly timeframe and have also referenced the RSI which seems to show that there is still a comfortable amount of room to run should we not diverge. On the daily timeframe we have also completed an Elliott wave that lasted from February until June giving further evidence the bulls should continue to take Amazon higher.
In addition to all this, I expect the G20 summit to result in some form of positive news as well equity indices to maintain their rise in anticipation of a July rate cut. Of course trade with caution as these macro influences are never guaranteed of being bullish, recommend a trailing stop or a stop loss set around 1850.


Amazon AMZN LongHi guys its Brian here with a long opportunity for Amazon AMZN.
Amazon was previously in a down trend but bounced off the previous resistance which became a strong support. The price is showing strong bullish momentum and possible profit targets could be 0.382 or 0.5 fib extension levels at 1923 or 2000 respectively.
www.brianchai.com
Free Facebook Trading Group

Elliott Wave View: Further Rally in Amazon (AMZN)Since bottoming on December 24, 2018 low, Amazon (ticker: AMZN) has continued to recover. The sequence from December 2018 low remains incomplete with 100% extension coming at $2033 – $2143. In shorter cycle, we can see from the chart below that the pullback to $1818.90 ended wave 2. Wave 3 is in progress and subdivides as an impulse Elliott Wave structure. Up from $1818.90, rally to $1876.47 ended wave ((i)) with subdivision also as an impulse of lesser degree. Wave (i) of ((i)) ended at $1853.67, and wave (ii) of ((i)) ended at $1840.26. Wave (iii) of ((i)) ended at $1869.72, wave (iv) of ((i)) ended at $1852.50, and wave (v) of ((i)) ended at $1876.47.
The stock then pullback in wave ((ii)) and ended at $1845.28. Internal of wave ((ii)) unfolded as a zigzag where wave (a) ended at $1855.01, wave (b) ended at $1870.82, and wave (c) ended at $1845.28. Wave ((iii)) is in progress and Amazon can see 1 more leg higher to end wave ((iii)) before pulling back in wave ((iv)). Similar to wave ((i)), the internal of wave ((iii)) subdivides as an impulse structure in lesser degree. Wave (i) of ((iii)) ended at $1894.95, wave (ii) of ((iii)) ended at $1882.50, wave (iii) of ((iii))) ended at $1929.26, and wave (iv) of ((iii)) ended at $1916.59 and wave (v) of ((iii)) ended at $1933 peak. Below from there it is in wave ((iv)) pullback. The stock should continue to find support in 3, 7, or 11 swing as far as wave ((ii)) pivot at 1845.71 remains intact. We don’t like selling the stock.

Flag and Pennant at $AMZNWe can see a sharp 15% rise in the of AMZN from the 8 to the 21 of march
Then we can see a little consolidation with a support at around 1747$
AMZN today just broke the upper trendline and I am now looking to long it around 1815$
Stop Loss is just slightly below the support line of the pennant at around 1740$
Profit Take would be the height of the flag + the lower trendline (support) of the pennant. This would result in a profit take at around 1980$ resulting in a 2.2 risk/reward ratio.

AMZ thoughts1. Enter a long position under 1550, close out your position 1830-1885. Target will be reached at the end of the year.
2. Enter a short position above 1800, close out your position 1600-1650.
3. Enter a long position under 1680.

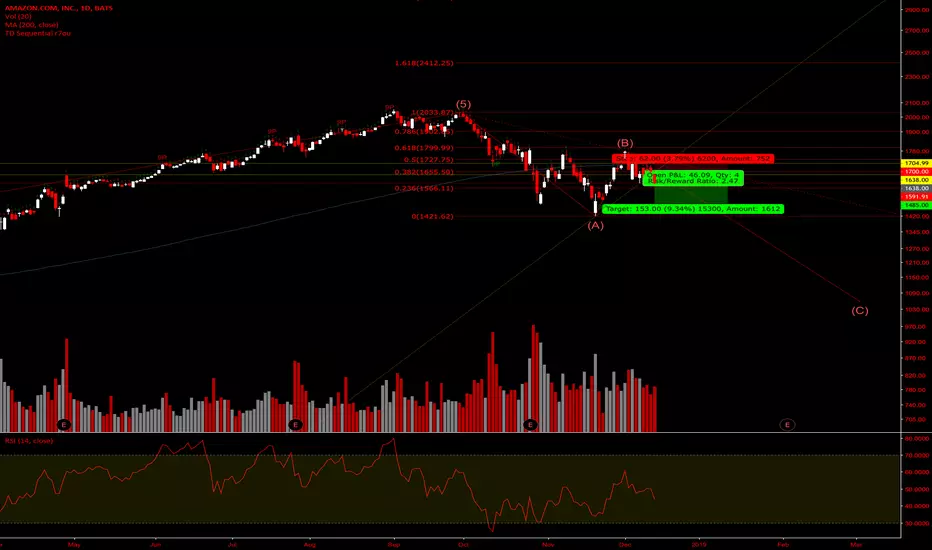
BLOX CALLS TOPS [AMAZON] Technical Analysis & Forecast Daily chart of AMZN . As we can see here the chart is still in bearish territory as we sit below (45) on the RSI with last weeks hidden bearish divergence seemingly playing out. We have our bearish continuation pattern of the October double top @ 2000 being respected and now confirmation of new resistance at the 1800 mark. We have clear rejection of the golden ratio (.618) on our Fib @ 1799 and per Elliott Wave Theory , we are on leg (C) of the corrective wave which shall fall until we rest nicely around 1000-1100 level --- to revisit our present 200MA. We have entered a short this morning @ the open of 1638 and have a tight stop loss @ 1700. Short term target at 1485. Enjoy your weekend everybody. As always, BLOX CALLS TOPS!
Amazon: Best time to buy for $3300.Amazon completed last month a decline of more than -30% unsettling investors. But is such a % loss in price that uncommon?
A more careful look into AMZN's price action (log scale) since 2009 and after the markets stabilized from the 2008 crisis, shows that the stock had pull backs of around -30% on another 4 occasions. Each time the stock grew by a minimum of +134.50% in the monthly candles that followed until the new -30% decline occurred. The quickest of the growth periods that followed was conducted in 14 months.
If we apply those parameters on today's price action we can assume that November's 1,420.00 was the bottom and by January 2020 (14 months) Amazon will complete a +134% rise near 3,330.
Technically the 1M technical indicators are in favor of a sustainable uptrend from now on as an RSI of 67.035 and Highs/Lows of 85.6885 are characteristics of an uptrend channel while the neutral RSI = 52.949 and Highs/Lows = 0.0000 on top of a bullish MACD = 0.950 on 1W, characteristics of a support.
** If you like our free content follow our profile (www.tradingview.com) to get more daily ideas. **
Comments and likes are greatly appreciated.

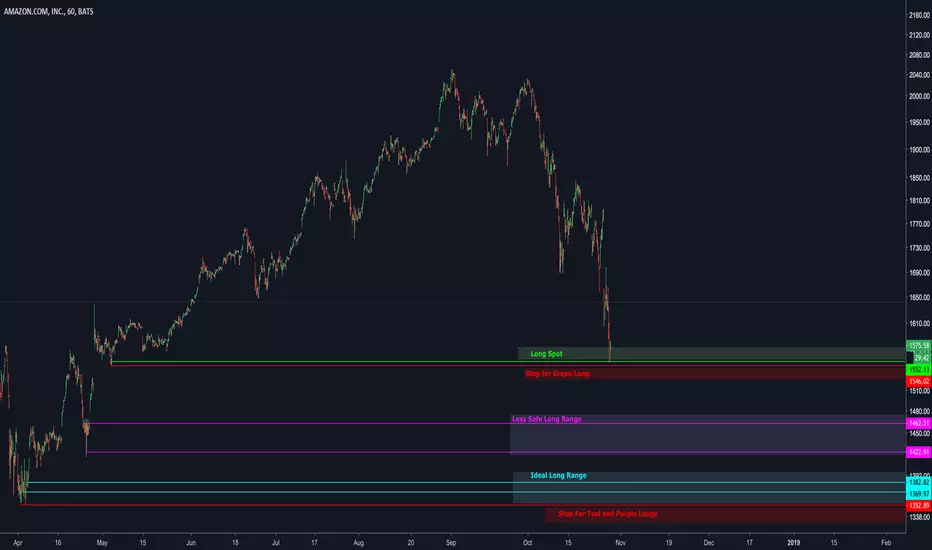
AMZN Long RangesSome good long ranges and associated stop ranges. Green is decent, close stop. Purple is a alright but be prepared to take a bigger hit from the gap to its stop. Teal is the best, super close stop and solid upside.
AMAZONPossible completion of a Shark on the Amazon chart. Two possible C points of the pattern, converging in the area of the 0.886 retracement – 1.13 extension ($ 1970/2100). Stop loss at $ 1395/1400.

Amazon (AMZN) Is still a good shortMain idea on chart. The past AMZN trade is up 12% and my short trade is currently up over 4%. You can find both original ideas in the related section.
We can see this is probably not just a dip but a real trend change? If we do recover from this, keep in mind we are going to see a correction in the next few years.
Thanks for viewing!

Amazon 1645 cupandhandleWe found on the private mentoring a reversal trend. It is called in hungarian fulescsesze, cupandhandle. We saw also on macd f12 s26 we can see the upper trend.
1645 was the amazon price to took a strike position with 60 euro on a binary platform. You can see the last 3 minutes on this video.

AMAZON I BUY THE FEAR (DIP OBVIOUSLY) Amazon has been in a bearish pullback for a month now, starting at the beginning of October and now showing signs of bullish continuation
-
We don't need to explain why it's a great idea to buy into this stock, Amazon are great innovators and are backed by an even greater economy (Don't listen to the constant bears, they have been saying a crash will come every year since 2009...idiots)
-
Technical to accompany, the RSI is showing divergence and the recent earnings report have brought in the buyers. Advised entry is at trend-line break and close, with stops at the 1472.68 level and take profit till your hearts desire.

AMAZON looking for a rebounceamazon correction should be done, hitting 3 years long support line + oversold rsi.

Amazon About to have a Big bounce back to $1745 and $1820In my previous analysis I talked about this drop with a short target about $1569. Right now we can see a bullish divergence on a daily time frame and a short term capitulation, which means the market will have a good bounce around + 12% bounce during this week, targets $1745 and $1820

AMZN - Have we reached the top?Labeled some key levels of significance and used a fib retracement chart to estimate landing zones.
Prior mini-tops retraced to about the .5 fib level. The larger cycle correction could also obey this level but may drag lower to the .618 range, which is why I gave a range for where the price could land.
~1600 is a key level of significance, if it breaks we will be going much lower.
The real question is, can amazon reach ATH? Watch the volume carefully when we have the bounce back up. Should be good indicator for remaining bull strength.

AMZN potential level fieldAMZN looking to possibly fill this level and bounce off, if the level fails then we will fall more..duh:)

Amazon (AMZN) Good to shortI have been short Amazon since 1870 and am currently in good profit.
Amazon has been overvalued for a long long time. If people do not regain confidence in the stock it will drop much more.

Bearish reversal imminent for Amazon?Looking at the RSI levels the Amazon price could be due for a bearish reversal very soon so wait for confirmation.
Like this idea if you agree.

Amazon Elliott Wave View: Further Upside ExpectedHello Traders,
Amazon near-term ended the cycle from 07/31/18 low (1739.56) at the peak of 08/15/18 (1926.26) in black wave ((i)). The internal structure of black wave ((i)) unfolded as a 5 waves structure with an extended blue wave (iii). It ended blue wave (i) at 01/08/18 peak (1800), blue wave (ii) pullback at 02/08/18 at (1818.61) , blue wave (iii) at 08/13/18 peak (1925.72) and blue (iv) pullback at 08/13/18 (1893.80) and finally it ended blue wave (v) of black ((i)) at 08/15/18 peak (1926).
Below from there, it ended black wave ((ii)) pullback at 08/17/18 low (1855.58). Up from there, it is currently in the progress of another 5 waves structure higher. It ended red wave i at 08/21/18 peak (1898.46), red wave ii pullback at 08/21/18 low (1870), red wave iii at 08/23/18 peak (1920) and red wave iv pullback at 08/23/18 low (1900). Up from that low, it can end soon red wave v of the blue wave (i) before a pullback in the sequences of 3-7 or 11 swings in blue wave (ii) can be seen. As long as the pullback stays above 1855.58 invalidation level we expect it to extend higher due to the right-side tag. The right side remains to the upside. We don’t like the selling.
