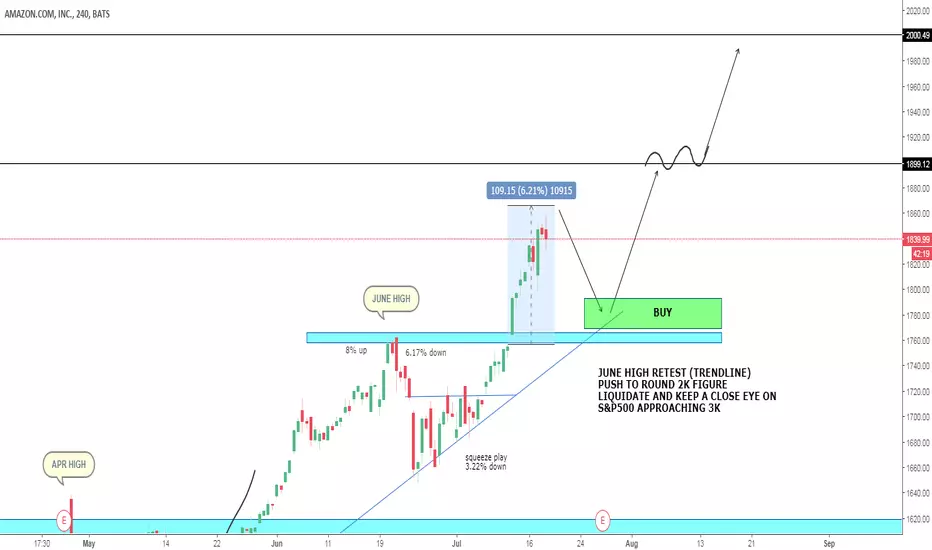
AMAZONWaiting for a retest of the highs made in June which would also bring about another bounce on the drawn trendline.
If market is able to fall to these highs, my next set of buy orders will be triggered (green box).
I will begin closing down on my positions in Amazon however as we enter 2019 and move into 2020, or rather as the SPX approaches the 3000 region which I see as a major barrier for the stock market.
More analysis will be posted as we approach the 3000 region on the SPX.
Amazonlong
Elliott Wave Analysis: Amazon May Start Another Extension HigherHello Traders,
Let's have a look at the Amazon 1 hour chart.
Short-term Elliott wave analysis suggests that pullback to $1646.48 low ended blue wave (2). Above from there, the stock is rallying higher in blue wave (3). The internals of that extension higher is unfolding as Elliott wave impulse structure with sub-division of 5 waves.
Above from $1646.48 low, the rally to $1858.88 high ended red wave 1. The internals of that rally higher took place in another 5 waves impulse sequence in lesser degree cycles. The first leg of a rally to $1725 high ended black wave ((i)) as Leading diagonal structure. Then the pullback to $1682.15 low ended black wave ((ii)) pullback as a Zigzag correction. Up from there, the rally higher to $1841.95 ended black wave ((iii)) in 5 waves. black wave ((iv)) pullback ended at $1791 low, and black wave ((v)) of red wave 1 ended at $1858.88 high.
Below from there, the stock did a 3 wave pullback in red wave 2, which is proposed to have completed the correction against $1646.48 cycle low. After reaching the blue box 100%-123.6% Fibonacci extension area at $1787.19-$1775.77. However, a break above $1858.88 high remains to be seen to validate this view & until then, a double correction lower in red wave 2 can’t be completely ruled out. Near-term, while dips remain above $1769.99 low and more importantly above $1646.48 low the stock is expected to resume the upside. We don’t like selling it and the right side remains to the upside.

Elliott Wave Analysis: Amazon Showing Impulse RallyHello Traders,
In this Elliott Wave Analysis, we will have a look at Amazon.
Short-term it is suggesting that the cycle from 6/25/2018 low ($1646.31) is rallying higher in an impulse structure. This suggests that the internal sub-division of each leg higher is unfolding as 5 waves structure of lesser degree i.e black wave ((i)), ((iii)) & ((v)), whereas wave ((ii)) & ((iv)) has subdivision of 3 corrective waves.
Up from $1646.31 low, a rally higher to $1725 high completed black wave ((i)) in 5 waves leading diagonal structure. Down from there, the 3 waves pullback to $1684.30 low ended black wave ((ii)) as zigzag structure. Above from there, the stock made another 5 waves advance which ended black wave ((iii)) at $1841.95 peak. Below from there, the pullback to $1791 low ended black wave ((iv)) in lesser degree 3 swings. Up from there black wave ((v)) remains in progress which is expected to unfold in another 5 waves structure.
Target for black wave ((v)) comes at $1868.58-$1887.15 ( black wave ((v))=((i)) ) area for the completion of cycle from 6/25/2018 low in red wave 1 or wave A. Afterwards, the stock is expected to do a pullback in red wave 2 or wave B in 3, 7 or 11 swings before further upside is seen provided the pivot from $1646.27 low stays intact. We don’t like selling it.


AmazonLooking for a continuation on this bullish run. I do see possible retracements at key demand levels which also line up with important Fibonacci and support levels. Right now I'm long on this pair until market gives an indication to go other wise.

AMZN BUY SHORT TERM OPPORTUNITYIN THE STORM OF THESE DAYS AMZN STILL BE ONE OF THE BEST STOCK IN THE MARKETS.
SHORT TERM BUY OPPORTUNITY IF THE LEVEL 1350 REJECT THE FALL OF THE LAST DAYS.
STOP LOSS UNDER 1347, TAKE PROFIT 1418.


Amazon Curves and dips, keeps rising every dayAmazon has a cool trend line where in between the open and the middle of the day, there is a SHARP boost of 1-3%, then it just sits there all day near the same gains, before repeating this everyday. Earnings and expansion are jolly good, but the VIX is still way up, and equity fears still linger. According to bloomberg, there is a high chance that the market collapses before March again. Amazon is usually the one that looses 6% every day, cutting everything that happened in the last month, so BE CAREFUL, the last market crash isn't the same as the next. Good Luck Trading!

Bullish on Amazon after dipI think Amazon will see some nice gains in the near future, maybe so highs even. When we broke that $982 support line earlier we saw rises in excess of $1050. If history repeats itself we could see this again and then some. This is my forecast of future price action, will be interesting to see how it plays out :)

Where is AMAZON going? (How to Trade Amazon's Stock in August)Are you long on AMAZON? Maybe short (for some reason).
Either way- here is an ideal trade setup. All the levels are listed out on the chart for buyers and short sellers, and if we get the break (bearish play) with a confirmation on our MACD, I would consider entering short for the time being! Yes, shorting AMZN, would you believe it?
Or maybe our daily trend line doesn't break? Well I'm in after it holds again, buying the dips, and riding up to the take profit zones.
I will keep updating the chart as we move along- so make sure to follow either this chart or my profile for important updates.

Amazon short term buyWe are long on the Amazon.
Targeting the near term resistance on the AMZN, at the 963 area.
AMZN in the near term is technically positive. We recommend an opportunistic buy with an entry below 944.76 with a primary target at 963.23.

$AMZN Bullish Entry on Fundamental MoveAmazon (AMZN) announced as a catalyst to the upside they'd be eliminating a non-profitable acquisition from 7 years ago. This gave the bulls a run due to the massive cash flows dumped back into acquiring and expansion of the company, and shows a shift in focus to producing hard earnings numbers down the road. This likely will drive price further up into the earnings announcement due to speculation of further growth in the company in the long run.
Granted, from a long term perspective, AMZN is one of our least favorite companies fundamentally due to the huge overvaluation it currently poses to earnings, but from a short term perspective, it's great for a short term Skip-strike butterfly or spread trade.

AMZN@ 1h @ was this last week a false breakout or constructive ?Take care
& analyzed it again
- it`s always your decision ...
(for a bigger picture zoom the chart)
Best regards
Aaron

AMZN @ daily @ will bulls recapture 820$ price this january`17 ?Take care
& analyzed it again
- it`s always your decision ...
(for a bigger picture zoom the chart)
Best regards
Aaron

AMZN @ 1h @ will we find us around yearly sma by 704.84 ?Take care
& analyzed it again
- it`s always your decision ...
(for a bigger picture zoom the chart)
Best regards
Aaron

AMZN @ daily @ after W TrendReversal broked, will 200 MA holds ?Take care
& analyzed it again
- it`s always your decission ...
(for a bigger picture zoom the chart)
Best regards
Aaron

long AMZN @ 15 min @ trading capability for this 51st week`16This is only a trading capability - no recommendation !!!
Next week i`ll confirm or change my opinion about this SetUp :)
Buying/Selling or even only watching is always your own responsibility ...
Best regards
Aaron

AMZN @ Daily @ Crucial Days until Christmas (year end 2016)AMZN lost -16,83% from it`s all-time by 847.21 (2016/10/16) until 710.10 (2016/11/14)
Meanwhile the 2nd main upside trend broked also - with a GAP! And this GAP is also the 1st target to get back on a bullish track. I am slightly optimistic, but i want a visual evidence - want to see the shares even to trade between 789.49 & 815.43. Buying before is also an oppurtunity, `cause the downside trend, which even breaked the 2nd main upside trend was left behind while last wednesday trading day ...
How ever, maybe i am too kosher !?
But i want to see the share even trading out of the downside trend - even between the GAP, if it has to be ?!
And from thi points of view, all in all, i am still pretty neutral - and would like go long much higher over next week, if even the broked downside trend holds ...
Possible short-term target for bears are, in my opinion :
736.70 2nd leg of the w-wave
710.00 1st leg of the w-wave
Possible short-term target for bulls are, in my opinion :
792.40 lower middle high of the w-wave & end of the extended downside trendline
843.09 start of the extended downside trendline
For mid-term trendfollower traders the all-time high (847.21) could be a support line to get long - even like the alll-time high from last year by 696.44 (2016/12/29) for bears to get mid-term short once again ...
Take care
& analyzed it again
- it`s always your decission ...
(for a bigger picture zoom the chart)
Best regards
Aaron
