#AMZN Trading plan! Hello friends!
Amazon has been trading in a channel between (3090-3350) $ since November
Since the end of January, the price bounced off the support level of 3090$ and rushed up.
Having made a false breakout, the price rolled back and went up again!
At the moment, for the fourth day, the price is moving towards the level of 3050$.
After the breakout of this level, we can get a good move to the next resistance level 3495$.
Also, further growth cannot be ruled out, since the price traded in the channel for a long time.
There will be enough energy at the exit from the channel to break the 3495$ level.
✔ Do not forget to trade using your own trading system and with stops!
✔ If you like what I do, put 👍 and subscribe! 🙌👀
✔ This is the best gratitude for my work! 💕
Amazonlong

Amazon Update - go longThe Idea is to go long - following the CONTINUATION PATTERN - SYMMETRICAL TRIANGLE UPTREND theory.


Amazon: Just in case it's wave 5 comingWill the company be better off without Jeff as it happened before with Google and Microsoft?
We are yet to see.
Meanwhile if it's the end of wave 4 "wedge" correction we might see the stock up to 4345.
Decline below 3090 will make it less relevant.

AMZN Bullish Trade Setup, Running Triangle AMZN Bullish triangle pattern complete targeting wave (5) upside that may reach 4056. The immediate rally should reach initial target of 3540 and then 4056. Look to establish bullish positions like a vertical on AMZN.


#Amazon - Bullish - But I sell all positionsFrom a purely technical chart perspective, I continue to see Amazon bullish.
A breakout means rapidly rising prices.
I wanted to hold the shares longer but out of my inner conviction that was no longer possible. There are enough alternatives for investments.
Therefore, I sold all Amazon shares from the depots last week, because I consider freedom of opinion and diversity of opinion to be the highest good. In the course of time, censorship has always led to further radicalization and even to war/civil war. This is what history teaches us.
The measures that Twitter, Google, Facebook and Amazon have therefore taken in recent weeks to suppress opinions, I consider as dangerous as the silence of the alleged "democratic" forces in the world. That many media/gazettes celebrate this, shows actually only whose spiritual child dwells in their owners mind.
With their market-dominating position, these companies must be broken up as quickly as possible. Not only from a monopolistic and competition law point of view, but above all because they can and already do massively restrict freedom of opinion and diversity of opinion.
Best regards from Hanover, Lower Saxony
Stefan Bode
Please also still like the publication of the similar idea attached below.


Amazon Breakout leaves little to doubt. Low-risk 18% profit!Today's impressive AMZN daily candle signals a breakout of a 4-month long triangle. Measuring the height of the triangle at its basis gives a target of $3886, that's 18% profit. Taking the stop loss a bit below the previous swing low at $3050 gives us a clean trade of 2:5 risk-reward ratio. The day hasn't closed yet but let's hope the green candle stays solid.
The rising arrow I drew plateus horizontally at zones that I believe are resistance zones measured through Fibonacci extension from the previous swing.

Amazon to ATHI'm expecting Amazon to break out of the symmetrical triangle and go towards a new ATH. (earnings report soon)

AMZN getting ready for a move upAfter the huge move up during the first months of the pandemic AMZN has been taking a breather for sometime now and consolidating within the pennant, which is a continuation pattern. RSI and MACD (not on the chart) have been pretty flat throughout this time, without big moves up or down, corroborating the consolidation. The Accm/Dist has stayed up throughout the consolidation, which means interest in the stock is not weakening although it is trading on a range. I believe this is a very healthy consolidation that will propel AMZN back to ATH and above in the near future. I have a position in AMZN and am adding at these levels, specially when it moves to the lower half of the pennant.
***If you get anything out of this TA, please like and follow for future updates and more TA. Thanks a lot!***
***THE IDEAS SHARED HERE ARE MY OPINION. THIS IS NOT FINANCIAL ADVISE TO PLACE TRADES. PLEASE DO YOUR OWN RESEARCH AND ANALYSIS BEFORE BUYING/SELLING STOCKS.***

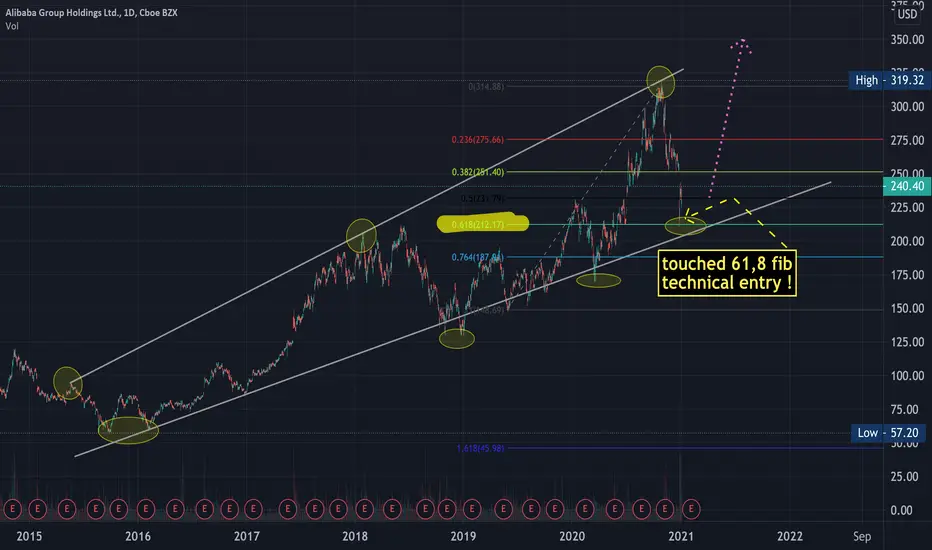
$BABA excelent buy opportunity in AlibabaHolding*Alibaba got it's retrace to technical 61,8 fib level due to investigations from china's govt toward $baba for monopolistic behaviours. This company's fundamentals are just awesome. Just research for yourself, will be amazed. 22% against 5% of amazon in revenue. This company is just exploding and has still much more space on it's way to do that.
Hit my entry level and opened a long positionI should have waited for the breakout however decided to enter on the new higher high to not to be late for the party, now it looks it bounced back from the upper side of the triangle maybe it is going to be ranging in there for a while, still waiting for the TK cross to happen to give us an other confirmation the kumo twist just occured which is positive for now, placed my stop loss bellow the TK lines and just below the triangle.

AMAZON SHOULD IT BUYSymmetrical triangle influence.
Looking to break on the upperside as amazon is being highly used worldwide.
First target should be around 4000


Amazon , bullishHello friends,
I want to give my opinion on Amazon.
This analysis is done in the long term, it does not guarantee or know what may happen in the very short term.
It is in a clear upward trend, since July 2020, a pattern known as a symmetrical triangle began to form.
What does this pattern consist of?
A symmetrical triangle is a chart pattern characterized by two converging trend lines connecting a series of sequential peaks and troughs. These trend lines should be converging at a roughly equal slope. Trend lines that are converging at unequal slopes are referred to as a rising wedge, falling wedge, ascending triangle, or descending triangle.
Symmetrical triangles differ from ascending triangles and descending triangles in that the upper and lower trendlines are both sloping towards a center point. In contrast, ascending triangles have a horizontal upper trendline, predicting a potential breakout higher, and descending triangles have a horizontal lower trendline, predicting a potential breakdown lower. Symmetrical triangles are also similar to pennants and flags in some ways, but pennants have upward sloping trendlines rather than converging trendlines.
In the graph itself, I indicate where the buying / selling zones would be.
Also as I think it will respect the pattern and break upwards, I also indicate where it would be an ideal point to take part of the profits.

$AMZN #AMZN Amazon ready for a break anytime now!Amazon had been consolidating for a while now, bollinger bands are finally getting tight, meaning there will be a volatile move soon! Keep an eye out for the break out of this triangle pattern, a break above would take it to all time highs, a break below might head to 200 MA to retest and then go higher. Either way might not be a bad idea to add a little here, then add more on the breakout or 200 MA.

US Stock In Play: $AMZN (Amazon Com Inc)$AMZN another symmetrical triangle in consolidation, similar to $AAPL (in play) and $TSLA (broken out)


AMZN Amazon Bearish Signals on Bullish Fundamentals In the Q4 institutional buys were 124B compared with 7.69Bil sells.
On 10/30/2020 JPMorgan Chase & Co. Boosted Price the Target price from $4,050.00 to $4,100.00
The Pharmacy business will be a long term growth catalyst for Amazon.
Their cloud service is growing too.
The Holyday sales will most likely surpass the last year`s.
The indicators are still bearish, i won`t buy yet, but wait for a breakout.
If you are interested to test some amazing BUY and SELL INDICATORS, which give the signal at the beginning of the candle, not at the end of it, just leave me a message.

AMAZON 1D-TIMEFRAME ANALYSIS✨AMAZON 1D-TIMEFRAME ANALYSIS✨
Hello ladies and gentlemen
This is my new idea for AMAZON
My idea is that the stock will go higher
Targets
3980
4650
I hope my idea is clear
Support me by like and share
Good luck💰💯
