AMAZON I Technical Forecast Welcome back! Let me know your thoughts in the comments!
** Amazon Analysis - Listen to video!
We recommend that you keep this pair on your watchlist and enter when the entry criteria of your strategy is met.
Please support this idea with a LIKE and COMMENT if you find it useful and Click "Follow" on our profile if you'd like these trade ideas delivered straight to your email in the future.
Thanks for your continued support!Welcome back! Let me know your thoughts in the comments!
Amazonshort

AMZN Weekly Options Trade Plan 2025-04-16AMZN Weekly Analysis Summary (2025-04-16)
Below is a synthesis of all the reports and our resulting view:
──────────────────────────────────────────────
Comprehensive Summary of Each Model’s Key Points
• Grok/xAI Report – Viewed AMZN’s charts as showing a short‐term bearish bias even as some technicals (daily MACD) hint at a possible rebound. – Noted price near key supports and high put open interest. – Recommended a bearish single‐leg play: buying the $172.50 put at a premium of $0.85 (despite that premium being a bit high relative to our “ideal” range).
• Claude/Anthropic Report – Highlighted that on shorter timeframes (and with max pain at $185), some momentum and oversold conditions might create a bounce. – Emphasized bullish short‐term potential, recommending a trade on the $180 call at a premium of $0.71.
• Gemini/Google Report – Interpreted the technicals (EMAs, RSI, Bollinger Bands) as strongly bearish, with price testing a critical support level near $176. – With the options chain showing significant put volume at lower strikes, they recommended buying the $170 put (ask roughly $0.46) for its leverage and within or close to the target premium range.
• Llama/Meta Report – Also examined the multiple technical indicators and noted the mixed signals. – Although they observed bearish factors, their conclusion was cautious enough to state “NO TRADE RECOMMENDATION TODAY” if conditions aren’t optimal.
• DeepSeek Report – Concurred with the bearish outlook on both intraday and daily levels. – Recommended a trade on the $170 put (premium $0.46) with clear risk management (stop out if AMZN rallies above approximately $177.50).
────────────────────────────────────────────── 2. Areas of Agreement and Disagreement Between Models
• Agreements – Most models agree that AMZN is trading below key short‐term and longer-term EMAs, with technical momentum looking bearish. – There is a consistent theme in the options data of high put open interest and strong volume in strikes below the current price. – Several reports (Grok/xAI, Gemini/Google, DeepSeek) favor a bearish put trade based on support levels and risk/reward dynamics.
• Disagreements – The Anthropic analysis offered a moderately bullish case (with a call trade) based on oversold short‐term conditions and a max pain level high above current price. – Llama/Meta expressed enough caution so that if price action does not break expected levels, the trade might be skipped entirely. – The recommended strike/premium differs: Grok/xAI’s $172.50 put is slightly closer to the money with a higher premium, while Gemini/DeepSeek prefer the leaner $170 put (solid liquidity, premium ~ $0.46 in our target range).
────────────────────────────────────────────── 3. Clear Conclusion
Overall Market Direction Consensus: The majority of the reports lean toward a moderately bearish outlook given that AMZN’s current price is below key EMAs, near immediate support levels, and is trading in a high-volatility environment. Although there’s one bullish view (and some caution from Llama/Meta), the bearish technicals and put-side open interest weigh more heavily for a weekly option play.
Recommended Trade (if conditions are met at open): • Trade: Buy a single-leg, naked put option. • Strike: $170.00 • Expiration: April 17, 2025 • Premium: Approximately $0.46 per contract (which sits nicely near our ideal range of $0.30–$0.60) • Entry Timing: Begin at market open based on confirmed weakness below support levels • Profit Target: Approximately a 100% gain on the premium (aiming for roughly $0.90) • Stop Loss: About $0.35 (or exit if AMZN rallies decisively above roughly $177.50) • Trade Confidence: Around 65% given the technical bearish bias and clear liquidity, though mindful of the risk that a short-term bounce at support could reverse the trade.
Key Risks and Considerations: • A sudden short-term recovery (bouncing off support around $176) could trigger losses. • High volatility (indicated by the VIX) means that intraday whipsaws remain possible. • The mixed viewpoints (especially the bullish call suggestion) underscore that any entry must respect tight stop-loss discipline. • News and broader sector conditions could alter momentum unexpectedly.
────────────────────────────────────────────── 4. TRADE_DETAILS (JSON Format) { "instrument": "AMZN", "direction": "put", "strike": 170.0, "expiry": "2025-04-17", "confidence": 0.65, "profit_target": 0.90, "stop_loss": 0.35, "size": 1, "entry_price": 0.46, "entry_timing": "open" }
Disclaimer: This newsletter is not trading or investment advice but for general informational purposes only. This newsletter represents my personal opinions based on proprietary research which I am sharing publicly as my personal blog. Futures, stocks, and options trading of any kind involves a lot of risk. No guarantee of any profit whatsoever is made. In fact, you may lose everything you have. So be very careful. I guarantee no profit whatsoever, You assume the entire cost and risk of any trading or investing activities you choose to undertake. You are solely responsible for making your own investment decisions. Owners/authors of this newsletter, its representatives, its principals, its moderators, and its members, are NOT registered as securities broker-dealers or investment advisors either with the U.S. Securities and Exchange Commission, CFTC, or with any other securities/regulatory authority. Consult with a registered investment advisor, broker-dealer, and/or financial advisor. By reading and using this newsletter or any of my publications, you are agreeing to these terms. Any screenshots used here are courtesy of TradingView. I am just an end user with no affiliations with them. Information and quotes shared in this blog can be 100% wrong. Markets are risky and can go to 0 at any time. Furthermore, you will not share or copy any content in this blog as it is the authors' IP. By reading this blog, you accept these terms of conditions and acknowledge I am sharing this blog as my personal trading journal, nothing more.

Amazon I Technical & Tariff Analysis Welcome back! Let me know your thoughts in the comments!
** Amazon Analysis - Listen to video!
We recommend that you keep this pair on your watchlist and enter when the entry criteria of your strategy is met.
Please support this idea with a LIKE and COMMENT if you find it useful and Click "Follow" on our profile if you'd like these trade ideas delivered straight to your email in the future.
Thanks for your continued support!Welcome back! Let me know your thoughts in the comments!

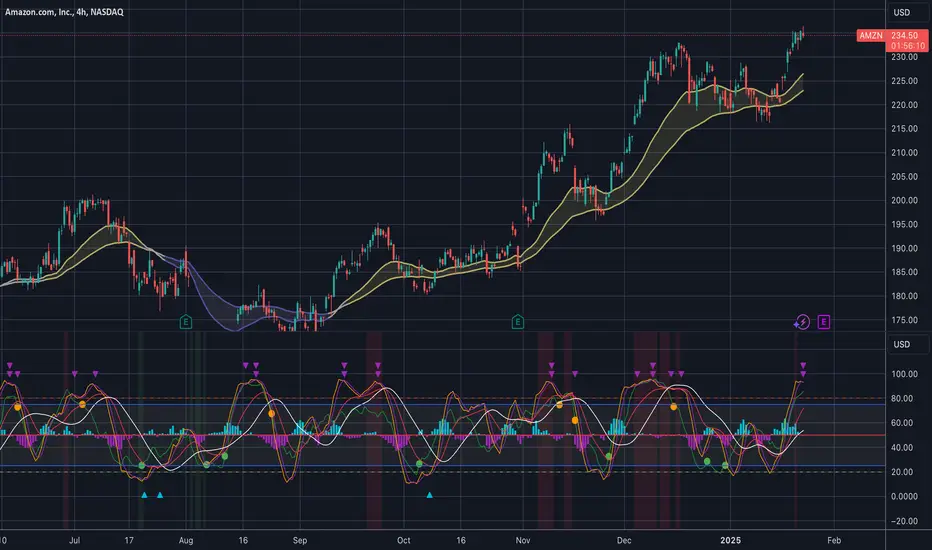
AMAZON going for a DIP on the 4HCrystal ball has spoken, AMZN is due for a small DIP.
Trend Analysis:
• The price is trading in an overall uptrend, respecting the 50 EMA (yellow) and 20 EMA (gold), indicating strong bullish momentum.
• Recent price action has formed higher highs and higher lows, maintaining bullish structure.
JP StochDemark Indicator Insights:
• The indicator is approaching overbought levels, currently crossing above the 80 threshold, which signals potential exhaustion in the short term.
• Bearish divergence is forming as price makes new highs while the indicator fails to confirm.
• Previous occurrences of such setups led to short-term pullbacks before continuation.
Support & Resistance Levels:
• Immediate resistance at $236-$238, aligning with recent highs.
• Short-term support at $ 225 , where moving averages align.
• Strong demand zone around $210-$215, coinciding with prior consolidation.
Trade Signal & Probability:
Bullish Bias : Continuation likely if price sustains above $ 230 with momentum confirmation.
Bearish Pullback : A corrective dip to the $225 zone is probable if momentum weakens.
Target Levels : Upside targets at $240 (psychological resistance) and $250 if momentum persists.
Risk Levels : Watch for breakdown below $225, which could trigger further downside to $215.
Conclusion :
Momentum remains bullish but overbought signals suggest caution.
Monitor for a healthy retracement before continuation. A break above $238 could confirm further bullish momentum.
Like the analysis? Follow, Subscribe for more...
From Prime to Subprime: Why December Could See AMZN Fall
As always, we like to keep it clean and simple, with technicals and analysis that's easy to see and understand. Let's get into it:
AMZN could see a modest correction this December. It's at an all time high, and well into two Wave 5 sequences on the 4h. It's also overbought on an least two oscillators.
We see a 5%+ correction to the $215 price range in the coming 3-4 days .
SUPPORTING OBSERVATIONS:
Recent Rapid Stock Appreciation:
AMZN has seen a significant rise, gaining 14.1% since November 29, 2024. Such swift increases can lead to overvaluation, prompting investors to take profits, supporting the reversal to $215.
Seasonal Competitive Pressures:
Ho ho ho. The holiday season intensifies competition, often leading to increased discounting and promotional activities. This can compress profit margins, potentially impacting Amazon's financial performance and investor sentiment.
Investment in New Ventures:
Amazon's substantial investment in initiatives like Project Kuiper, its satellite internet project, involves significant capital expenditure. While promising long-term, these ventures may pressure short-term profitability, causing some investors to reassess their positions.
Be alert.
Trade green.

Amazon (AMZN) - Potential H&S Reversal, Watch for BreakdownOverview:
Amazon (NASDAQ: AMZN) appears to be forming a Head and Shoulders pattern, which is often a bearish reversal indicator. The left shoulder, head, and right shoulder are clearly defined, with the neckline situated near the $180-$176 zone. If the price breaks below this area, it could signal a larger move downward.
Technical Setup:
Pattern: Head and Shoulders
Neckline Support: ~$180 - $176 (critical support area)
Trendline: Red ascending trendline, currently serving as additional support
Target Zone: Potential drop toward $168 or lower if the pattern confirms
Price Action:
The recent pullback from the right shoulder aligns with the overall pattern, and a daily close below $176 could confirm the reversal.
Watch for a bounce off the neckline for a potential short-term trade; otherwise, a breakdown could lead to a deeper correction.
Risk Management:
A sustained move above the right shoulder (~$190) would invalidate the bearish setup and suggest a continuation of the uptrend.
Catalysts:
Upcoming earnings and market sentiment around consumer spending could influence the stock’s direction, potentially acting as a catalyst for the breakdown or reversal.

Amazon - Buying Pullbacks & Cyclical High Expected SoonHere is what I am watching on Amazon.
-We need to be aware that there is bearish divergence setting up on the quarterly, monthly & weekly charts. HOWEVER, this divergence is not yet confirmed, and is therefore not actionable trade intel at the present moment. We need to monitor these divergences, because if they confirm, they imply significant price moves in Amazon share price.
-MAC strategy for the Quarterly, Monthly & Weekly charts remain bullish. Any pullbacks into the bottom of the MAC are BUY opportunities. I do not blindly buy the bottom of the channels, but utilize lower timeframe entry techniques at these levels to trigger into a position. We are still BULLISH Amazon.
-Cycles suggest that Amazon could put in a cyclical high any time between now and October 10th, before putting in a major cyclical low at the end of October. I would like to see this play out to provide us with nice buy opportunities at the bottom of the MAC's.

Amazon Stock Will Continue To FallIn this setup, we take advantage of a pronounced bearish divergence in the Amazon share.
We are not targeting the low of August 5, 2024 as the price target for a short position, but rather the wick of August 6.

Amazon Layoff 172 Employees at The Facility Near SeattleAmazon ( NASDAQ:AMZN ) is closing a warehouse in Tukwila, Washington, just south of Seattle, following a layoff of 172 employees at the facility, known as UWA5. Amazon ( NASDAQ:AMZN ) spokesperson Sam Stephenson said employees will be offered opportunities to transfer to other nearby facilities or support if they choose not to stay with Amazon. The company is always evaluating its network to ensure it fits its business needs and improves the experience for employees, customers, partners, and drivers.
Amazon ( NASDAQ:AMZN ) employs 75,000 people in the Seattle region, many of them corporate and tech workers, as part of its workforce of 1.52 million people worldwide. Global headcount rose 4% year-over-year, as of March 31. Amazon's warehouse-related operations have driven the year-over-year growth in headcount. Last month, Amazon ( NASDAQ:AMZN ) announced new records for Prime delivery speeds in the first three months of this year, citing a shift to regional fulfilment centers. Amazon has plans to double the number of its smaller Same-Day Delivery facilities in the coming years. Last year, Amazon laid off 27,000 corporate workers, but warehouse jobs were not affected.

Amazon channel is turning bearish to $134.51 watch outAmazon has had an incredible run. It's moved from $118 to $188 since November 2023.
But now it looks like the momentum is starting to slow down.
We haven't got a confirmed signal but we see a slow down in buying and the market is at the bottom of the channel.
There is still a gap to close and for the this reason, I'm anticipating a fall in Amazon in the next few weeks. THe first target will be at $134.51 and will be a medium term analysis.

Amazon Pair : Amazon AMZN
Description :
Bullish Channel as an Corrective Pattern in Short Time Frame
RSI - Divergence
Break of Structure
Rising Wedge in Long Time Frame
CHoCH

AMAZONPair : Amazon AMZN
Description :
Bullish Channel as an Corrective Pattern in Long Time Frame
RSI - Divergence
Break of Structure
Bearish Channel in Short Time Frame and Rejection from Lower Trend Line
Completed " 123 " Impulsive Waves

This Could be the VERY TOP for AmazonI'm getting feelings around the things are about to hit the fan and Amazon might have topped longterm. RSI hit a major resistance, bear divergence, largest FED fund sale ever yesterday, things are just lining up for me, this will get NUTTY if true. Hard to fade this trend of course but a lot of things are lining up for me.

AMAZONIt's quite interesting because there's a gap that hasn't been recharged yet!!! In theory, it should recharge, but I don't think it will happen now; we will go down first, and then the recharge might come later. So, be cautious with the entry. Those with less money should wait for the recharge and only then get in."

Amazon (AMZN) Breaking the RED line and 100$ wall was a big short signal and now we heading to another big support level which is 80$
Wall Street equities were in the red on Monday with Nasdaq leading declines as investors worried the Federal Reserve's monetary policy tightening campaign could push the U.S. economy into a recession.
while Amazon workers will go on formal strike for the first time in the UK, The three major U.S. stock indexes were on track for the fourth straight day of declines since Wednesday, Fed Chair Jerome Powell took a more hawkish tone than expected when the central bank raised interest rates. Powell promised further increases even as weak data showed signs of a weakening economy.
The S&P 500, the Dow Industrials and the Nasdaq have sold off sharply for December, on track their biggest annual declines since the 2008 financial crisis.
Im not close my shorts till we back to 70$ level
are you READY for 2023?

AMAZON is getting Screwed Time to short this Shit as this company had done its bully and now it is going to face its Karma
PARLER is slaping a case against it so we can see a huge fall and bears are there to tear it apart.
check the fib levels and enjoy its fall
please comment you ideas

Shorting AmazonShorting here small size just cause the charts confluence is too much. My other shorts will yield much more % if I am right but cant not trade this chart. Not advise.


Amazon short 45 minShorting Amazon
Speculative short set-up on the 45-min time frame.
Enter the short position if the price break below the up-sloping support.
Stop loss at 106.59
Take profit at 102.59

AMZN breaking down (30 min)As we see Amazon break through the cloud to the downside we should expect more downside to come into next week.. I would play this to the downside until, or if we break the horizontal line which is resistance to the upside. It is possible we test that line and then break down or we just see it keep breaking down from the price it is at now. The good thing is we have broken out of the cloud and should see momentum continue to the downside. Always have a stop loss and it tight.


💥 AMAZON AMZN 4H-TIMEFRAME ANALYSIS💥 AMAZON AMZN 4H-TIMEFRAME ANALYSIS
💗Hello ladies and gentlemen
This is my new idea for 💥AMZN
I hope my idea is clear
Support me by like and share thank you
Stay Safe💯💲💲💲
Good luck💰😍

AMZN (Y23.P1.Video1).Macro reviewHi Traders,
My thoughts on AMZ and key levels to watch and trade.
All the best,
S.SAri
