amazonand again my exceptions was right and now in the 15min chart the new resistance and support is between 3105 and 3190 and its going to brake up soon
Amazontradingsetup

amazonand as I expect it went down to less than 2950
and now it created new resistance and support between 2921 and 3075 on the 15min chart and its going to rice up today or tomorrow be ready for it its going to be big

AMZN LONG SET UP SNIPER ENTRYBUY AMZN
ENTRY 1 2960
ENTRY 2 2945
SL 2930
Tp.1 3030
Tp.2 3130
Tp.3 3230
Tp.4 3330
Tp.5 3460
2,000 account minimum for a .01
Or your account will be destroyed in 30 seconds

Strong buy on AMAZONPrice is respecting the uptrend. (Buy)
Price broke a previous resistance. (Buy)
AMAZON must be kept in the Wallet ! (Buy)


AMZN continue its equilibriumHello everybody, the AMAZON stock price seems entering in an equilibrium range since 14 April, after passing a good uptrend since 16 March.
In the actual conditions, the AMZN stock price will continue in its equilibrium, but could at any time break it :
- above which mean another increasing trend
- or below the rectangle which means a decreasing trend.

Amazon is now in down trending There is big probability that Amazon will keep falling down after a strong breakout

Amazon weekly, 30% drop ?We have just recent established a upper trend line.
The fib 1.618 from previously high/bottom is at 2520.
Target would be 1750 area, but depends on tempo
Going short, no. The trend is to strong, but good indicator for index if we start to se a drop around these lvls.

AMAZON ($AMZN): Was it Bulls or Did the Bears Just Get Squeezed?✨ New charts every day ✨
Like, Comment & Follow to help the community grow 🎉🎉
---
Amazon is the king of online sellers. Was this the bulls that brought us here on COVID-19 strength, or was this all just the bears getting squeezed? Revenue was up last quarter and they don't report again until the summer. Meanwhile, reports say shipping times are getting back to normal. Amazon might be at all time highs, but that doesn't mean it can't go higher.
Resources: www.earningswhispers.com + time.com
---
1. Fractal Trend is showing an uptrend (Aqua bar color) on the 4 hour chart. Lets hope that was from buyers really looking for more continuation and not just COVID-19 bears getting squeezed in early April.
2. With this strategy, we we want to enter long on bullish order blocks plotted by Orderblock Mapping (Blue) and bullish S/R levels plotted by Directional Bias (Blue).
3. For the Bullish continuation, a pullback to R1 after its initial move higher would be the most ideal but not necessarily ensured as there will be large amount of momentum when we break out on the upside.
4. For the Sideways indecision, a small scalp from S1 to R1 is ideal since again we are trend traders so buying support in an uptrend is very much the path of most likely success.
5. Finally for the Bearish Correction preplanning an average entry at either of the S2/S3 ranges is looking great. Of course, this is assuming Fractal Trend is still showing an uptrend when we get to those ranges.

AMZN - SHARKAMZN - SHARK
Month starts with a huge gap down and weekly chart has evening star pattern , daily chart has range breakdown, and hourly suggests shark pattern to unfold.
All time-frames are in sync
Time to fall
Do not follow blindly, do your own research please

#AMAZON - SHOWS A GOOD BULLISH SIGNAL Hello my friends, Please support my free analysis by dropping likes, follow me and why not you can comment as well :)
For any additional info don't hesitate to contact me :)
Enjoy!

AMZN technicaly based forecast
📌Short intro:
I am full time trader - analyst * High accuracy of ideas * Technicaly and Fudnamentaly side in analysis * Comment if have any questions or want to send support
📌Why DepaDigitalTrading:
*Analysis based on my program and tactic readings
*Fundamental side in analysis
*Price action - FIBO - Candl pattern
*FX - STOCK - CRYPTO
*Day trader - Swing trader - Position trader - "Sniper"
*Simple ideas
💡 AMZN technicaly based idea, technicaly indicators showing we can expect higher push up in price, we can see strong bulish candels formed, technicaly picture good, expecting to see push in price till FIBO 0.7 possible and break of 0.7 FIBO
📌Have on mind, trading involves risk, check idea on your own tactic, if have questions pls comment!
Thanks on supporting!
All best, good luck!

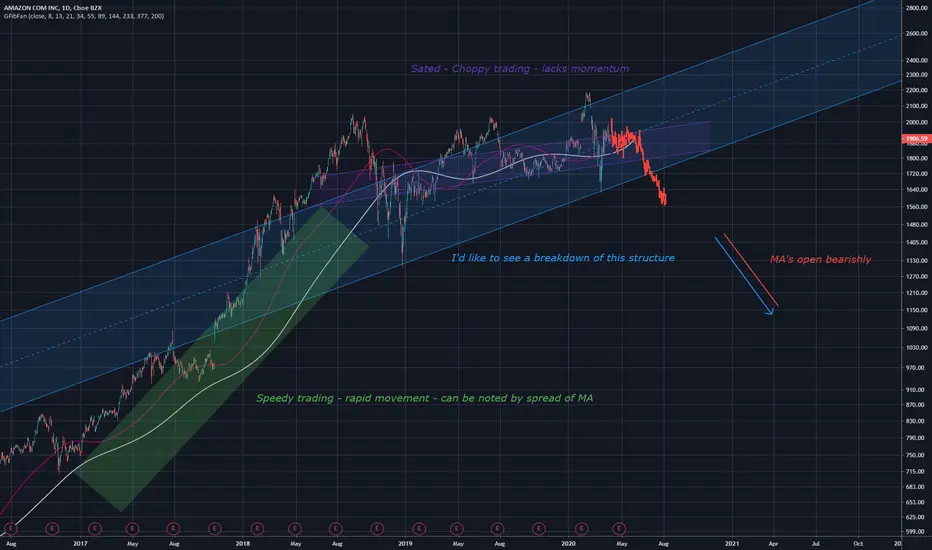
AMZN working hard or hardly working?AMZN has proven itself to has bullish features, but is that momentum slowing down? MA's indicate so, for now, momentum can be seen to be slower than the normal rapid bullish movements that are seen. This momentum will resume once MA's decide on a direction whether it be upwards and continuation of this very weak upward trend or breakdown to begin a new respectable move upward. I would either go long on this or short it.
AMAZON COM INC (AMZN) WeeklyDates in the future with the highest probability for price direction reversals

AMAZON technicaly for expecting is higher bearish market
ENTRY: 1885.00
TP: 1850.00
TP2: 1830.00
TP3: 1800
SL: 1915.00
Chart time frame - 4H
Time for reaching TP - 1-3D
Follow, Like, Share or Comment
Thanks on supporting!
All best!

Now or never week for capitalism. Here we come to a corner. I think this week will be very important for all stock markets in the world. If it breaks this cup & handle, no worries about expected economical fall. But, what if it doesn't break?
Let's wait and see.

Amazon getting power for the uptrendAmazon just crossed 200 EMA on 17th December 2019 and On the other hand Amazon announced to launch its services in Germany. So this Ecommerce Giant is growing more and more. So I am going Long on this stock.

#Amazon - 30% increase ahead? #amznLooks like there'll be no more Stocks left tomorrow. A 30% rise wouldn't surprise me.

AMZN RSI ContinuationBullish RSI continuation. Strong regression trend, Pearson's R value of 0.93 on the monthly chart. A possible cup and handle also.

AMZN Buy Opportunity AMZN has formed a large double bottom buy, continuation of the bullish uptrend is likely, with the recent formation of this rounded bottom.

AMZN Amazon SPRING + DARK POOL TRADES = HAPPY NEW YEAR: GAP UP!!
AMZN technicals pointing to more strength. Expect big GAP UP before opening on Jan 2nd!
Dark Pool Trades have been pouring into AMZN - roughly $3B in last 2 weeks.
Long term uptrend channel former resistance now offering strong support.
Three day downtrend was broken today during consolidation & shows bullish pennant forming.
Downtrend/Pullback from $1900 was caused by end of year writeoff selling for tax purposes - expect those positions to reenter and bandwagon buying from other underperforming retail stocks.
Amzn had record breaking christmas sales - best sales ever reported. Same day and one day also Quadrupled YoY vs quarter 4 of last year.
Short of Entire Market having big time pullback, expect AMZN to continue strong upward move through earnings .
Be prepared to sell earnings . It's no secret that earnings on AMZN will be off the chain - sell the news likely generates our next pullback, but stock will probably be 100-200 points higher if it follows other earnings releases (stock runs up sharply prior to earnings )
New Years BUMP (for all stocks) has historically occurred during first week in January. That will push AMZN even HIGHER than it's momentum...expect $1900 in short order.
NOTE: Watch the SPRING! For more info on institutional spring which may or may not happen since today is a holiday for many, google the Wyckoff Spring.

Amazon in a long level, up to $1850 then $2000?Amazon drops into a key support level where it rotated a few times right at $1745 now its showing signs of strength and volume is starting to increase. It's been in a strong range for 4 months now and it looks like its about to break above. As long as retail numbers don't disappoint in the next few months we'll hit the first target at $1845-1850 and then into $1900. We need to see price break above the year to date POC and hold it as support. Volume on the move higher is really important as well.
Disclaimer: This idea is for educational purposes only, this does not constitute trading or investment advice. TRADEPRO Academy is not responsible for any market activity.

Amazon stock back up to $1950-$2000.Amazon stock has been on the rise for the past few days on strong volume through some key resistance points, one being the year to date POC. The upside structure is starting to build up as well, as the low that caused the move higher was higher than the previous drop. The volume on the recent pop shows promise to the upside. There is a resistance point that is coming up which may spell trouble for the stock.
The resistance between $1845 and $1865 is based on a previous peak high and the 100% Fib extension on the current move. This level could push price down again into the $1770 support however if it breaks the upside is going to open.
Tech has gone up nearly 50% this year alone and Amazon is a lagger, the retail spike during the holiday season will have some effect on the upside of the stock as well.
Disclaimer: The following idea is for educational purposes. TRADEPRO Academy is not held liable for any actions taken in the market as a result of this idea. This idea does not constitute investment or trading advice.
