Quarter reversal from the weekendTo date, we are clearly moving along the scenario outlined in the last review and are approaching an important bifurcation point and the possibility of purchases or toppings by position. The market remains under the influence of multidirectional signals. On the one hand, the positive opening of the quarter gives rise to a powerful market buy-off for the reversal of the quarterly candle for coins. On the other hand, the negative opening of the second half of the quarter delays this wave of purchases. As a result, the growth wave in the middle of the quarter was rather weak, although it was comforted by good growth waves for individual coins. As a result, the main purchases, as mentioned in previous reviews, are expected in the last monthly candle of the quarter.
Against the background of the end of the sales period, the bears have the last opportunity to test 2600 on the air today and tomorrow. Sales attempts will be made against the background of the planned powerful statistics for the United States. Judging by the technical picture, the levels of 2500 and 2600 for ether will not be broken, and as we approach the end of the month, we will see an increase in purchases of altcoins from the weekend, with major breakouts in the new month.
In the most optimistic scenario, the statistics will be negative and will give an opportunity to hike above 2750 this month.
Among the coins to work with, I mainly consider vib og alpaca uft pda vidt in the medium term with likely growth waves up to 70-100%, according to which I will consider increasing the position by the weekend. Ast burger pivx wing quick looks just as good for scalping, with likely growth waves of up to 30%+ at least.
Among the coins with the monitoring tag, troy still looks the most interesting, with open targets in the range of 0.0032-35 and a possible breakout at a retest of 0.0050-75 with a positive market. I am also considering hard and cream for scalping.
According to vite, which unfortunately did not fulfill the technical goals left, there is a fairly high probability of an exit pump over the weekend with an attempt to reverse the weekly candle against the background of its opening above 0.0075 and the bullish last candle. In an optimistic scenario, especially in the case of negative statistics on the United States, there is a possibility of growth up to 0.0125-150-210 , similar to the exit pump of gft, which closed its intended targets before delisting. In a more negative scenario and low volatility, a pullback from the 0.0075-60 levels is likely over the weekend, which can already bring up to 150% profit. I recommend investing in this scenario after the statistics are released and the risk of additional drawdown is reduced. Today and tomorrow, the potential of the 0.0020-25 test remains before the pump. It is also worth weighing the extremely high risk of such an investment. Powerful technical signals remained for this token, up to a retest of 0.021-25, and therefore, after delisting from binance, there is a possibility that these goals will be fulfilled. If the coins remain in stock after delisting, it makes sense to hold them until the end of the attempt to reverse the quarter on the market until the end of April.
AMB

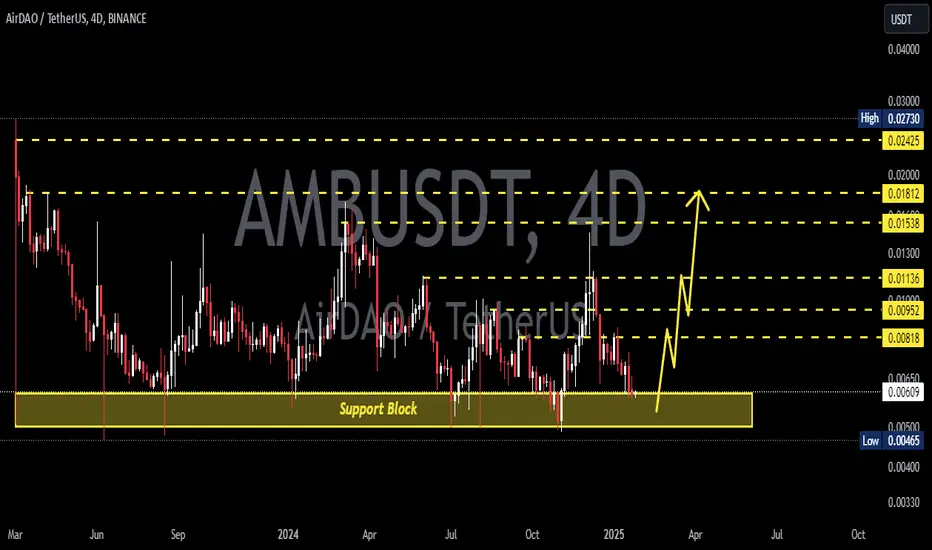
AMB COIN PRICE ANALYSIS... NEXT POSSIBLE MOVES AND TRADE SETUP.MIL:AMB Coin Update!!
• Before Delisting From Binance i am expecting now pottential bounce back in its price from mentioned areas🫡
• you are able to build trade on it with SL If it's meet your strategy as i shared possible setup on a chart✅
• Risk level will be too high so i will recommend if you normally use 100$ in single trade then now use only 20$-30$ max.
Warning : That's just my analysis DYOR Before Taking any action🚨

Stable purchases on OGFollowing the alpaca testing, OG is ready to give a similar picture with an attempt to overtake the previous impulse. The previous impulse has already rechecked the opening level of the year with a local overlap, which opens the way for a test of levels 6 and 7.5. With the current market and the continuing likelihood of a new general drawdown, we are unlikely to see a hike above 6 on the first attempt. On the eve of passing through the middle of the quarter in the next two or three days, there is a high probability of a breakdown attempt of 5 with a stable continuation of the trend until the end of the month. With a more negative market, the volatility of the token may not be sufficient for a breakdown, in which case the probability of smooth growth prevails until the end of the month with a chance to open a new monthly candle above 5.
In the medium term, the token remains a reliable tool for storing funds, as the year opened above the 4.75 support near the key level for volatility growth of 5. Such an opening gives a flat signal for a retest of loyals due to an opening below 5, but also an exit to the 5-7.5 range in the medium term due to an opening above 4.75. Full-time support for a reversal With the current market, it is 3.5, from which there is a probability of a trend up to 7.5+ before the summer. There is a possibility of a test of a lower level of 2.5, but this will happen only in an extremely negative market with a drawdown of bitcoin by 75k or ether by 1500-1750. In this scenario, the token is likely to remain fairly stable and will give a smaller drawdown relative to the rest of the altcoin market, providing an excellent opportunity for topping up.
Along with og, vidt vib PDAs occupy an interesting position, which I primarily consider for storing funds in the mid-range due to the opening of the annual candle above key levels, which gives a signal for its bullish reversal in the future. The main goal for them, similar to alpaca and og, is so far a retest of the opening of the year followed by a rollback.
I am also considering uft wing slf burger ast quick pivx for scalping with a continuing growth potential of up to 30-50%.
Coins with the tag monitoring vite hard cream amb troy with a growth potential of up to 100%+ also retain a high potential for breakouts. Let me remind you that when working with these assets, I recommend keeping a short stop under the price in the first half of the week until noon to insure against delisting, or to hire them from the middle of the week.

UFT are preparing for a trend reversalFollowing the alpaca testing, OG is ready to give a similar picture with an attempt to overtake the previous impulse. The previous impulse has already rechecked the opening level of the year with a local overlap, which opens the way for a test of levels 6 and 7.5. With the current market and the continuing likelihood of a new general drawdown, we are unlikely to see a hike above 6 on the first attempt. On the eve of passing through the middle of the quarter in the next two or three days, there is a high probability of a breakdown attempt of 5 with a stable continuation of the trend until the end of the month. With a more negative market, the volatility of the token may not be sufficient for a breakdown, in which case the probability of smooth growth prevails until the end of the month with a chance to open a new monthly candle above 5.
In the medium term, the token remains a reliable tool for storing funds, as the year opened above the 4.75 support near the key level for volatility growth of 5. Such an opening gives a flat signal for a retest of loyals due to an opening below 5, but also an exit to the 5-7.5 range in the medium term due to an opening above 4.75. Full-time support for a reversal With the current market, it is 3.5, from which there is a probability of a trend up to 7.5+ before the summer. There is a possibility of a test of a lower level of 2.5, but this will happen only in an extremely negative market with a drawdown of bitcoin by 75k or ether by 1500-1750. In this scenario, the token is likely to remain fairly stable and will give a smaller drawdown relative to the rest of the altcoin market, providing an excellent opportunity for topping up.
Along with og, vidt vib PDAs occupy an interesting position, which I primarily consider for storing funds in the mid-range due to the opening of the annual candle above key levels, which gives a signal for its bullish reversal in the future. The main goal for them, similar to alpaca and og, is so far a retest of the opening of the year followed by a rollback.
I am also considering uft wing slf burger ast quick pivx for scalping with a continuing growth potential of up to 30-50%.
Coins with the tag monitoring vite hard cream amb troy with a growth potential of up to 100%+ also retain a high potential for breakouts. Let me remind you that when working with these assets, I recommend keeping a short stop under the price in the first half of the week until noon to insure against delisting, or to hire them from the middle of the week.

AMBUSDT: Will a Bullish Reversal Happen?Yello, Paradisers! Are you ready for the next potential move on AMBUSDT?
💎AMBUSDT is looking strong after a healthy retracement and has now entered the oversold zone—an exciting development for traders.
💎Currently, the price is approaching a critical support zone and showing signs of bullish divergence, which increases the likelihood of an upside move. However, confirmation is key before jumping in. Here's what we’re watching:
💎Scenario 1: For confirmation of a bullish move, we need to see a bullish I-CHoCH (Internal Change of Character) on the lower timeframe once the price reaches the strong support zone.
💎Scenario 2: Alternatively, a breakout and candle close above the resistance trendline with proper volume will also confirm bullish momentum.
💎However, If the price breaks down and closes candle below the strong support zone, the entire bullish outlook will be invalidated. In that case, patience will be key—we’ll wait for a clearer price action setup to form before making any moves.
🎖Remember, Paradisers, trading isn’t about rushing in—it’s about disciplined, calculated decisions. Waiting for the right confirmation can save you from unnecessary losses and keep you on track for long-term success. Stay focused, stick to the plan, and trade smart!
MyCryptoParadise
iFeel the success🌴

AMBUSDT 4DAMB ~ 4D Analysis
#AMB Time frime 4D continues to maintain this support block. This is the right time to start buying back with a minimum target of 20%+
#AMB/USDT Ready to go higher#AMB
The price is moving in a descending channel on the 30-minute frame and sticking to it well
We have a bounce from the lower limit of the descending channel, this support is at 0.00688
We have a downtrend on the RSI indicator that is about to break, which supports the rise
We have a trend to stabilize above the moving average 100
Entry price 0.00700
First target 0.00721
Second target 0.00736
Third target 0.00754

AirDAO (AMB) AnalysisAMB seem to be in a bearish spree. It had a parabolic (almost) 70% move up from 0.0085. Since then coin is retracing back to key levels:
- trendline from weekly at 0.009
- fib retracement level of 0.618 at around 0.00858
- 0.00858 is also a key support zone from weekly timeframe
I would expect a move up from 0.00858 and 0.009 zone

AMBUSDT (AirDAO) Updated till 06-12-24AMBUSDT (AirDAO) Daily timeframe range. we can see a clean push here right at 0.01423. there are some sellers around this resistance but at this volume its not that hard to clear it out. if buyers keeps up it will get back to its mid range. recent support at 0.00987.

200% minimum for AMBAlt season is here, strong coin, strong PA and TA... bulls are in the city already. WIth patience this can bring more than 200%
NOT A FINANCIAL ADVICE
ALWAYS USE STOPLOSS AND MANAGE YOUR RISK

AMB/USDT Long SetupAMB/USDT Long Setup
Reason:
Breakout from Ascending Triangle with strong volume.
Successfully tested the support and resting on it.
LTF is bullish, expecting sudden strong bullish wave.
All technical indicators suggesting bullish momentum in short term.
Recommendation is to buy in spot, for futures take it at Dca point to be on safe side.
Best Regards,
The Crypto Panda
BINANCE:AMBUSDT
KUCOIN:AMBUSDT
MEXC:AMBUSDT.P
BYBIT:AMBUSDT.P

#AMB/USDT#AMB
The price is moving in a downward channel on the 4-hour frame upwards and is expected to continue
We have a trend to stabilize above the moving average 100 again
We have a downward trend on the RSI indicator that supports the rise by breaking it upwards
We have a support area at the lower limit of the channel at a price of 0.00545
Entry price 0.00600
First target 0.00666
Second target 0.00716
Third target 0.00772

#AMB/USDT#AMB
The price is moving within a bearish channel pattern on the 4-hour frame, which is a strong retracement pattern
We have a bounce from a major support area in green at 0.00620
We have a tendency to stabilize above the Moving Average 100
We have an upward trend on the RSI indicator that supports the rise and gives greater momentum, upon which the price depends
Entry price is 0.00650
The first target is 0.00734
The second goal is 0.00790
The third goal is 0.00854

AMBUSDTAMB ~ 1W ✅
#AMB So far this Key Support continues to maintain price.
✅ If you are interested in this coin, this support Block would be an excellent purchase. at least for 20%++ profit

AMB/Usdt Plan AMB/USDT Plan
The price is currently trading in a triangle pattern, and I expect a breakout soon. The market structure is bullish, so keep a close eye on it. Remember, this is not financial advice—always do your own research.

AMB is bullish (12H)It looks like a flat pattern with a terminal C, it's finished.
Wave C has been a 5-wave that just seems to have ended.
The targets are listed on the chart.
By maintaining the green range, it can move towards the targets.
Closing a daily candle below the invalidation level will violate the analysis.
For risk management, please don't forget stop loss and capital management
When we reach the first target, save some profit and then change the stop to entry
Comment if you have any questions
Thank You

AMBUSDT: Low Market Cap GemAMBUSDT Technical analysis update
One of the lowest market cap coins listed on Binance currently has a market cap of $25M. It could potentially reach $250M during this bull run.
The price is currently forming a triangle pattern. Once the price breaks out, we can expect a strong bullish move in AMB, with a target of 500% to 1000%.

AMBUSDT 1000% Potential!AMBUSDT technical analysis update
AMB has been trading within a range for the last 525 days, and it is now bouncing from its major support level with high volume. We can expect a strong bullish move from the current level.
AMB is one of the lowest market cap coins listed on Binance, with a current market cap of $25 million. It could potentially reach $250 million by the end of 2025.
Regards
hexa

AMB (AirDAO) - Expect huge bounce back from the supportCRYPTO:AMBUSD (1W CHART) Technical Analysis Update
AMB is currently trading at $0.00810881 and showing overall bullish sentiment
Price has hit support multiple times and always bounce backend from the support zone, this support zone has never broken in the last couple of years. Fundamentally AMB is strong token with huge potential for growth.
Entry level: $ 0.00818628
Stop Loss Level: $ 0.00424781
TakeProfit 1: $ 0.01232100
TakeProfit 2: $ 0.01819480
TakeProfit 3: $ 0.03440407
TakeProfit 4: $ 0.09336532
TakeProfit 5: $ 0.17993132
TakeProfit 6: $ 0.36364228
TakeProfit 7: $ 0.88043750
Max Leverage: Spot or 2x
Position Size: 1% of capital
Remember to set your stop loss.
Follow our TradingView account for more technical analysis updates. | Like, share, and comment your thoughts.
Cheers
GreenCrypto

AMBUSDT.1DThis analysis of the AMB/USDT chart indicates several critical observations and possible future directions:
Technical Analysis
Resistance and Support Levels (R1, R2, S1, T):
The chart clearly shows that after hitting the resistance level at R2, the price experienced a significant drop, which it has not recovered from. Currently, it is testing the support level S1.
The downtrend line (marked in red) serves as a dynamic resistance level, and the recent bounce off this line suggests that the bearish momentum is still in control.
MACD Indicator:
The Moving Average Convergence Divergence (MACD) is below the signal line and has been descending, which indicates a bearish market scenario. The histogram also supports this, as it is in the negative territory, reinforcing the strength of the downtrend.
RSI:
The Relative Strength Index (RSI) is close to the oversold region but not yet below 30, which might indicate that there's still room for downward movement before any potential reversal might occur.
Price Target (T):
The highlighted target (T) near the S1 line suggests an expectation of further price declines. If the price breaks below S1, it could accelerate the bearish trend, potentially leading to new lows.
Conclusion
In the current market condition, the trend is decisively bearish. Key indicators like MACD and RSI support this view. For potential investors or traders, it would be prudent to wait for a trend reversal signal before entering long positions. If the price sustains below the S1 level, considering short positions or waiting out the volatility might be advisable until a clearer bullish signal emerges. Caution is recommended, as the market shows strong bearish indicators.

AMB analysisAMB's major structure is bearish. Now we can consider the wave that moved upwards as a substructure.
So we are looking for sell/short positions in supply ranges.
In the specified supply range, we can look for sell/short positions.
The target can be the range of demand.
Closing a daily candle above the invalidation level will violate the analysis
Note that the financial market is risky, so:
Do not enter a position without setting a stop and capital management and confirmation and trigger.
When we reach the first TP, save some profit and try to move the stop continuously in the direction of your profit.
If you have any comments please post them, comments will help us improve our performance
Thanks

AIRDAO on the comeback trail?This S coin has undergone a rebrand it seems , a main-net release?
I don't know, I rarely dive into the fundamentals of a project... whilst a narrative is nice
and sector rotation is a thing
the age of the ALT coin and any the state of the community / marketing are generally the most important.
Which is all told in the price action of the charts anyway! :)
Supply/demand ---> support/resistance ---> accumulation/distribution
anyway as this chart shows there may be life in this old dog of a S coin.
And it is currently in a low risk (USD) entry zone.
(Don't forget to keep a Moonbag in these S coins as you take profits ... as you never know if it will be blessed this cycle with extreme out performance)

AMBUSDT(AirDAO) Daily tf Range Updated till 02-08-24AMBUSDT(AirDAO) Daily timeframe range. its on Monitoring state at binance so gotta trade it carefully. now it retraced quite a space from its new low. trying to stay over 0.00926 but still need a valid close for that. local support point at 0.00714.
