For The AMC APEsJust charting supports and resistances that i see. I think if we dip below here we goto 36 briefly then 32ish before hopefully getting a healthy bounce. The entire market is red today, obviously we would get hit too. Crypto is down, stocks are down, and silver is way down. So just take the dips as opportunities when they present themselves to DCA . Upside targets are still there, i see many up trend supports and a flag, and channel all with healthy price movement. Good luck out there.
Amclong

So many similarities compared to the previous runup patternThe WHITE line pattern indicates AMC currently. The GREEN line pattern( Which I purposely offset to see easier) was the exact chart pattern with a 5 minute time frame from May 13th to May 24ths breakout. I think we will see a little deep for the next two weeks and then come beginning of October... the just may be upon us.....
Friday-17th We should See some sideways controlled movement, possibly end of day push to send it down to get in to the Option price zone they want. Expect Monday the 20th to dip to the 22nd, possibly 23, then finish sideways for the week. Then Monday to Wednesday end of September she moves sideways, until, THURSDAY..... October FIRST, New month..... Then it comes alive....... unless they have plans to full on exit and send the stock down as much as possible, then we sit back and watch the MOASS play out.... Personally, I think this gets controlled until next year and possibly popping then full fledge. Could be a Tesla slow squeeze...... shoot, maybe hedgies default and not pay like China...... Heck does anybody really know anymore?


AMC DAILY TIMEFRAMESNIPER STRATEGY
This magical strategy works like a clock on almost any charts
Although I have to say it can’t predict pullbacks, so I do not suggest this strategy for leverage trading.
It will not give you the whole wave like any other strategy out there but it will give you huge part of the wave.
The best timeframe for this strategy is Daily, Weekly and Monthly however it can work any timeframe above three minutes.
Start believing in this strategy because it will reward believers with huge profit.
There is a lot more about this strategy.
It can predict and also it can give you almost exact buy or sell time on the spot.
I am developing it even more so stay tuned and start to follow me for more signals and forecasts.

AMC ELLIOT WAVE PREDICTIONI see AMC going all the way up to at least the 60 area for the third wave, in the next week or so.

$AMC Calls 145 Sept 17th Returns +79,067%AMC Entertainment Holdings, Inc., through its subsidiaries, involved in the theatrical exhibition business. The company owns, operates, or has interests in theatres. As of March 12, 2021, it operated approximately 1000 theatres and 10,700 screens in the United States and internationally. The company was founded in 1920 and is headquartered in Leawood, Kansas.

End Game. Its not over yet, They dragging this fight out.Play the long game, Current idea where we are at in the cycle. Were so close folks!. Dates are rough time frames, Just going based off of previous pattern that the chart is following relatively close.

AMC CUP & HANDLEWe have a cup & handle forming on the week! Calls are in the money... short interest is up... box office sales out of the roof this weekend... the squeeze isn't over just yet...

Possible breakout incomingNow, now hear me out i'm not one of the greatest fan of meme world but heck this is lining up a very long line to a very profitable next couple of weeks.
Now, bear in mind this is a phase and frenzy so could totally be shot down if the market makers decide to.
Chart speaks for it's self.

AMC $50 Breakout Soon? 1 hr Chart
As you can see, we have previously seen a 5 wave move then breakout.
We may be repeating a similar 5 wave pattern.
Above $48 range there is much room for growth.
20 EMA Bullish Cross Above 50 EMA.
MACD showing weakening downside momentum. Looking to reverse soon.
DeMarker Indicator showing gaining strength and looking to breakout soon.
Please let me know what you think in the comments. All comments welcome. Thank you

Cup and Handle =DDon't know if this is a typical situation, but appears to be a cup and handle of sorts.

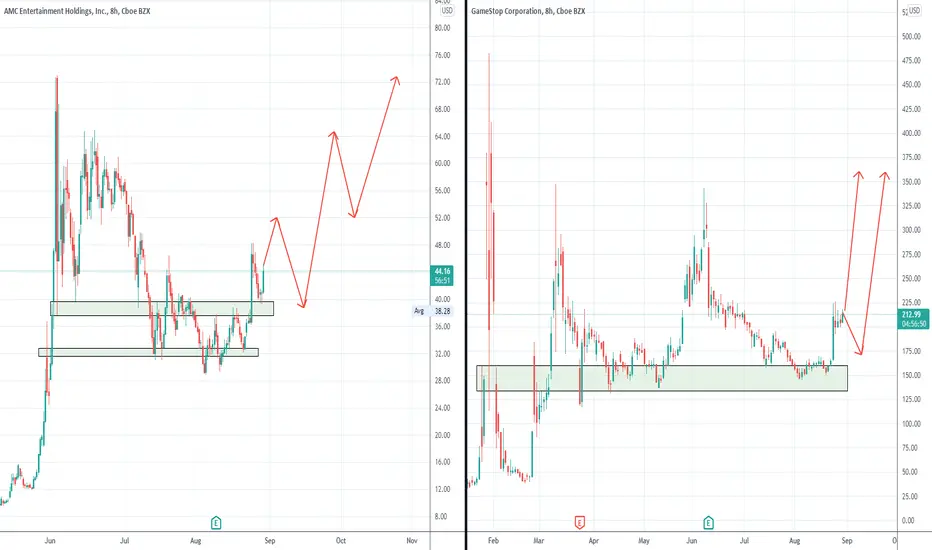
Let's get into some stock trades #4 & #5 - AMC & GMEDespite AMC & GME having either bad business models given the era we live in or bad financials or a mixture of both, the meme stock craze doesn't seem to be going away. AMC currently at about 17-18% short interest of free float and GME at about 12-13% short interest of free float. Neither heavily shorted, but there is some juice. Clearly neither as short as during the major squeezes, but the charts look pretty strong.
Currently we live in a world were memes, brands, communities and networks is all that matters, and these stocks have all of that behind them. Will these end well? Probably not, but in the short term we have something big here.
Several weeks ago I put out some updates on AMC and GME, and both did drop substantially since then and then found support. I stupidly ignored my 32$ buy level for AMC and on GME I was a little more scared that it would hold 150 after it lost 180. However the current view is quite different as they are both showing substantial strength. Short term might both pullback, but in my opinion it isn't a bad idea to own a little bit of both and consider that money lost as they could both go up 200-500% from here or even higher depending on how the stock market craze progresses.
In my opinion we haven't see the parabolic rise of stock markets yet, but we might be pretty close. Before that we might get a dip which would definitely be a great buying opportunity.
AMC HTF Outlook.1. Support area of 45.60 was broken.
2. Retest of broken support now turned resistance area.
3. Retest of resistance now turned support area.
Trade Idea
4. If support holds, and candle break above the 48.20 candle's high. We might see price tapping 55.

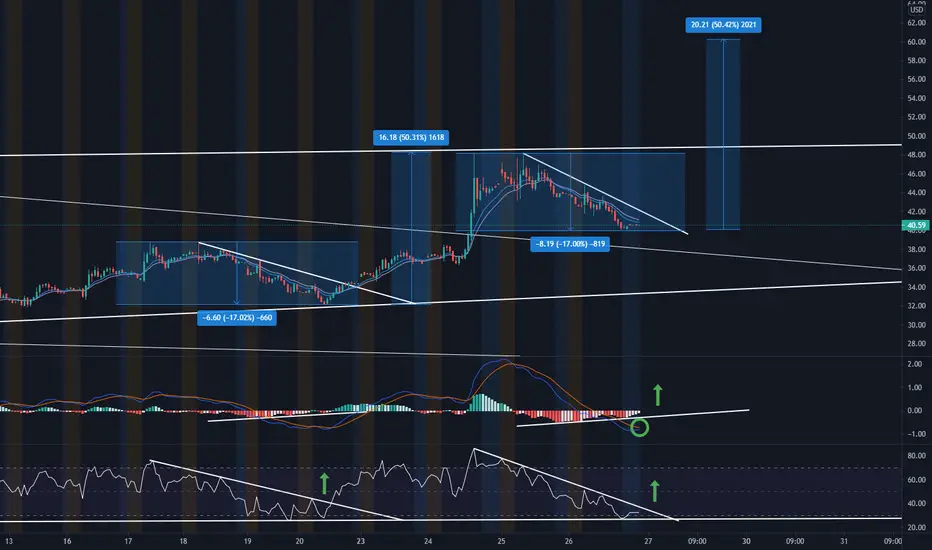
AMC Start of a New Run?30 Minute Chart
As you can see, previously we dipped down 17% from $39 to $32.
Then we went from $32 all the way to our current highs of $48 around a 50% gain.
We have now seen a drop of around 17% from $48 to $40.
MACD is also showing signs of crossover to upside.
RSI showing a similar trend which we have hit the 30 level on RSI.
In both RSI patterns we have seen a bounce back to the overbought region (+70 RSI).
if we continue this pattern we could see another similar run up around 50% which would make for a 20 pt move from $40 to $60.
Please let me know what you guys think ! All comments welcome.
Leave a like if you enjoyed this setup.
AMC - Potential Bull Flag FormationNOT FINANCIAL ADVICE
Bull Flag formation on AMC if it breaks through the resistance(s) (both flag resistance and normal resistance ), into a bullish/uptrend.
Support - $42
Resistance - $43ish
Breakthrough Bull Flag - $44.50
If falls through levels of support, sell signals should come from supertrends.
If breaks through levels of resistance, should see uptrend until buy signals from supertrends.

Could this be the first wave?Channel with Elliot wave progression happening? We look like we might be finding support here.

AMC Nice Trigger on the 200MA & .618take a look at the 200MA with the fib @ .618 right before todays pump.

AMC THE BIG SHORT PART 2Brand New demand zones have been created after hitting higher timeframe DZ.
Great buy opportunity up to around $50 where we expect THE BIG SHORT.
Short term LONGS. Long term SHORTS.
Summary: New long opportunities created for the next few weeks. Big Short at around the $50 mark.

THIS IS IT STARTS HERE!!! #AMCTHIS IS THE START OF THE GAMmmmMA SQUEEZZZZZZZ #amc Will Change Many PPL LIVES

AMC chance to break-even on cash flowAMC quarter revenue $444 million vs an estimate of $382 million,
adjusted loss per share $0.71 cents vs The Street expecting a loss per share of $0.93
Consolidated attendance was 22.1 million for Q2 compared to 100,000 year over year
But the real great news is that AMC has now the chance to break-even on cash flow!
They are burning less cash!
My target is the 40usd resistance.

AMC - Daily chart - Buy scenarioLooking to buy some AMC on the following levels.
All are based on weekly levels (Former strong Resistance and Supply areas). First one is a bit adjusted to that big gap (orange circle).
Same target (Close of big Swing High). Will close full position on target area.
Dont forget:
- Watch your Risk management
- DYOR (Do-Your-Own-Research)
- This information / article is only for educational purporses and not a recommendation to buy or sell. I'm not a Financial Advisor.
Thanks for reading!
trader_se


