AMD analysis What I’m seeing here is that the price made a false breakout below the 200 EMA, just like it did in the previous move back in early 2023. It dipped below, tricked a lot of people, then snapped back up strong.
Now it’s kind of repeating that same behavior another fake break below the 200 EMA and a bounce If history repeats we might see a similar upside move from here.
Just my personal view — not financial advice. Markets are unpredictable, so always be cautious.
AMD

Vanguard Mega Cap Growth ETF (MGK): FAQ guide before investing🚀 Vanguard Mega Cap Growth ETF (MGK): A Deep Dive into Holdings and Hypothetical Returns
🌟 The Vanguard Mega Cap Growth ETF (MGK) is a popular exchange-traded fund offering investors access to some of the largest and most dynamic growth-oriented companies in the U.S. market. MGK closely tracks the CRSP US Mega Cap Growth Index, emphasizing mega-cap stocks.
🎯 Key Features of MGK
💰 Expense Ratio: 0.07%, a cost-effective choice for investors.
📊 Assets Under Management: Around $25.42 billion.
💵 Dividend Yield: 0.44%, distributed quarterly.
🏆 Top Holdings:
🍎 Apple Inc. (AAPL): 14.34%
🖥️ Microsoft Corp. (MSFT): 11.93%
🎮 NVIDIA Corp. (NVDA): 10.70%
📦 Amazon.com Inc. (AMZN): 7.63%
📱 Meta Platforms Inc. (META): 4.33%
🔌 Broadcom Inc. (AVGO): 3.54%
🚗 Tesla Inc. (TSLA): 3.22%
💊 Eli Lilly and Co. (LLY): 3.20%
💳 Visa Inc. (V): 2.76%
🔍 Alphabet Inc. (GOOGL): 2.31%
📌 Sector Allocation:
💻 Technology: ~52.8%
🛒 Consumer Discretionary: 15.9%
📡 Communication Services: 11.0%
📈 Performance Overview
MGK has consistently demonstrated strong returns:
🗓️ Year-to-Date (YTD): 0.96%
📅 1-Year Return: ~21.09%
📆 3-Year Return: ~23.26%
📊 5-Year Return: ~19.26%
💸 Hypothetical Investment Scenarios
Assuming an average annual return of 19.26%, here's how various investments might grow over five years:
💲 $10,000 Investment:
Year 1: $11,926
Year 2: $14,219
Year 3: $16,951
Year 4: $20,207
Year 5: $24,070
💲 $100,000 Investment:
Year 1: $119,260
Year 2: $142,190
Year 3: $169,510
Year 4: $202,070
Year 5: $240,700
💲 $1,000,000 Investment:
Year 1: $1,192,600
Year 2: $1,421,900
Year 3: $1,695,100
Year 4: $2,020,700
Year 5: $2,407,000
⚠️ Note: These returns are hypothetical and assume consistent annual performance, which may not reflect actual market volatility.
🔑 Considerations for Investors
🎯 Concentration Risk: MGK heavily invests in technology and a few major stocks, tying its success closely to these specific companies.
📉 Market Volatility: Although historically strong, MGK can be highly volatile, particularly during tech-sector downturns.
📈 Long-Term Growth: Ideal for investors seeking significant long-term capital appreciation through prominent U.S. growth firms.
📌 In Summary: MGK provides focused exposure to U.S. mega-cap growth stocks with a strong track record. Investors should consider portfolio diversification carefully due to its sector concentration.

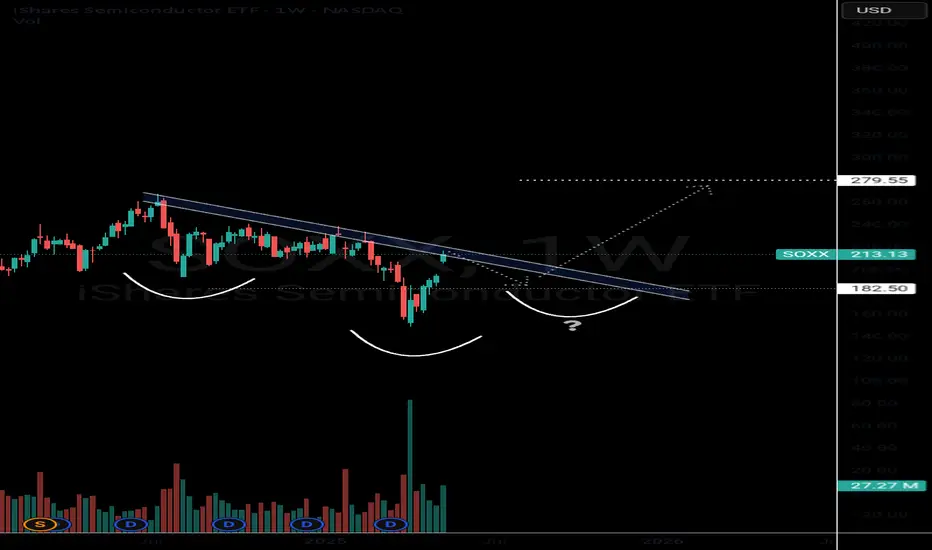
Bullish Semiconductors? SOXX The semiconductors NASDAQ:SOXX definitely tend to lead the market In bull rallies. I still think this saying will hold true for several years.
The NASDAQ:SOXX is flirting with some pretty decent resistance. This would be a perfect spot for sellers to exit and price action to digest recent gains.
If the chart plays out like I think it will, we should have a decent pullback in this area which could create an epic inverse head right shoulder. This pattern would be a very bullish setup that could take us into new All Time Highs in 2026.
This is a weekly pattern so allow the chart some tike to play out.
AMD Break-out above this level means new ATH at $300.Advanced Micro Devices (AMD) is on a recovery attempt following the April 07 2025 bottom, which is technically a Higher Low on the 3.5-year Channel Up. This week it broke above the first Resistance level of this attempt, the 1W MA200 (orange trend-line), which is key as it had 2 rejections since February 18 2025.
However the biggest Resistance test is right above it and consists of a strong Cluster of the 1D MA200 (green trend-line), the 1W MA50 (blue trend-line) and the Lower Highs trend-line from the All Time High (ATH).
The previous Bullish Leg of the Channel Up (started on October 10 2022), consolidated for 1 month once it broke above this Resistance Cluster (blue circle) and then marched towards the pattern's Higher High, which was naturally a Higher High.
The similarities between the Legs are striking, the Bearish Legs (both declined by -66.86%) were confirmed by 1W MACD Bearish Cross and the Bullish Legs by a Bullish Cross, which the 1W MACD just completed last week.
This is a major confirmation and technically the earliest for a long-term Buy. Assuming again that the symmetry will continue to hold on this emerging Bullish Leg, we can expect it rise by +318.17% as well. Based on that, our long-term Target on AMD is $300.
-------------------------------------------------------------------------------
** Please LIKE 👍, FOLLOW ✅, SHARE 🙌 and COMMENT ✍ if you enjoy this idea! Also share your ideas and charts in the comments section below! This is best way to keep it relevant, support us, keep the content here free and allow the idea to reach as many people as possible. **
-------------------------------------------------------------------------------
💸💸💸💸💸💸
👇 👇 👇 👇 👇 👇

$NVDA In, $AAPL Out – AI Supercycle May Be Just Starting🚨 JUST IN: NASDAQ:NVDA surpasses NASDAQ:AAPL to become the second-largest company in the world, right behind $MSFT.
And if that wasn’t enough:
Trump calls Nvidia’s Huang "my friend"
Hints that Nvidia replaces Apple as his go-to tech ally
Meanwhile, Bloomberg reports Nvidia could ship 500,000 AI chips yearly to the UAE until 2027 under revised export rules.
Jensen Huang also confirmed Saudi Arabia is building massive GPU factories, describing them as “energy in, intelligence out” systems.
⚠️ The market may be waking up to the reality that AI is not as cyclical as many feared.
🔍 On the chart:
NASDAQ:NVDA broke to a higher high (HH)
NASDAQ:AMD testing lower high (LH) breakdown resistance
Could AMD follow Nvidia’s breakout? The setup is there.

$AMD - Work In Progress! Analysis and Targets - 05/14/2025JUST IN:
NASDAQ:AMD announced a new $6 Billion share buyback program, bringing its total buyback plan up to 10B
NASDAQ:AMD technically completed a complex correction structure at $76.48. New upswing is underway to expected targets!
Cheers 😊👍

AMD Earnings About To PrintTechnical Analysis NASDAQ:AMD
RSI: 🟡 Near overbought but showing strength
MACD: 🟢 Bullish crossover in progress
Support: $96.84 → $93.64 → $90.00
Resistance: $100.75 → $101.72 → $103.96
Key Level to Watch: $100.75 (immediate resistance)
💰 Earnings Play
🎯 Trade Signal: BUY
✅ Justification
Recent uptrend confirmed by bullish MACD crossover with price action above key short-term MAs. Strong momentum heading into earnings with positive sentiment from analysts.
⚠️ Risk Management
Stop Loss: $93.64 (-5.2%)
Expected Range: $93.64 to $103.96
Best AI Generated Signals.
Stay Alpha

$AMD Tradespoon - Long Entry $98.99Description: Tradespoon model generated long signal for NASDAQ:AMD . Predicted range: $98.99–$102.65. Trend: -1.61%. NASDAQ:AMD

Intel Corporation | INTCIntel reported second quarter earnings on Thursday, showing a return to profitability after two straight quarters of losses and issuing a stronger-than-expected forecast. the stock rose 7% in extended trading.
Here’s how Intel did versus Refinitiv consensus expectations for the quarter ended July 1:
Earnings per share: 13 cents, adjusted, versus a loss of 3 cents expected by Refinitiv.
Revenue: $12.9 billion, versus $12.13 billion expected by Refinitiv.
For the third quarter, Intel expects earnings of 20 cents per share, adjusted, on revenue of $13.4 billion at the midpoint, versus analyst expectations of 16 cents per share on $13.23 billion in sales.
Intel posted net income of $1.5 billion, or 35 cents per share, versus a net loss of $454 million, or a loss of 11 cents per share, in the same quarter last year.
Revenue fell 15% to $12.9 billion from $15.3 billion a year ago, marking the sixth consecutive quarter of declining sales.
Intel CEO Pat Gelsinger said on a call with analysts the company still sees “persistent weakness” in all segments of its business through year-end, and that server chip sales won’t recover until the fourth quarter. He also said that cloud companies were focusing more on securing graphics processors for artificial intelligence instead of Intel’s central processors.
David Zinsner, Intel’s finance chief, said in a statement that part of the reason the report was stronger than expected was because of the progress the company has made toward slashing $3 billion in costs this year. Earlier this year, Intel slashed its dividend and announced plans to save $10 billion per year by 2025, including through layoffs.
“We have now exited nine lines of business since Gelsinger rejoined the company, with a combined annual savings of more than $1.7 billion,” said Zinsner.
Revenue in Intel’s Client Computing group, which includes the company’s laptop and desktop processor shipments, fell 12% to $6.8 billion. The overall PC market has been slumping for over a year. Intel’s server chip division, which is reported as Data Center and AI, saw sales decline 15% to $4 billion plus Intel’s Network and Edge division, which sells networking products for telecommunications, recorded a 38% decline in revenue to $1.4 billion.moreover Mobileye, a publicly traded Intel subsidiary focusing on self-driving cars, saw sales slip 1% on an annual basis to $454 million and Intel Foundry Services, the business that makes chips for other companies, reported $232 million in revenue.
Intel’s gross margin was nearly 40% on an adjusted basis, topping the company’s previous forecast of 37.5%. Investors want to see gross margins expand even as the company invests heavily in manufacturing capability.
In the first quarter, the company posted its largest loss ever as the PC and server markets slumped and demand declined for its central processors. Intel’s results on Thursday beat the forecast that management gave for the second quarter at the time.
Intel management has said the turnaround will take time and that the company is aiming to match TSMC’s chip-manufacturing prowess by 2026, which would enable it to bid to make the most advanced mobile processors for other companies, a strategy the company calls “five nodes in four years.” Intel said on Thursday that it remained on track to hit those goals.
Nvidia has had an amazing run, but any emerging technology, such as AI, which is bottlenecked by a single company will have issues in growth. Consulting firm McKinsey has pegged the AI market to be worth $1 trillion by 2030, but also that it was in an experimental and in early phases of commercial deployment.
While Nvidia will likely retain its leadership in GPU hardware as applied to AI for the foreseeable future, it is likely that other hardware solutions for AI systems will also be successful as AI matures. While technologist may quibble on specifics, all major AI hardware today are based on GPU architectures, and as such I will use the terms and concepts of AI hardware and GPU architecture somewhat interchangeably.
One likely candidate for AI related growth may be AMD (AMD), which has had GPU products since acquiring ATI in 2006.However, unlike Nvidia, which had a clear vision for of general-purpose GPU products (GPGPU), historically, AMD had largely kept its focus on the traditional gaming applications. AMD has developed an AI architecture called XDNA, and an AI accelerator called Alveo and announced its MI300, an integrated chip with GPU acceleration for high-performance computing and machine learning. How AMD can and may evolve in the AI may be subject of a different article.
Another contender for success in the AI applications using GPU is Intel, who is the focus of this article. Intel has maintained a consistent, if low key focus on GPU hardware focused on AI applications over the last decade. Intel’s integrated HD Graphics is built into most modern processor ICs; however, these are insufficient compared to dedicated GPUs for high-end inferencing or machine learning tasks.
It has 2 primary GPU architectures in production release:
In 2019 Intel Corporation acquired Habana Labs, an Israel-based developer of programmable deep learning accelerators for the data center for approximately $2 billion. Habana Labs’ Gaudi AI product line from its inception focused on AI deep learning processor technologies, rather than as GPU that has been extended to AI applications. As a result, Gaudi microarchitecture was designed from the start for the acceleration of training and inferencing. In 2022 Intel announced Gaudi2 and Greco processors for AI deep learning applications, implemented in 7-nanometer (TSMC) technology and manufactured on Habana’s high-efficiency architecture. Habana Labs benchmarked Gaudi2’s training throughput performance for the ResNet-50 computer vision model and the BERT natural language processing model delivering twice the training throughput over the Nvidia high end A100-80GB GPU. So, Gaudi appears to give Intel a competitive chip for AI applications.
Concurrent with the Habana Labs’ Gaudi development, Intel has internally developed the Xe GPU family, as dedicated graphics card to address high-end inferencing or machine learning tasks as well as more traditional high-end gaming. Iris® Xe GPU family consists of a series of microarchitectures, ranging from integrated/low power (Xe-LP) to enthusiast/high performance gaming (Xe-HPG), data center/AI (Xe-HP) and high-performance computing (Xe-HPC). The architecture has been commercialized in Intel® Data Center GPU Flex Series (formerly codenamed Arctic Sound) and Intel® Arc GPU cards. There is some question on Xe GPU future and evolution. Intel has shown less commitment to the traditional GPU space compared to Gaudi. Nonetheless, it does demonstrate Intel ability to design and field complex GPU products as its business requires.
Intel has many other AI projects underway. The Sapphire Rapids chips implements AI specific acceleration blocks including technology called AMX (Advanced Matrix Extensions), which provides acceleration inside the CPU for efficient matrix multiplications used in on-chip inferencing and machine learning processing by speeding up data movement and compression. Intel has supporting technologies such as Optane, which while cancelled as a production line, is available for their needs of a high-performance non-volatile memory, one of the intrinsic components in any AI product.
Based on the above, Intel appears to have competitive hardware solutions, however if we look at Nvidia success in AI, it is a result of a much a software and systems focus as it is the GPGPU hardware itself. Can Intel compete on that front. Ignoring for the moment that Intel has a huge software engineer (approx. 15,000) resource, it also has- access to one of the leading success stories in perhaps the most competitive AI application – self driving cars.
Mobileye, who was acquired by Intel in 2017, has been an early adopter and leader, with over 20 years of experience in automotive automated driving and vision systems. As such, Mobileye has a deep resource of AI domain information that should be relevant to many applications. Mobileye has announced that it is working closely with Habana, as related divisions within Intel. While Intel is in the process of re-spinning out Mobileye as public company, Mobileye Global Inc. (MBLY), at present Intel still owns over 95% of shares, keeping it effectively an Intel division.
In looking at Intel, we have a company with the history, resources, and technology to compete with Nvidia and infrastructure. They have made significant investment and commitment to the emerging AI market, in times when they have exited other profitable businesses. It should also be understood that AI related product are a small percentage of overall Intel revenues (INTC revenue are more than twice NVDA, even if NVDA has 6x its market cap), and continues to keep its primary business focus on its processor and foundry business.
Hopefully for shareholders, Intel continues to push their AI technology and business efforts. Their current position is that this is strategic, but Intel is in a very fluid time and priorities may change based on business, finances, and of course the general interest and enthusiasm for AI. It is always worth noting that AI as a technical concept is mature, and appears to be cyclical, with interest in the technical community rising and falling in hype and interest once every decade or so. I remember working on AI applications, at the time labeled as expert systems in the 1980s. If we are currently at a high hype point, this may be temporary, based on near term success and disappointment in what AI does achieve. Of course, as always, “this time is different” and the building blocks of effective AI systems currently exist, where for previous iterations, it was more speculative.

AMD BULLISH MAY6TH 2025AMD has its earnings today & I am bullish as per the price action. I have managed my risk, and I am long irrespective of any news. I have discussed in depth analysis of AMD. If you have any questions, feel free to leave a comment below.
NOTE: I AM LONG ONLY WITH STOCKS

AMD Weekly Options Trade Plan 2025-05-06AMD Weekly Analysis Summary (2025-05-06)
Summary of Each Model’s Key Points
Grok/xAI Report
Technicals (5-min & daily): Bullish momentum (price above EMAs, positive MACD, RSI not yet overbought) Sentiment: VIX moderate, upcoming earnings adds uncertainty, max pain at $98 Directional Bias: Moderately bullish Trade: Buy $100 call expiring 2025-05-09 at $3.80 Profit Target: +25%; Stop-Loss: −50% Confidence: 65%
Claude/Anthropic Report
Technicals: Intraday slightly bearish, daily bullish Sentiment: Earnings risk, mixed signals, max pain at $98 Directional Bias: Neutral/unclear Trade: No trade (90% confidence)
DeepSeek Report
Technicals: Short-term bullish but near resistance, daily MACD bullish Sentiment: Elevated IV, earnings event risk, max pain at $98 Directional Bias: Neutral/unclear (55% confidence) Trade: No trade
Llama/Meta Report
Technicals: Moderately bullish across timeframes (price above key EMAs, positive MACD) Sentiment: Earnings caution, max pain at $98 may cap downside, premium high Directional Bias: Moderately bullish Trade: Buy $109 call expiring 2025-05-09 at $1.00 Confidence: 70%
Gemini/Google Report
Technicals: Strong daily bullish, 5-min approaching resistance Sentiment: Muted post-earnings move, max pain at $98, high IV Directional Bias: Neutral/unclear Trade: No trade (confidence <60%) Areas of Agreement and Disagreement
Agreement
Mixed signals between intraday and daily timeframes Elevated implied volatility around earnings Max pain at $98 may exert gravitational pull High open interest in both deep OTM puts ($90) and calls ($105–$110) Majority of models favor waiting until after earnings or see no clear edge
Disagreement
Grok and Llama see a moderately bullish setup and recommend buying calls ($100 and $109 strikes) Claude, DeepSeek, and Gemini advise no trade because of earnings event risk, mixed technicals, and expensive premiums Conclusion
Overall Market Direction Consensus: Neutral/Unclear Recommended Trade: None – conflicting signals, earnings overhang, and rich weekly premiums make a high-confidence single-leg trade unlikely before post-earnings clarity.
Entry Timing: N/A (no trade) Confidence Level: 90% in the decision to sit out this week’s expiration Key Risks and Considerations:
Earnings announcement can cause large gap moves Weekly options premiums remain elevated, requiring outsized moves to break even Max pain at $98 may pressure price if post-earnings reaction is muted or negative
TRADE_DETAILS (JSON Format)
{ "instrument": null, "direction": null, "strike": null, "expiry": null, "confidence": null, "profit_target": null, "stop_loss": null, "size": null, "entry_price": null, "entry_timing": null, "signal_publish_time": "2025-05-06 15:09:34 UTC-04:00" }
Disclaimer: This newsletter is not trading or investment advice but for general informational purposes only. This newsletter represents my personal opinions based on proprietary research which I am sharing publicly as my personal blog. Futures, stocks, and options trading of any kind involves a lot of risk. No guarantee of any profit whatsoever is made. In fact, you may lose everything you have. So be very careful. I guarantee no profit whatsoever, You assume the entire cost and risk of any trading or investing activities you choose to undertake. You are solely responsible for making your own investment decisions. Owners/authors of this newsletter, its representatives, its principals, its moderators, and its members, are NOT registered as securities broker-dealers or investment advisors either with the U.S. Securities and Exchange Commission, CFTC, or with any other securities/regulatory authority. Consult with a registered investment advisor, broker-dealer, and/or financial advisor. By reading and using this newsletter or any of my publications, you are agreeing to these terms. Any screenshots used here are courtesy of TradingView. I am just an end user with no affiliations with them. Information and quotes shared in this blog can be 100% wrong. Markets are risky and can go to 0 at any time. Furthermore, you will not share or copy any content in this blog as it is the authors' IP. By reading this blog, you accept these terms of conditions and acknowledge I am sharing this blog as my personal trading journal, nothing more.

Leap for AMD to the upside?OptionsMastery:
🔉Sound on!🔉
📣Make sure to watch fullscreen!📣
Thank you as always for watching my videos. I hope that you learned something very educational! Please feel free to like, share, and comment on this post. Remember only risk what you are willing to lose. Trading is very risky but it can change your life!

Bearish forecast for DXYWith regards my previous forecast, we have a strong reaction from Weekly and daily premium arrays.
On the weekly TF, we have IOFED of the SIBI and BSL above previous 2 weeks' highs was taken.
Tf: time frame
IOFED: Institutional Order Flow Express Entry Drill
SIBI: Sellside Imbalance, Buyside Inefficiency.
BSL: Buy side liquidity

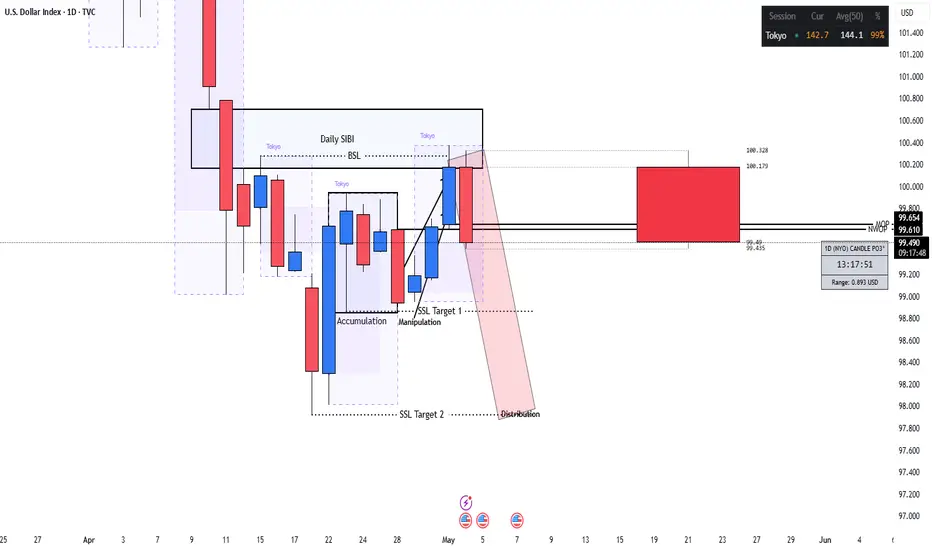
DXY Bearish Forecast for Quarter 2, 20251. Technical analysis
The idea is based in ICT's PO3; AMD pattern.
We have a rally above the open price of May 2025, to take out BSL above the highs.
It also aligns with Daily tf premium arrays to short from.
The lowest hanging fruit being the relative equal lows at equilibrium of the dealing range.
2. Fundamental analysis
Investor's confidence in the Dollar is low due to POTUS' tariffs.
ICT: Inner Circle Trader
PO3: Power of 3
AMD: Accumulation, Manipulation & Distribution
BSL: Buy side liquidity
tf: Timeframe

AMD to Retest SupportAMD has been in a descending price channel since November of 2024 with clear support and resistance established. On Monday we saw an attempt to breakout however it was rejected at the establish resistance line. Given the rejection and the significant drop that followed I think we will likely see AMD drop to slightly below $80 in the short term and retest the established support line.

$AMD - A Larger Correction Has Begun...NASDAQ:AMD - Breaking the trend channel's lower boundary is additional confirmation the five-wave advance has peaked and a larger correction is underway. Upcoming rallies will probably be B-wave phonies.
Looking for more pain this year before secular bull trend resumes.

MBIO MFI deepest red!!Potential lifetime buying opportunity on this if it is not just another WallStreet scam.
I'm stacking for potential upside targets in 1-3 years are $30, $90, $210 & higher.
Often I buy the deepest red and 50% of the time it works half of half the time.
1. MFI effin deep in the red
2. RSI potential double bottom on both 3 week and higher charts
3. 99.99% of all investors are under and burnt by WallStreet
4. TTM squeeze is showing large potential on timeframes 55D, 21D, 9D, 3D, 10 Hour is a FIRE setup.
5. Accum/Distrib pump is at a healthy retracement on multiple larger time frames.
This can lay flat for months and or go to ZERO.
NOT FINANCIAL ADVICE!!!

April 17, 2025 - Powell, Japan & TrumpHello everyone, it’s April 17, 2025. Yesterday’s U.S. trading was pure market carnage. Semiconductors ( NASDAQ:NVDA , NASDAQ:AMD , NASDAQ:ASML ) were steamrolled as AI chip bans to China kicked in and Trump dropped another tariff bomb, hiking duties to 245%. That wiped $200 billion off Nvidia alone.
In Chicago, Powell stoked the flames, warning tariffs will fuel inflation and choke growth, and insisted he’s in no rush to cut rates. The CME_MINI:NQ1! tumbled 3%, the CME_MINI:SOX1! lost 4.1%, and bond futures plunged.
This morning, U.S. futures are up about 0.75% on headlines that Trump’s talks with Japanese negotiators are “going very well,” sparking rallies across Asia: Nikkei +1%, Hong Kong +2.7%, Shanghai +1%. It seems even a whiff of détente with Japan sends everyone scrambling back into risk assets.
On commodities, BLACKBULL:WTI jumps to $63.35 amid fresh U.S. sanctions on Iran and OPEC output cuts; OANDA:XAUUSD rockets to $3,352 /oz; INDEX:BTCUSD hovers near $83,500.
Today watch the ECB’s rate cut, Powell’s next speech, Philly Fed and jobless claims before the Good Friday shutdown. With Trump’s erratic tariff theatrics and Powell’s warning of higher inflation and slower growth, volatility is set to reign supreme. Buckle up.

Chipmaker Stocks DeclinesChipmaker Stocks Declines
According to the charts, semiconductor stocks underperformed the broader equity market yesterday. While the S&P 500 index (US SPX 500 mini on FXOpen) fell by around 2.2%, the drop was far steeper across the chip sector:
→ The bullish semiconductor ETF (SOXL) declined by 15%;
→ Nvidia (NVDA) shares fell by 6.9%;
→ Advanced Micro Devices (AMD) dropped by 7.3%.
In other words, chipmaker stocks dragged down the broader market, raising concerns ahead of the upcoming earnings season.
Why Are Chip Stocks Falling?
The decline stems from corporate assessments of how the escalating global trade war and new tariffs could impact future performance.
According to media reports:
→ AMD expects to face tariffs of up to $800 million on exports to China;
→ For Nvidia, similar levies could exceed $5 billion.
Technical Analysis – Nvidia (NVDA)
The price continues to fluctuate within a downward channel, previously identified in our analysis:
The lower boundary of the channel is acting as support, helping the price close near its opening level yesterday (forming a Doji candle on the daily chart).
Technical Analysis – AMD
A similar picture is emerging on the AMD chart:
The $96 level now appears to be a key resistance zone.
In Summary
All eyes are on today’s earnings report from chipmaker TSMC (TSM), which could significantly influence the currently bearish sentiment in the sector.
This article represents the opinion of the Companies operating under the FXOpen brand only. It is not to be construed as an offer, solicitation, or recommendation with respect to products and services provided by the Companies operating under the FXOpen brand, nor is it to be considered financial advice.

AMD Weekly Options Trade Plan 2025-04-16NASDAQ:AMD AMD Weekly Analysis Summary (2025-04-16)
Below is a synthesis of all the reports and our analysis:
─────────────────────────────
COMPREHENSIVE SUMMARY OF EACH MODEL’S KEY POINTS
─────────────────────────────
• Grok/xAI Report
– Technical indicators show AMD trading below its short‐term moving average and near the lower Bollinger Band.
– Negative MACD histogram and bearish news (export restrictions, potential $800M charge) support a downward bias.
– Recommends a bearish options trade using a near–ATM put – the $89 put at a premium around $1.78 (a higher premium but with a clear bearish thesis).
• Llama/Meta and DeepSeek Reports
– Confirm the bearish bias: price action below key moving averages, negative MACD and extreme moves below support.
– Note that the option chain (and high open interest on lower strikes) points to a greater probability for further decline.
– Both suggest a trade on put options that have a lower premium than the Grok suggestion (with DeepSeek favoring the $85 put at roughly $0.62) for improved risk/reward.
• Gemini/Google Report
– Emphasizes the strong negative catalyst from news and a rapid breakdown below support levels (with current price near $89).
– Technical indicators and volatility (VIX above 30) signal that the underlying is likely to fall further.
– Offers several put strike ideas and finds that the $84 put (premium ca. $0.49) fits the ideal price range; however, liquidity and open interest are better for the $85 strike.
─────────────────────────────
AREAS OF AGREEMENT AND DISAGREEMENT
─────────────────────────────
Agreements:
– All models (except for the one reporting an error) agree that the market sentiment is bearish.
– The negative news catalyst (export controls and potential charges) and the technical breakdown clearly drive the consensus.
– There is broad recognition that options data (with high OI on puts and max pain around $95)
is supportive of a downside move.
Disagreements:
– The primary difference is in the strike selection. Grok favors a put close to the current price (the $89 put) despite its higher premium, while Gemini, Llama/Meta, and DeepSeek lean toward lower strikes ($84–$85) that offer a lower premium (falling in or near our ideal range) and better liquidity for a weekly trade.
─────────────────────────────
CLEAR CONCLUSION & RECOMMENDED TRADE
─────────────────────────────
Overall Market Direction Consensus:
– The overall view is bearish. All models (apart from the one error) indicate that AMD is under significant downside pressure fueled by both technical breakdown and negative news sentiment.
Recommended Trade:
• Trade Type: BUY single‐leg, naked PUT (weekly option only)
• Chosen Strike: $85
– Rationale: The $85 put (ask at $0.64) offers good liquidity (high open interest of 10,218 contracts) and although its premium is slightly above the preferred $0.30–$0.60 range, its risk/reward profile is attractive given the bearish momentum.
• Expiration: April 17, 2025 (weekly options)
• Entry Timing: At market open
• Proposed Parameters:
– Entry Premium: Approximately $0.64
– Profit Target: Around $1.00 (this represents an attractive move if the bearish trend continues)
– Stop Loss: Approximately $0.45 to limit risk if price recovers unexpectedly
• Confidence Level: ~70%
• Key Risks and Considerations:
– Short‐term volatility may create intraday bounces despite the overall bearish trend.
– An oversold reaction or a temporary return toward the max pain level ($95) could adversely affect the trade.
– As this is a news–driven and highly volatile environment, trade size must be limited relative to account size.
─────────────────────────────
TRADE_DETAILS
─────────────────────────────
The final trade parameters in JSON format are shown below.
TRADE_DETAILS (JSON Format)
{
"instrument": "AMD",
"direction": "
put",
"strike": 85.0,
"expiry": "2025-04-17",
"confidence": 0.70,
"profit_target": 1.00,
"stop_loss": 0.45,
"size": 1,
"entry_price": 0.64,
"entry_timing": "open"
}

AMD: Best level to buy since Oct 2022.Advanced Micro Devices are virtually oversold on the 1W technical outlook (RSI = 30.639, MACD = -13.430, ADX = 36.312) having hit the bottom (HL) of the 3 year Channel Up. The 1W RSI is slightly even lower it was on the previous bottom of October 10th 2022. This should be the start of the new long term bullish wave, which based on the previous one should make a HH on the 1.236 Fibonacci extension, approximately a +300% rally (TP = 280.00).
See how our prior idea has worked out:
## If you like our free content follow our profile to get more daily ideas. ##
## Comments and likes are greatly appreciated. ##

Amd - The One And Only Setup For 2025!Amd ( NASDAQ:AMD ) shifts to a very bullish market:
Click chart above to see the detailed analysis👆🏻
Perfectly following previous cycles, Amd corrected about -60% over the past couple of months. However now we are seeing some first bullish signs at a major confluence of support. If we actually also witness bullish confirmation, an incredible rally of about +200% could follow.
Levels to watch: $100, $300
Keep your long term vision,
Philip (BasicTrading)
