AMD Shares Decline Despite Strong Earnings ReportAMD Shares Decline Despite Strong Earnings Report
Yesterday, following the close of the stock market, Advanced Micro Devices released a strong quarterly earnings report:
→ Earnings per share came in at $0.48 (roughly in line with forecasts);
→ Revenue reached $7.68 billion (versus expectations of $7.41 billion).
At the same time, CEO Lisa Su stated: “We’re well positioned to deliver significant growth in the second half.”
However, despite the solid performance and optimistic outlook, AMD shares declined in after-hours trading, falling below $165.
The decline in AMD’s share price following a strong report may be attributed to excessively high expectations and the stock's overbought condition ahead of the announcement.
Technical Analysis of the AMD Stock Chart
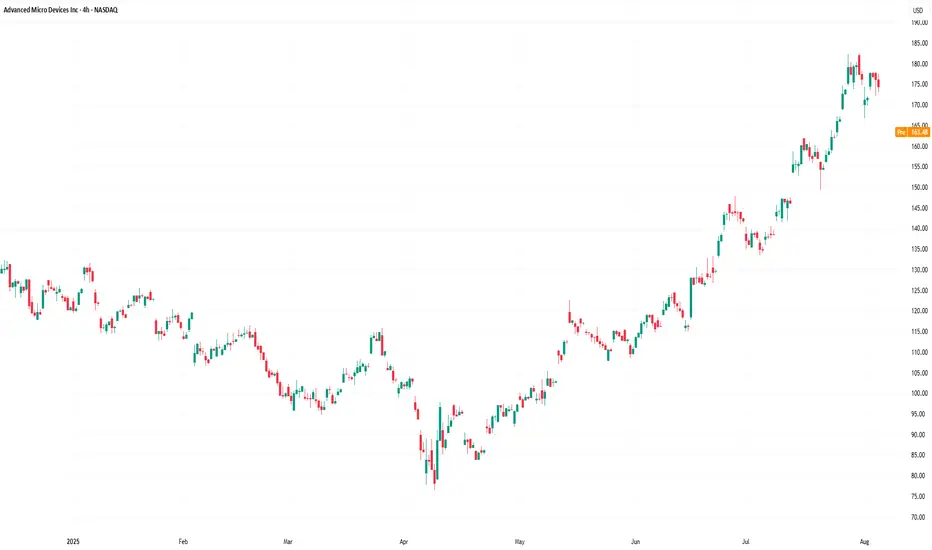
Since April 2025, price fluctuations have formed an ascending channel (highlighted in blue). In July:
→ the price broke above the upper boundary of this channel, moving sharply higher (marked in purple);
→ the RSI indicator remained above the 50 level throughout.
We can assume that investors were following the meteoric rise of Nvidia (NVDA) shares and were betting that the ongoing AI boom would enable AMD to deliver extraordinary results. However, these hopes were not fully realised — the classic case of "buy the rumour, sell the fact".
As a result, AMD shares may open today with a bearish gap. From a technical standpoint, this suggests that the price is returning to the limits of the blue ascending channel, where the midline and lower boundary may act as support levels. The psychological support level at $150 also appears significant.
This move may be interpreted as a correction — and once the excessive optimism accumulated in July dissipates, bulls may attempt to resume the upward trend, supported by fundamentally strong data.
This article represents the opinion of the Companies operating under the FXOpen brand only. It is not to be construed as an offer, solicitation, or recommendation with respect to products and services provided by the Companies operating under the FXOpen brand, nor is it to be considered financial advice.
Amdanalysis
AMD Don't Miss Out
### 🚀 \ NASDAQ:AMD Bullish Reversal Play — Weekly Options Setup
**🔥 Institutional Flow + RSI Momentum + Volume Surge = Opportunity**
---
📊 **Model Consensus Summary (Grok, Claude, Gemini, Llama, DeepSeek):**
* **🟢 Weekly RSI:** Climbing ⬆️ — confirms trend
* **🔴 Daily RSI:** Slight dip = caution, but **volume overrides**
* **💰 Call/Put Ratio:** 2.00 → **Big Money** loading calls
* **📈 Volume Spike:** 1.7x last week → institutional confirmation
* **🧠 AI Sector Tailwind:** Adds strong narrative fuel
---
### 🎯 Trade Setup – 5D Weekly CALL
| 🧾 Entry | 🎯 Target | 🛑 Stop Loss | 🎲 Risk/Reward | 📅 Expiry |
| -------- | --------------------------- | ------------ | --------------- | ---------- |
| \$4.40 | \$6.75 (TP1) / \$9.00 (TP2) | \$2.60 | 1:1.78 / 1:3.46 | 2025-08-08 |
**📌 Strike:** \$180.00
**🎯 Strategy:** Naked CALL (single-leg)
**⏰ Entry:** Market open
**✅ Confidence:** 75%
**⚠️ Risk Flag:** Short-term volatility from daily RSI dip
**🔍 SL based on 40% drawdown tolerance**
---
### 📣 TL;DR
> **“Smart money is early. Momentum is building. AMD could break out hard.”**
> 🔸 Weekly RSI + Volume + Calls = Setup
> 🔸 Short-dated play for aggressive profits
> 🔸 Tight stop, wide upside
---
### 💡 Tag It:
\#AMD #OptionsTrading #WeeklySetup #TradingSignals #AIStocks #InstitutionalFlow #RSI #CallOptions #MomentumPlay #TradingView #SwingTrade

AMD WEEKLY TRADE SIGNAL (7/31/25)
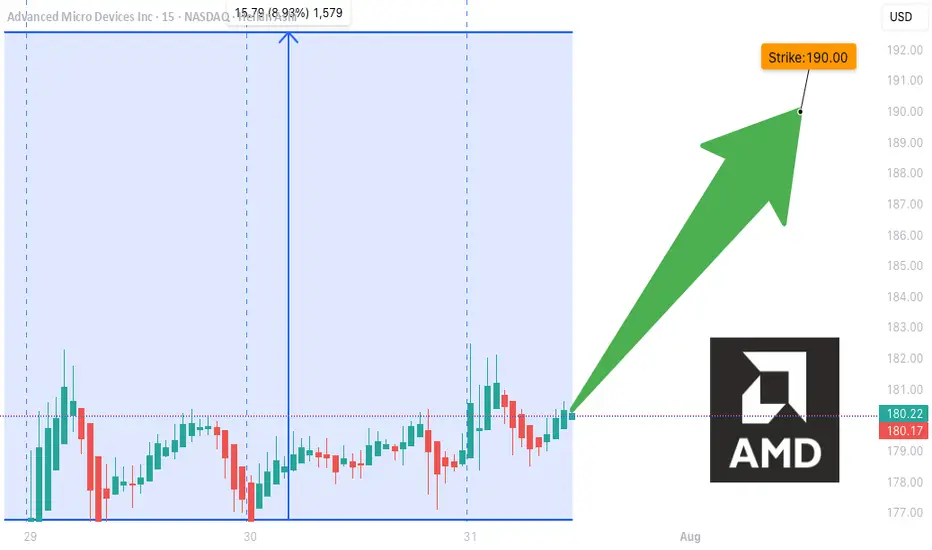
### 🚀 AMD WEEKLY TRADE SIGNAL (7/31/25)
📈 **MARKET SNAPSHOT**
🟢 Daily RSI: **86.0** 🔥
🟢 Weekly RSI: **80.4**
📊 Volume: 🔺 1.5x (Institutional surge)
💬 Call/Put Ratio: **1.90**
🌪 Gamma Risk: **HIGH (1DTE)**
🧠 Sentiment: **Extremely Bullish** across all models
---
💥 **TRADE IDEA**
📍 Ticker: **\ NASDAQ:AMD **
📈 Direction: **CALL (LONG)**
🎯 Strike: **\$190.00**
💵 Entry: **\$0.51**
🎯 Target: **\$0.90** (+75%)
🛑 Stop Loss: **\$0.30**
📆 Expiry: **Aug 1 (Friday)**
📊 Confidence: **85%**
⏰ Entry: Market Open (Time-sensitive!)
---
🧠 **STRATEGY CONTEXT**
✅ Bullish momentum from AI sector hype
✅ Institutional call buying volume spiking
⚠️ 1DTE = High Gamma Risk = TRADE FAST OR DON’T TRADE
⚠️ Manage decay & exit early if momentum stalls
---
📌 Signal Posted: 2025-07-31 @ 12:17 PM ET
\#AMD #OptionsAlert #AITrade #WeeklyOptions #TradingViewViral #1DTE #GammaSqueeze
AMD Weekly Trade Alert (2025-07-29)
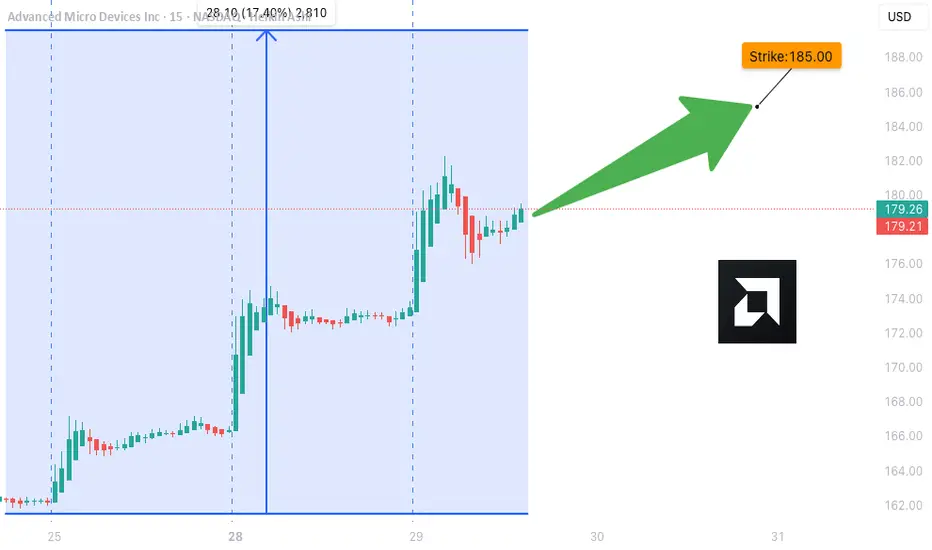
**🔥 AMD Weekly Trade Alert (2025-07-29) 🔥**
💹 *Momentum Confirmed. Calls Loaded. Let’s Ride.*
📈 **Key Bullish Signals**
✔️ Daily RSI: **83.2** (Rising)
✔️ Weekly RSI: **79.9** (Rising)
✔️ Call/Put Ratio: **2.03** 🧨
✔️ Volatility: Low (VIX = 15.2)
⚠️ Volume Weak (0.9x) – But not a dealbreaker.
---
**🎯 TRADE SETUP**
🔹 **Ticker**: \ NASDAQ:AMD
🔹 **Strategy**: Weekly Naked Call
🔹 **Strike**: \$185C
🔹 **Entry**: \$0.66
🔹 **Profit Target**: \$1.32 (100%)
🔹 **Stop Loss**: \$0.33
🔹 **Expiry**: 2025-08-01
🔹 **Size**: 3 Contracts
🔹 **Confidence**: 75%
---
**🧠 WHY THIS WORKS**
🔋 Momentum → STRONG
💰 Institutions are loading up calls
🧘 VIX = calm
⚡ Short gamma risk = fast payoff or cut
---
📢 **Watchlist it. Trade it. Exit fast.**
💬 Comment “🔥AMD” if you’re in.
🔁 Repost if you see \$190 coming.
\#AMD #OptionsTrading #CallOptions #TradingView #WeeklySetup #MomentumPlay #BullishSignal #MarketMomentum
AMD in cross section of 2 important levelsAMD is at the crosssection of 2 important
trend lines
1. from Jun22 lows to sep23 lows and Aug 24 lows,
breaking down in Dec24.
2. The channel from Mar24.
I hope the price comes down to 133 levels.

AMD Clears Resistance, Eyes $147.8 on Bullish ReboundAMD broke above $139.8, making the primary trend bullish. A pullback to this level can provide a discount to join the bull market, with a target at $147.8.

Breakout Alert: AMD Head & Shoulders Points to $160+Overview
Name: Advanced Micro Devices, Inc.
Ticker Symbol: AMD
Exchange: NASDAQ
Founded: 1969
Headquarters: Santa Clara, California, USA
CEO: Lisa Su (as of 2025)Sector: Technology / Semiconductors
About
AMD is a leading semiconductor company known for its high-performance computing and graphics solutions. It competes with Intel and NVIDIA in the CPU, GPU, and data center markets. Its product line includes Ryzen (desktop/laptop CPUs), EPYC (server CPUs), and Radeon (GPUs), with strong expansion in AI and custom silicon for next-gen applications.
Fundamentals
Earnings: AMD reported strong Q1 2025 earnings with a beat on both revenue and EPS, supported by explosive demand in the AI and data center segments.Revenue: $6.52B, up 21% YoY
Outlook: The company raised guidance for the second half of 2025 as it expects to benefit from the AI chip boom and new product rollouts.
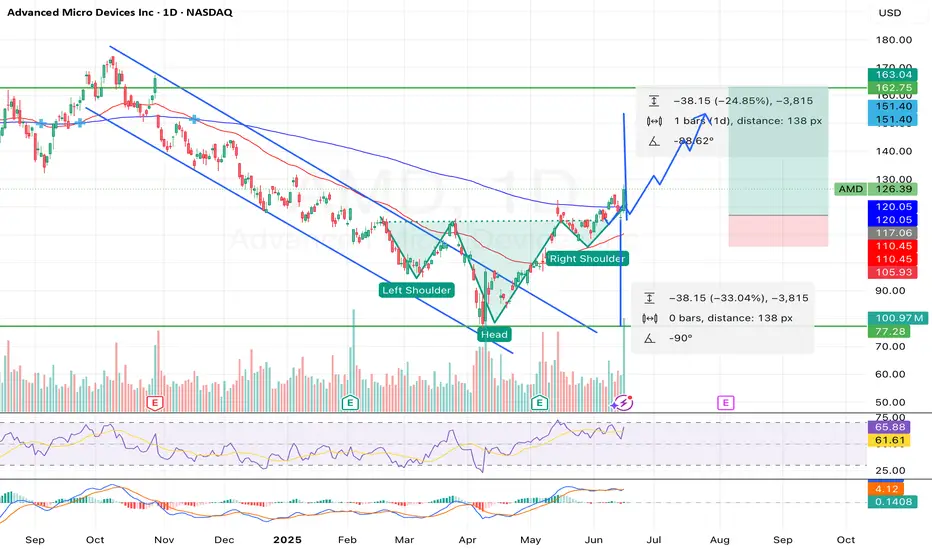
Technicals (4H Chart)
Inverted Head and Shoulders pattern confirmed with neckline breakout around ~$117
Breakout from Falling Channel aligning with bullish reversal structure
Price surged past resistance with strong volume, currently at $126.39 (+9.71%)
RSI at 65.88, approaching overbought but not signaling weakness
MACD bullish crossover, confirming momentum
Short-term target range: $145–$150, with extended projection up to $162.75
📌 Support Levels: $117, $111.50📈 Target Price (TP): $162.75 (based on pattern breakout height projection)
💡 My Take
AMD just pulled off a textbook bullish reversal — inverted head and shoulders breakout combined with a falling channel exit. With strong macro trends in AI hardware and data center expansion, this move feels well-supported fundamentally and technically.
The clean neckline breakout and explosive candle suggest continuation. I am expecting a potential consolidation around $130–$135ish before next leg to $150+. If momentum holds, $162+ is possible before August.
💼 Position
Type: AMD 145 Call
Expiry: July 03, 2025
Quantity: 15
Average Cost Basis: $.038
Date Purchased: June 12, 2025
Last Price: $0.47
Total % Gain/Loss: +23.4%
I entered after the neckline break and riding the wave. AMD’s setup is too clean to ignore — high conviction play.
Big move for AMD monday inverted H&S greatly confirmed 150USD!!!The pattern have been greatly confirmed for me and i will sell my amd this week at 150 USD and i will wait at july when a drop will occurs to rebuy and i will cumulate more stock or more profits in cash.
The information and publications are not meant to be, and do not constitute, financial, investment, trading, or other types of advice or recommendations.
Thank you!
Subcribe TSXGanG! (For real chart)

AMD: Short-term Upward PotentialAMD has continued to face downward pressure, preventing further progress in green wave . While this wave still has room to rise, its top should form below resistance at $141.16. Once wave completes, wave should follow—finishing the larger green impulse to the downside and completing the corrective structure of blue wave (II). This move is expected to conclude in our blue Long Target Zone between $62.82 and $35.19. That said, we continue to monitor a 30% alternative scenario: it suggests that wave alt.(II) has already bottomed at $76.12. In that case, AMD wouldn’t visit the blue zone but instead break out directly above the resistances at $141.16 and $174.98—marking the beginning of wave alt.(III).
📈 Over 190 precise analyses, clear entry points, and defined Target Zones - that's what we do.

Chipmaker Stocks DeclinesChipmaker Stocks Declines
According to the charts, semiconductor stocks underperformed the broader equity market yesterday. While the S&P 500 index (US SPX 500 mini on FXOpen) fell by around 2.2%, the drop was far steeper across the chip sector:
→ The bullish semiconductor ETF (SOXL) declined by 15%;
→ Nvidia (NVDA) shares fell by 6.9%;
→ Advanced Micro Devices (AMD) dropped by 7.3%.
In other words, chipmaker stocks dragged down the broader market, raising concerns ahead of the upcoming earnings season.
Why Are Chip Stocks Falling?
The decline stems from corporate assessments of how the escalating global trade war and new tariffs could impact future performance.
According to media reports:
→ AMD expects to face tariffs of up to $800 million on exports to China;
→ For Nvidia, similar levies could exceed $5 billion.
Technical Analysis – Nvidia (NVDA)
The price continues to fluctuate within a downward channel, previously identified in our analysis:
The lower boundary of the channel is acting as support, helping the price close near its opening level yesterday (forming a Doji candle on the daily chart).
Technical Analysis – AMD
A similar picture is emerging on the AMD chart:
The $96 level now appears to be a key resistance zone.
In Summary
All eyes are on today’s earnings report from chipmaker TSMC (TSM), which could significantly influence the currently bearish sentiment in the sector.
This article represents the opinion of the Companies operating under the FXOpen brand only. It is not to be construed as an offer, solicitation, or recommendation with respect to products and services provided by the Companies operating under the FXOpen brand, nor is it to be considered financial advice.

#NOT #NOTUSDT #NOTCOIN #AMD #Analysis #Spot #Futures #Long #Eddy#NOT #NOTUSDT #NOTCOIN #AMD #Analysis #Spot #Futures #Long #Eddy
NOTUSDT.P Lower Time Frame "AMD" Analysis
Great opportunity to invest spot at a specified price.
To get confirmation, you need to be patient until the AMD structure is complete on the lower timeframe, first wait for the manipulation and then get confirmation of entry for buy trades, and follow the price during the distribution phase.
Important areas of the lower & higher time frame are identified and labled.
This Analysis is based on a combination of different styles, including the volume style with the ict style. (( AMD Analysis ))
Based on your strategy and style, get the necessary confirmations for this analysis to buy entery the trade.
Don't forget risk and capital management.
The entry point, take profit point are indicated on the chart along with their amount.
The responsibility for the transaction is yours and I have no responsibility for not observing your risk and capital management.
Note: The price can go much higher than the first target, and there is a possibility of a 300% & 1000% pump on this currency. By observing risk and capital management, obtaining the necessary approvals, and saving profits in the target, you can keep it for the pump.
Be successful and profitable.
(( This is a lower time frame AMD structure inside another higher time frame AMD structure. ))
Please Check NOTUSDT Higher Time Frame "AMD" Analysis from this link :

#NOT #NOTUSDT #NOTCOIN #AMD #Analysis #Spot #Long #Eddy#NOT #NOTUSDT #NOTCOIN #AMD #Analysis #Spot #Long #Eddy
NOTUSDT Higher Time Frame "AMD" Analysis
Great opportunity to invest spot at a specified price.
Important areas of the higher time frame are identified and labled.
This Analysis is based on a combination of different styles, including the volume style with the ict style. (( AMD Analysis ))
Based on your strategy and style, get the necessary confirmations for this analysis to buy entery the trade.
Don't forget risk and capital management.
The entry point, take profit point are indicated on the chart along with their amount.
The responsibility for the transaction is yours and I have no responsibility for not observing your risk and capital management.
Note: The price can go much higher than the first target, and there is a possibility of a 300% & 1000% pump on this currency. By observing risk and capital management, obtaining the necessary approvals, and saving profits in the target, you can keep it for the pump.
Be successful and profitable.

$AMD Analysis: Profitable Structure! 2/13/2025
Another profitable structure is currently in progress, after completing the last leg of the correction at $106.50 (MY STOPLOSS!)
The targets of the uptrend swing (wave C) are displayed on the chart, and it has the potential to exceed the projected levels.
Start point of wave c= $106.50 (Stoploss)
Targets:
T1=$206
T2=$268
T3=$367
NASDAQ:AMD #AMD
Good Luck

AMD: Wave (3) of [3]As anticipated, AMD has realized strong sell-offs, breaking below the support at $121.82. We primarily expect the magenta wave (3) to conclude further south, followed by a corrective rise in the subsequent wave (4). Below $121.82, however, the stock should resume the magenta downward impulse and, thus, start wave (5).

AMD (Advanced Micro Devices, Inc.) BUY TF D1 TP = 184.94On the D1 chart the trend started on Aug.8 (linear regression channel).
There is a high probability of profit taking. Possible take profit level is 184.94
This level, which I have outlined above, is certainly not a “finish” level. But it is the level that has the “highest percentage of hits on target.”
Using a trailing stop is also a good idea!
Please leave your feedback, your opinion. I am very interested in it. Thank you!
Good luck!
Regards, WeBelievelnTrading

ANALYSIS ON AMDDear Traders and Investors,
I'm sharing with you this analysis on AMD to tell you to close your position if you're holding a long trade, as you can see in the chart, the price pulled back on the 0.5 level of the fib and gave us a confirmation, now it's heading towards the 0.6.
For further question, don't hesitate to ask!

AMD soon to hit a weekly and monthly resistance at 91-95 rangeThe price has broken up on the current monthly resistance level. However, it will meet another combination of weekly and monthly resistance at 91-95 range. The probability for the price to get rejected there and a pullback is higher.
If the above scenario plays out, the current broken monthly resistance will act as support and price shall then bounce from there.a
