AMD Don't Miss Out
### 🚀 \ NASDAQ:AMD Bullish Reversal Play — Weekly Options Setup
**🔥 Institutional Flow + RSI Momentum + Volume Surge = Opportunity**
---
📊 **Model Consensus Summary (Grok, Claude, Gemini, Llama, DeepSeek):**
* **🟢 Weekly RSI:** Climbing ⬆️ — confirms trend
* **🔴 Daily RSI:** Slight dip = caution, but **volume overrides**
* **💰 Call/Put Ratio:** 2.00 → **Big Money** loading calls
* **📈 Volume Spike:** 1.7x last week → institutional confirmation
* **🧠 AI Sector Tailwind:** Adds strong narrative fuel
---
### 🎯 Trade Setup – 5D Weekly CALL
| 🧾 Entry | 🎯 Target | 🛑 Stop Loss | 🎲 Risk/Reward | 📅 Expiry |
| -------- | --------------------------- | ------------ | --------------- | ---------- |
| \$4.40 | \$6.75 (TP1) / \$9.00 (TP2) | \$2.60 | 1:1.78 / 1:3.46 | 2025-08-08 |
**📌 Strike:** \$180.00
**🎯 Strategy:** Naked CALL (single-leg)
**⏰ Entry:** Market open
**✅ Confidence:** 75%
**⚠️ Risk Flag:** Short-term volatility from daily RSI dip
**🔍 SL based on 40% drawdown tolerance**
---
### 📣 TL;DR
> **“Smart money is early. Momentum is building. AMD could break out hard.”**
> 🔸 Weekly RSI + Volume + Calls = Setup
> 🔸 Short-dated play for aggressive profits
> 🔸 Tight stop, wide upside
---
### 💡 Tag It:
\#AMD #OptionsTrading #WeeklySetup #TradingSignals #AIStocks #InstitutionalFlow #RSI #CallOptions #MomentumPlay #TradingView #SwingTrade
Amdbullish

Big move for AMD monday inverted H&S greatly confirmed 150USD!!!The pattern have been greatly confirmed for me and i will sell my amd this week at 150 USD and i will wait at july when a drop will occurs to rebuy and i will cumulate more stock or more profits in cash.
The information and publications are not meant to be, and do not constitute, financial, investment, trading, or other types of advice or recommendations.
Thank you!
Subcribe TSXGanG! (For real chart)

Inverted H&S on AMD BULLISH FOR MONDAY !!!! 150$USD JUNE END!!!Analysis of the Inverted Head and Shoulders
- Left Shoulder: The price first dipped, formed a trough, and then rebounded.
- Head: The stock dropped further, creating a lower trough than the left shoulder, followed by a recovery.
- Right Shoulder: A higher low formed, aligning with the left shoulder before the price moved upward.
- Neckline Breakout: The confirmation of this pattern comes when the price decisively breaks above the neckline (resistance level), suggesting a continued uptrend.
Potential Outcomes
- Bullish Breakout: Once the neckline is breached, a surge in buying pressure could push prices higher.
- Volume Confirmation: Increased trading volume at the breakout strengthens the validity of the pattern.
- Price Target: Traders often project the price increase by measuring the distance between the head and the neckline, then adding this to the breakout point.
Given the current price action, this setup could indicate a strong bullish continuation. However, market conditions and external factors should always be considered before making trading decisions.
If you want to refine this analysis or explore other scenarios, I'm here to dive deeper into key points! 🚀 Subscribe! TSXGanG
I hold a CCVM and MNC (Certificate of Competence to become a securities broker anywhere in Canada) and have been working as a trader for five years.
It’s a pleasure for me to help people optimize their trading strategies and make informed financial market decisions.

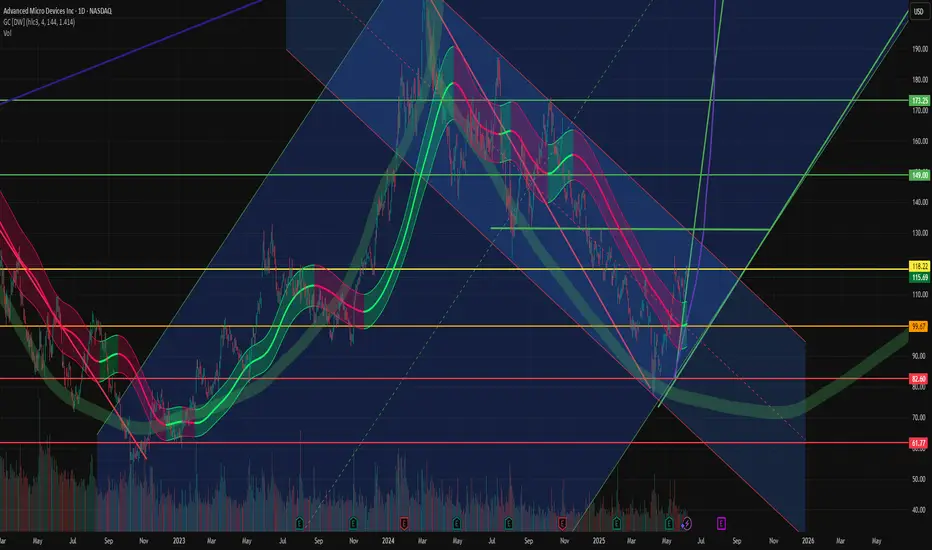
AMD will be bullish if we go higher than 128$ USD (CCVM)AMD (Advanced Micro Devices)
Stock appears to show signs of an imminent bullish recovery, according to several technical and fundamental indicators.
Technical Analysis TSX:AMD
- Current Price: $118.87, up 1.33%.
- Bollinger Bands: Indicate moderate volatility, with a trend toward the upper band.
- Trend Lines: A rising purple curve suggests a possible bullish recovery.
- Buy and Sell Zones: Annotations indicate strategic entry and exit points in the market.
Fundamental Analysis
According to the latest market analyses:
- Revenue Growth: AMD recorded a 36% increase in revenue in Q1 2025.
- Strategic Acquisition: The purchase of ZT Systems strengthens its position in data centers and artificial intelligence.
- Stock Buyback Program: AMD announced a $6 billion buyback, boosting investor confidence.
- Analyst Consensus: The average target price is set at $154.45, indicating significant upside potential.
Conclusion
Technical and fundamental indicators suggest that AMD may soon enter a bullish phase.
If you want to refine this analysis or explore other scenarios, I'm here to dive deeper into key points! 🚀 Subscribe! TSXGanG
I hold a CCVM and MNC (Certificate of Competence to become a securities broker anywhere in Canada) and have been working as a trader for five years.
It’s a pleasure for me to help people optimize their trading strategies and make informed financial market decisions.
AMD (Advanced Micro Devices, Inc.) BUY TF D1 TP = 184.94On the D1 chart the trend started on Aug.8 (linear regression channel).
There is a high probability of profit taking. Possible take profit level is 184.94
This level, which I have outlined above, is certainly not a “finish” level. But it is the level that has the “highest percentage of hits on target.”
Using a trailing stop is also a good idea!
Please leave your feedback, your opinion. I am very interested in it. Thank you!
Good luck!
Regards, WeBelievelnTrading

$AMD Quarter 3 (Q3) AnalysisAMD is playing out as planned since the initial Q2 prediction with a dip into the buy zone. I’ve been saying that AMD is an excellent buy opportunity under $100, and the bearish August and September price action has helped to send AMD down to this price level. I have $158.53 as a key price target for Q4, and I believe that AMD will form a new all-time high afterwards. Long-term I think AMD will be a $400-500 stock. The yellow trendline has been acting as a support level and AMD just formed a bullish bounce off this support. The red trendline will act as short-term resistance on the way up.

AMD Long Breakout - Key Levels PT 2NASDAQ:AMD has broken out of its wedge which it has been forming for quite sometime. Since it has broken out, it may come back to the $114.64 price level to use it as a support, and shoot up to $135.72. Or, it could just continue this bullish rally to the ultimate $135.72 price level. Congratulations to those who have successfully traded the first part to this NASDAQ:AMD push, this should be the second breakout push.

AMD STRONG UPTRENDAMD is currently creating a possible weekly higher low which is an indication of the start of a uptrend on lower time frames. AMD also has earnings after market today which could initiate the move or invalidate it. With the weekly having a closed bullish Pinbar @ the trendline there is strong confirmation signaling a bullish move up for the next week or two.

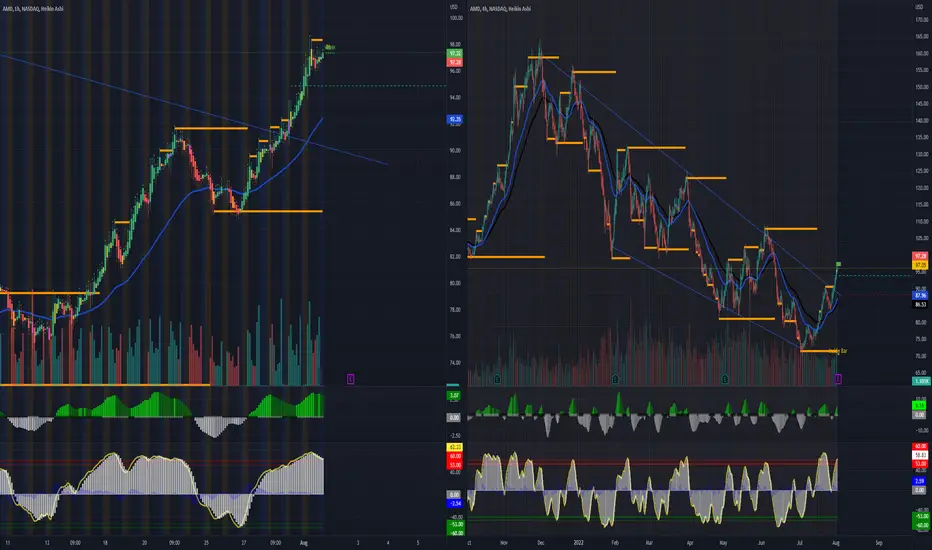
AMD bullish move? - $AMD continues to push higher, along with the broader tech sector, amid overall market strength.
- AMD broke through its tough resistance at $90 and is currently closing around $97.
- Technical indicators are signaling that it's overbought, so don't be surprised if the stock pulls back. Bulls need to hold AMD above $85-90 to continue its bullish momentum.
- $AMD average price move per day is $2-$6 per day depending on market volatility.
- Below are my price levels for AMD.
Calls: buy above 99.69 sell at 103.69+
Puts: Buy below 94.99 sell at 93.29
=================================================================
SIDE NOTE:
- make sure that you setup a price alerts on those key level so you wont miss the move.
and always to take your profits as you see one.
- sometimes, the fist 30 minute after of the opening bell is always volatile.
is either you can catch the move there. or wait for an 1 hour for better or cheaper price.
- as always if you have any question feel free to leave me a comment here.
if you're enjoying my ideas please don't forget to follow me or give the idea
a boost or like. thank you see you all soon.

🟢 AMD - 3D (06.10.2022)🟢 AMD
TF: 3D
Side: Long
SL: $54.69
TP 1: $86.81
TP 2: $101.65
TP 3: $113.65
AMD has done falling and showing signs of recovery by creating a possible rounding bottom in lower time frames.
I think it will start pushing back up now as RSI and MACD look like they have bottomed and wanting to go up.

$AMD falling chopstick breakout?AMD breaks out from its 3 day losing streak to 4 day winning streak after the feed week and blue chips earnings. AMD looks like a falling chopstick at 4hr chart. but also clearly visible its lower high movement. with earnings coming up tomorrow after market close. i expect $AMD to pull back along with the overall market as it starts to cool off its steam from 4 day winning streak. or it can go sideway like consolidation and make little move before the market close. AMD could breakout to $100 if they beat the Wall Street EPS estimate with positive guidance.
here my price target for $AMD for monday 08/02/22.
============================================================
For calls; buy above $98.30 and sell at 100.36 or above
For puts, buy below 96.50 and sell at 93.95 or below
============================================================
Welcome to this free technical analysis . ( mostly momentum play )
I am going to explain where I think this stock might possibly go the next day or week play and where I would look for trading opportunities
for day trades or scalp play.
If you have any questions or suggestions on which stocks I should analyze, please leave a comment below.
If you enjoyed this analysis, I would appreciate it if you smashed that LIKE or BOOST button and maybe consider following my channel.
$AMD down trend momentum$AMD has been trending down at a lower level ever since the market continues to pull back. Since then, $AMD picks ups a lot of short interest creating this downward move. The company's earnings have been amazing lately and continues its innovation for computer chips and probably expanding their reach to cloud computing and so on. a lot of big institutional traders seeing a buy, but the uncertain of the current market right now, preventing some traders to hold the stocks for long swing.
The average move of AMD per day is about $4.00-6.00 depending on market conditions and news.
here my price target for $AMD for monday 07/11/22.
============================================================
For calls; buy above $80.15 and sell at 82.14 or above
For puts, buy below 78.18 and sell at 77.40 or below
============================================================
Welcome to this free technical analysis . ( mostly momentum play )
I am going to explain where I think this stock might possibly go the next day or week play and where I would look for trading opportunities
for day trades or scalp play.
If you have any questions or suggestions on which stocks I should analyze, please leave a comment below.
If you enjoyed this analysis, I would appreciate it if you smashed that LIKE button and maybe consider following my channel.
