AMD - Final Push UpA chart for AMD showing bullish activity and price entering a major channel
A phase like this has been seen previously and has been marked with corresponding colours
A giant falling wedge is the culprit for the recent bullishness
One more final move up until top at 1.272
Amdbuy

AMD BUYwe can see a fight going on between the buyers from the bottom support level and the sellers from the upper resistance level with the buyers carrying lot of volume and momentum , i give it an 85% that could brake that resistance and continue upwards

AMD Short term longWe finished 1 to 5 Elliot wave pattern and ABC correction, while in ABC correction market created Institutional candle and retraced to it that is our signal to buy and we are looking for market to retrace to 50% fib zone
Entry Price:108
Target:128
Invalidation: 99

AMD: Will double or triple in the next 12 monthsA detailed explanation as to why I believe AMD stock will double or triple in the next 12 months. See my other posts for my Elliot wave count.

AMD: It is a wonderful time to buyHello traders, it looks like AMD is finishing up its W-2 within a larger degree W-3. We see that price is approaching the .786 fibonacci retracement, and we have a positive MACD divergence. This is a great opportunity too add to your long positions. Soon we will be in W-3 of W-3, so that will be a very powerful move to the upside. Good luck traders :)

AMD: Big Picture Looks GoodHey friends, here is my longterm view of the AMD chart. On the smaller scale, I think it should bottom in the $80-$90 region and then begin the next leg up to $300+. I would be selling at 300 with the hope of purchasing back at the 150 level for the final leg up to 500+ before AMD enters a prolonged bear market where price can reach the same level it is today.

AMD: Now is NOT the time to buyHello Friends, here is a fresh AMD update. Unfortunately, the outlook is not good right now. For me, I am expecting a final move down to the $86-$92 region before we resume the uptrend. I think the sweet spot will be $88, because this will be the .236 retracement. AMD is very volatile, so large swings like this should not be surprise. For now, I will wait for my price target :)

AMD: Time to fill the Gap at 106Hey all, I wanted to give a quick AMD update this morning. After today's price action, the structure of AMD's decline has become more clear. I believe we have 1 leg down to go which should bring us to the 106 region and fill the gap that was left behind. This will be good for AMD longterm, as it is not a a good thing to leave open gaps behind in the chart. I will be adding heavily in the 106 region if we get there. Upside targets are still in tact. Good luck traders.

AMD: Time to go longAMD underwent the C-Wave drop that we warned about in our update a few days ago. C-Waves are generally the fastest moving and harshest waves, so it is no surprise that AMD fell about 15% in just 2 days. The speed and depth of the move even exceeded our expectation. In fact, this move was so steep that it difficult to come up with a clear 5 wave pattern down. It may still just be 3 down so far.
My base case is this: AMD has bottomed and will now begin its W-3
My bear case is this: AMD has 1 more low to make, which will likely fill the gap at the 105 level
Either way my upside targets remain the same: 160 In 60 days, and 200 in 120 days

AMD: Go long at 117AMD gave us a clear 5-wave impulsive move off the lows, what happens next is very important. This could be an A-B-C with a final low yet to be struck, but the probability of that has decreased dramatically in my opinion. Right now we are topping in the B-wave. Expect the C-Wave to bring us to the 117-110 level. I will be initiating a long position at 117. Price target for this swing trade is 200+. Nice R/R setup.

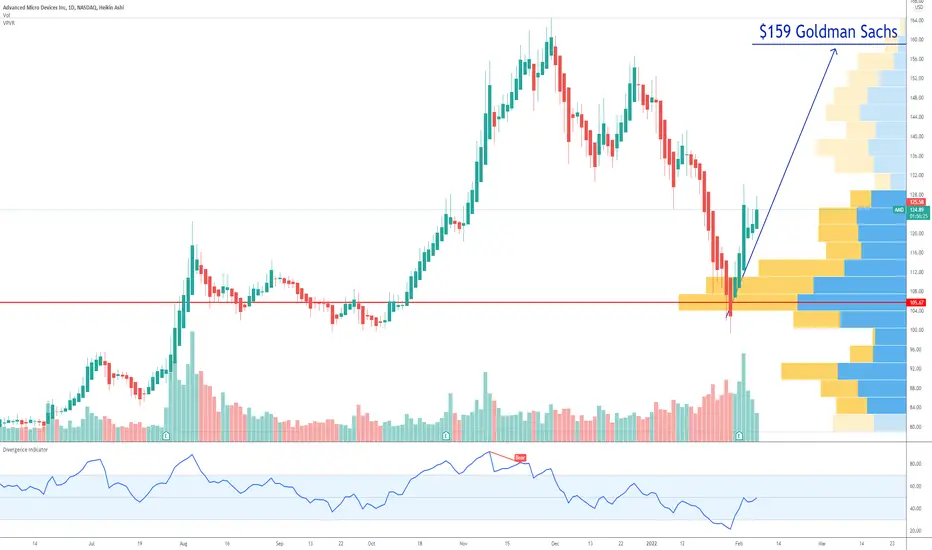
AMD Set Price Target by Goldman Sachs If you haven`t bough the January 2021 retracement here:
Then you should know that on 2/2/2022, Toshiya Hari from The Goldman Sachs Group Set Price Target for AMD at $159.00.
Looking forward to read your opinion about it. When it will reach that price target.
AMD: Still looking for a bottomAMD had a strong 4th wave bounce after it's stellar earnings report. However, the stock turned downwards at a key resistance level. It appears that AMD is forming an expanding diagonal as the C-Wave of this A-B-C pullback. My ideal target is the 2.0 extension, which is $90, before we resume the broader uptrend.

AMD oversold at January 2021 level | Buy areaAMD recently touched the January 2021 high and it`s oversold while the earning are growing.
This dip looks like a great buy opportunity in my opinion.
The buy area is between $95 to $105
The short term upside is $118
Looking forward to read your opinion about it!

AMD ready for making new highsWe are long on AMD and have been adding positions ever since. It could enter into the big club: FANG MAT (Facebook, Apple, Nvidia, Google, Microsoft, Amazon, Tesla). Semiconductors play an important role in the present and future. We say Buy and hold for this one.

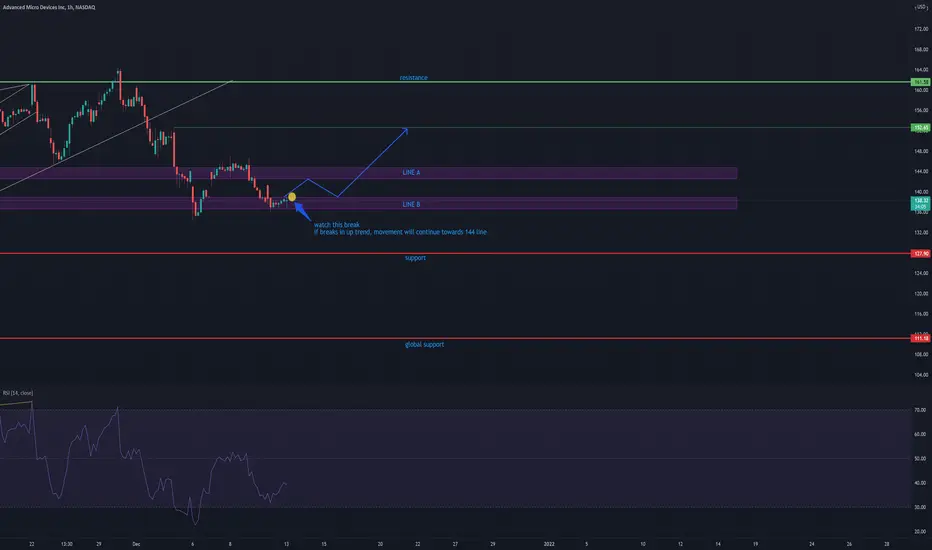
$AMD Simple Trend Analysis $AMD Stock review for the upcoming week
NOTES:
-Currently trading at $138/s
-It is testing line B
-IF AMD moves up and breaks the like B it will continue to $144/s LINE A easily
-IF AMD breaks LINE A in uptrend, it will test the resistance line as well
-Currently no RSI Divergence at 1H mark to notice
Just another AMD chartLooks like people taking profits, which is typical for the month of December. I'm buying in this area.
Resistance/Support Line Colors:
Red - Heavy
Orange - Moderate
Green - Intraday

$AMD Technical Analysis $AMD Technical and notes
NOTES:
- The stock has had tremendous uptrend in past year.
- We are seeing record high numbers.
- Earnings are strong for the company.
TAKEAWAY:
- As charted, the uptrend is continuing but there seems to be a squeeze as it reaches the Resistance line.
- WATCH the resistance line price.
- Stock should continue to Resistance line and that is where we see what happens.
-- IF stock does NOT break resistance line, it will come down to $144 levels
-- IF stock DOES break the resistance line, it will become new support and we will see more uptrend.
If you want to see a TA let me know which stock you want to look at.

AMD is looking beautifulAMD has bounced up from support @ 136 using Aspen Trading Support & Resistance Levels.
It has moved closer to the resistance level of 152.25 and a move above this level can lead to further upside.
Please like, share and follow if you agree with the analysis.
Note - Aspen Trading S/R levels are invite only. They can be accessed through my profile information.
Disclaimer: This analysis is for information purpose only and does not constitute any investment advice.

AMDAlready +20% gains. Long/Strong until TP hit. Buy/Hold . Tech sector outperforming market. Buy at Market and exit at +35% gains. PT Bulls is $125 USD Aug/Sept 2021. Best strategy for Bulls is to Buy at Market SL 5% , TP is $125USD , +35% gains.


AMD - GREAT Buy Opportunity, IF ... !!!Hello! Friends,
-This would be a great Buy Opportunity, IF NASDAQ:AMD breaks up the Daily Resistance line at $79.10 (with a WHOLE DAILY Candle) !!


AMD LongNice setup here. As long as it stays over 87, we can target 94.49-95.50-100. PLEASE have a tight stop loss on all your longs and dont leave much capital on the line. These coming days are a flip coin! Happy trading :)
