AMD in cross section of 2 important levelsAMD is at the crosssection of 2 important
trend lines
1. from Jun22 lows to sep23 lows and Aug 24 lows,
breaking down in Dec24.
2. The channel from Mar24.
I hope the price comes down to 133 levels.
Amdshort

Big move for AMD monday inverted H&S greatly confirmed 150USD!!!The pattern have been greatly confirmed for me and i will sell my amd this week at 150 USD and i will wait at july when a drop will occurs to rebuy and i will cumulate more stock or more profits in cash.
The information and publications are not meant to be, and do not constitute, financial, investment, trading, or other types of advice or recommendations.
Thank you!
Subcribe TSXGanG! (For real chart)

Bearish forecast for DXYWith regards my previous forecast, we have a strong reaction from Weekly and daily premium arrays.
On the weekly TF, we have IOFED of the SIBI and BSL above previous 2 weeks' highs was taken.
Tf: time frame
IOFED: Institutional Order Flow Express Entry Drill
SIBI: Sellside Imbalance, Buyside Inefficiency.
BSL: Buy side liquidity

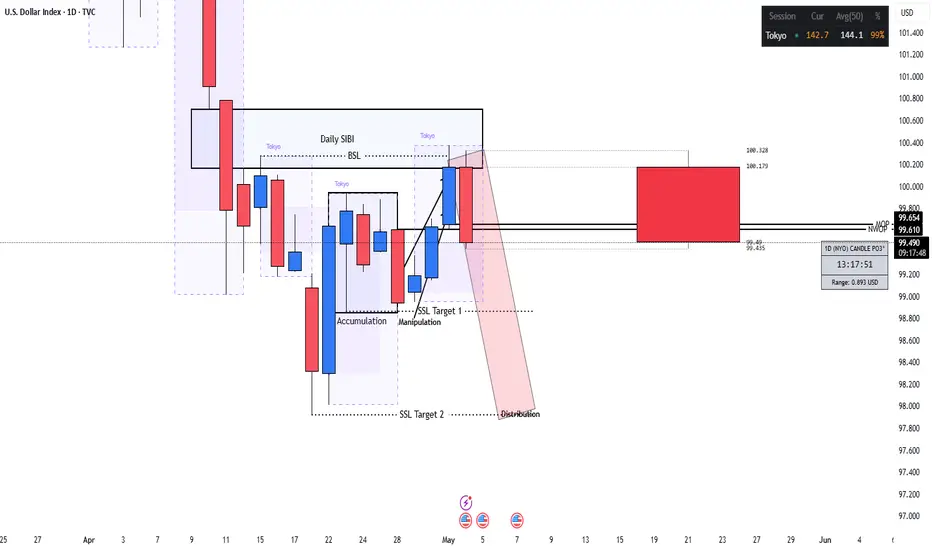
DXY Bearish Forecast for Quarter 2, 20251. Technical analysis
The idea is based in ICT's PO3; AMD pattern.
We have a rally above the open price of May 2025, to take out BSL above the highs.
It also aligns with Daily tf premium arrays to short from.
The lowest hanging fruit being the relative equal lows at equilibrium of the dealing range.
2. Fundamental analysis
Investor's confidence in the Dollar is low due to POTUS' tariffs.
ICT: Inner Circle Trader
PO3: Power of 3
AMD: Accumulation, Manipulation & Distribution
BSL: Buy side liquidity
tf: Timeframe

AMD Weekly Options Trade Plan 2025-04-16NASDAQ:AMD AMD Weekly Analysis Summary (2025-04-16)
Below is a synthesis of all the reports and our analysis:
─────────────────────────────
COMPREHENSIVE SUMMARY OF EACH MODEL’S KEY POINTS
─────────────────────────────
• Grok/xAI Report
– Technical indicators show AMD trading below its short‐term moving average and near the lower Bollinger Band.
– Negative MACD histogram and bearish news (export restrictions, potential $800M charge) support a downward bias.
– Recommends a bearish options trade using a near–ATM put – the $89 put at a premium around $1.78 (a higher premium but with a clear bearish thesis).
• Llama/Meta and DeepSeek Reports
– Confirm the bearish bias: price action below key moving averages, negative MACD and extreme moves below support.
– Note that the option chain (and high open interest on lower strikes) points to a greater probability for further decline.
– Both suggest a trade on put options that have a lower premium than the Grok suggestion (with DeepSeek favoring the $85 put at roughly $0.62) for improved risk/reward.
• Gemini/Google Report
– Emphasizes the strong negative catalyst from news and a rapid breakdown below support levels (with current price near $89).
– Technical indicators and volatility (VIX above 30) signal that the underlying is likely to fall further.
– Offers several put strike ideas and finds that the $84 put (premium ca. $0.49) fits the ideal price range; however, liquidity and open interest are better for the $85 strike.
─────────────────────────────
AREAS OF AGREEMENT AND DISAGREEMENT
─────────────────────────────
Agreements:
– All models (except for the one reporting an error) agree that the market sentiment is bearish.
– The negative news catalyst (export controls and potential charges) and the technical breakdown clearly drive the consensus.
– There is broad recognition that options data (with high OI on puts and max pain around $95)
is supportive of a downside move.
Disagreements:
– The primary difference is in the strike selection. Grok favors a put close to the current price (the $89 put) despite its higher premium, while Gemini, Llama/Meta, and DeepSeek lean toward lower strikes ($84–$85) that offer a lower premium (falling in or near our ideal range) and better liquidity for a weekly trade.
─────────────────────────────
CLEAR CONCLUSION & RECOMMENDED TRADE
─────────────────────────────
Overall Market Direction Consensus:
– The overall view is bearish. All models (apart from the one error) indicate that AMD is under significant downside pressure fueled by both technical breakdown and negative news sentiment.
Recommended Trade:
• Trade Type: BUY single‐leg, naked PUT (weekly option only)
• Chosen Strike: $85
– Rationale: The $85 put (ask at $0.64) offers good liquidity (high open interest of 10,218 contracts) and although its premium is slightly above the preferred $0.30–$0.60 range, its risk/reward profile is attractive given the bearish momentum.
• Expiration: April 17, 2025 (weekly options)
• Entry Timing: At market open
• Proposed Parameters:
– Entry Premium: Approximately $0.64
– Profit Target: Around $1.00 (this represents an attractive move if the bearish trend continues)
– Stop Loss: Approximately $0.45 to limit risk if price recovers unexpectedly
• Confidence Level: ~70%
• Key Risks and Considerations:
– Short‐term volatility may create intraday bounces despite the overall bearish trend.
– An oversold reaction or a temporary return toward the max pain level ($95) could adversely affect the trade.
– As this is a news–driven and highly volatile environment, trade size must be limited relative to account size.
─────────────────────────────
TRADE_DETAILS
─────────────────────────────
The final trade parameters in JSON format are shown below.
TRADE_DETAILS (JSON Format)
{
"instrument": "AMD",
"direction": "
put",
"strike": 85.0,
"expiry": "2025-04-17",
"confidence": 0.70,
"profit_target": 1.00,
"stop_loss": 0.45,
"size": 1,
"entry_price": 0.64,
"entry_timing": "open"
}

AMD Analysis: Shorting to $100 as Cup & Handle Pattern FormsHello Traders,
I'm sharing a weekly chart analysis for AMD, where I’ve identified a Cup & Handle pattern. The current price is $148, and it's retesting the broken red trend line.
I suggest considering a short position targeting $100. I've also included a back test for the two previous patterns, which support the validity of the middle red trend line.
It's important to note that if AMD reaches the $100 level, the Cup & Handle pattern above the blue trend line will become valid, potentially targeting even lower levels around $55, or possibly further down.
Additionally, pay attention to the downtrend progression channel in cyan. The current price of $148 is positioned around the resistance of this channel's middle line.
If these scenarios play out, a harmonic pattern may also form, which I will define at a later stage.
Stay cautious and manage your risk!

AMD: Looks like bottom, finally!NASDAQ:AMD : Looks like bottom, finally!
Weekly Chart Analysis:
- 200D MA
- Volume Shelf
- Bottom of Falling wedge
- S/R Zone
- Divergence on the Wr%
$135 ▶️ $165 Incoming 🎯
Not financial advice

AMD = The Trader Slayer!NASDAQ:AMD
We got a lot going on here with AMD!
- In the volume gap and could fall down to the shelf at $108 or we could have just hit a double bottom with a breakout spot at $174ish.
-H5 Indicator is RED and they are in a downtrend while also forming a Bull Flag (barely).
-Sitting on the bottom of the Wr% and could form a downtrend box or start running to the upside.
It all makes sense to me. This name is an extremely difficult name to trade and has eaten the best traders whole, myself included.
One thing is clear to me! trying to trade this name right now with all of these mixed signals is risky-business! I'm steering clear until we get some certainty!
No price targets because who knows whats gonna happen. 🤣
Not financial advice.

AMD - Rejection From Top of Up Channel AMD is within a large up channel and may be rejected as it has been from this channel top before
It may recovery at this middle of this channel or go the full way down to the bottom of channel
Bearish
Weekly Timeframe

AMD’s Earnings Stumble | A Golden Opportunity for Investors?Post Earnings Dip, Is AMD ready for a 2025 Comeback?
Shares of Advanced Micro Devices dropped over 10% after releasing its third quarter FY2024 earnings report, which fell short of investors’ expectations. Although the results were not poor, the market had high hopes given AMD's premium stock valuation. The company did surpass revenue projections, but its non GAAP EPS matched market expectations plus the midpoint of its fourth-quarter revenue forecast slightly missed estimates.
In my prior analysis, I upgraded AMD from a sell to a buy after a 20% dip, which realigned market expectations. Since that upgrade, the stock has climbed 15%, outperforming the S&P 500 Index by 9%. The recent earnings-driven decline has brought AMD's stock price close to my previously mentioned level.
While the gaming segment saw a sharper decline in revenue in 3Q, the Data Center GPU division continued to exhibit strong growth, boosting overall revenue growth and improving margins. I believe AMD is still in a strong position to further accelerate revenue growth and margin expansion in the fourth quarter and beyond. As a result, I see the post-earnings dip as a buying opportunity and maintain my buy rating on the stock, supported by its anticipated growth phase justifying its premium valuation.
For 4Q FY2024, AMD projects 21.6% YoY revenue growth at the midpoint of its guidance, with a $300 million potential variance. This growth is expected to be driven by continued expansion in Data Center GPUs. Although the midpoint guidance is slightly below market consensus, I believe AMD could exceed this number, given its track record. My estimate suggests a 24% YoY revenue increase, or $150 million above the midpoint.
3Q EPS Analysis Shows Margin Pressure
AMD has shown consistent margin improvement since 4Q FY2023, though the pace in 3Q didn't meet expectations. EPS aligned with estimates despite revenue exceeding forecasts, indicating margin challenges. Non-GAAP gross margin rose by 50 bps sequentially, while non-GAAP EBIT margin showed strong improvement, rising by 350 bps QoQ.
AMD forecasts a 4Q non-GAAP gross margin of 54% and operating expenses of $2.05 billion, driven by a favorable mix from its Data Center segment, which now represents 52% of total revenue. Management noted that gross margins in the Data Center segment are below the company average, focusing on customer needs and market growth for future gains. This contrasts with NVIDIA (NVDA), which reportedly has higher Data Center margins, though specific figures are not disclosed.
With a 4Q revenue consensus at $7.65 billion, AMD projects a non-GAAP EBIT margin of 27.2%, suggesting an additional 200 bps sequential increase. The company appears well-positioned for both revenue growth and margin improvement, despite its valuation declining after the recent stock pullback.
4Q EPS Outlook Signals Continued Growth
Although 3Q non-GAAP EPS met expectations, AMD’s growth accelerated from 18.1% YoY in 2Q to 32% in 3Q. However, the selloff post-earnings implies that investors anticipated even higher growth. Based on 4Q guidance, I estimate AMD’s non-GAAP EPS at $1.10, marking a 44% YoY increase.
AMD's FCF profile also improved, generating $496 million in 3Q, a 13% QoQ increase despite a one-time acquisition-related expense of $123 million. Higher capital expenditures are expected in FY2025 to support MI300 growth and maintain momentum.
Market Expectations and Valuation Impacts
Before the 10% post 3Q selloff, AMD’s EV/EBITDA TTM was higher than NVIDIA’s, but they are now on par, despite AMD’s margins and growth trailing NVIDIA's. AMD’s non-GAAP EV/EBITDA forward multiple is 46.3x, compared to NVIDIA’s 42.6x, and its forward P/E ratio is 50.4x, 17% above its 5-year average and higher than NVIDIA’s 49.7x.
While AMD's premium valuation can be justified given its growth acceleration, NVIDIA’s triple-digit EPS growth is not expected to continue. Moreover, NVIDIA’s gross margin recently declined, reinforcing the case for AMD’s valuation as it expands its growth in FY2025.
AMD’s stock has retraced to a 0% YTD return due to margin concerns and underperformance in Gaming and Embedded segments, though the latter is gradually recovering. However, the company’s strong Data Center gains and continued margin expansion indicate a solid growth phase. The recent selloff has recalibrated market expectations, and with ongoing AI-driven demand, AMD’s growth is likely to extend into FY2025, making the pullback an attractive buying opportunity.
What you think, Are you Moonish on AMD?

AMD (Advanced Micro Devices) SELL TF H1 TP = 134.58On the H1 chart the trend started on Aug. 21 (linear regression channel).
There is a high probability of profit taking. Possible take profit level is 134.58
Using a trailing stop is also a good idea!
Please leave your feedback, your opinion. I am very interested in it. Thank you!
Good luck!
Regards, WeBelievelnTrading

AMD Investigating Potential Data Breach by Hacking GroupChipmaker AMD is facing a potential data security breach after a hacking group known as IntelBroker claimed to have stolen sensitive information. This information allegedly includes details on upcoming AMD products, customer databases, and internal documents. While leaked screenshots provide some evidence of a compromise, AMD is working with law enforcement to determine the full scope of the breach and mitigate any potential damage.
Investor Jitters and Competitive Risks: The news caused a slight dip in AMD's stock price as investors grappled with the potential consequences. If confirmed, the stolen data could significantly impact AMD's competitive edge, especially if information about future product lines and proprietary technologies is compromised. This wouldn't be the first time AMD has faced such a challenge – the company previously dealt with a data breach in 2022.
Cybersecurity Concerns in the Tech Sector: This incident underscores the escalating threat of cyberattacks within the technology industry. With a reported 78% increase in data breaches from 2022 to 2023, the need for robust cybersecurity strategies and vigilant monitoring is paramount.
Beyond AMD: Broader Implications: The potential breach highlights the far-reaching effects of cyberattacks. Stolen data sold on the dark web can be used for various malicious purposes, impacting not only the targeted company but also its partners, customers, and the entire industry.
Looking Forward: Lessons from the Investigation: As AMD investigates the claims, the outcome will be closely watched not just for its impact on the company's future but also for the broader lessons it offers in the ongoing fight against cybercrime. This incident serves as a stark reminder for all companies to remain proactive and continuously strengthen their cybersecurity defenses against increasingly sophisticated threats.

AMD Short Trade Opportunity - Very Overbought in a Greedy MarketNASDAQ:AMD is currently above a resistance level, and I think the price is very overbought here. There is still some bullishness short-term, but shorts have been getting wrecked and I wouldn't FOMO here. Maybe there could be a short trade setup once AMD stops trending up. I like the current price levels for shorting.
I believe semiconductor chip stocks have been extremely bullish, and I haven't wanted to be against them. However, they seem very overvalued at current prices, and I think the market could get a pullback soon. I think the AMD stock price and RSI will need a correction within the next few weeks. The correction could put AMD around $140 price levels.

AMD - Starting to Accumulate.AMD - Currently down 50% from ATH starting a position for long-term.
Looking to add at levels of support indicated in cyan. Big bids at 59-50 and 34-29.
Short-term trend change if yellow zone gained. Targeting orange around 100 for profit taking.
Looking for new ATH on gain of purple.

Market Top Looming For AMDRan through historical data on AMD and have quite a few signals of interest. The first event is bullish and calls for a move into the larger green box. Typically my signals come with a delay until the final movement is achieved. In this case, my Aggressive Multi-time frame indicator fired based on January 22, 2024 closing price. The signal was bullish, however, the common delay sees a retracement into the are of the pink box. Today, AMD moved down into the pink box possibly satisfying the delay prior to moving above the signal price and thus completing the signal.
Although the delay and successful signal have both occurred, the stock cannot trade straight sideways forever. The likely direction is still very bullish, even if the stock were to revisit the small pink box in the next two days. Believing the stock will continue up, the question then becomes how high?
I figure we are in the final end of an impulsive wave C. The five waves in this wave C are the larger Yellow numbers from when the wave began at the low on October 26, 2024. Yellow waves 1-4 are likely completed and we are in the final wave 5 upward now. Some of the common reversal points are highlighted with the wave extension levels on the right. 100% of wave 3's movement is at 151.05 while 200% is at 185.73. A wave 5 typically does not breach the 176.40% level therefore placing a likely top below 177.55.
This yellow wave 5 is composed of five smaller white waves, of which 1-3 are likely completed and it is unknown if wave 4 was completed today too. Wave 4 could complete if there is additional downward movement within the next two days. Once wave 4 is confirmed the final white wave 5 will coincide with the market top. The same levels are interest on the left likely indicate a top below the 114% level. A common top is normally no higher than the 106-110% mark for micro fifth waves. This would likely keep the top below 177.20.
I am not trying to find the top, but more of when the top could occur and what happens afterward. White wave 1 was five days, while wave 3 was six days. White wave 5 will likely be five days or less which is January 30. AMD reports earnings on January 30. There is a chance, either earnings, the outlook or a combination of factors do not fair well for AMD. There could be a final rally during the day on the 30th, until earnings come out after hours. AMD has debt that is due this year and the Fed's decision, but more likely its outlook on rate cuts this year could have a major impact on the refinancing of that debt. AMD could hold off on refinancing their debt if they believe cheaper rates are coming soon. If the Fed takes rate cuts off the table, do not provide a time table for cuts, or state factors enabling rate cuts are yet to be seen will force AMD to refinance their debt at higher rates. This could force them to sell stock (normally at a cheaper price), raise prices (consumers are already squeezed there) or another path not favorable to the short-term profitability.
The earnings fall out will hit the stock on January 31. The Federal Reserve provides the next decision point on January 31. There is another signal that triggered at the close on January 12th that remains unfulfilled. That bearish signal indicated the stock could fall below 146.56 before February 20, 2024 based on historical data. The actual target box for the movement is the large yellow box on the chart. Based on the 383 studied occurrences, the signal is correct 91.361% of the time. Correct in this case would require a movement below 146.56. This instance could fall into the 8+% of failure, or it could occur via a longer path. I am positing AMD could crash down into the yellow box after fulfilling all signal price targets (pink, green, and yellow boxes).
The Fed and earnings are only the beginning of the downward movement. I am still bearish on the market in the short-term (rest of 2024) even though I have called for the drop to occur in the prior months. The market is at new all-time highs, but are things really better than they were on January 3, 2022?

BTCUSD ForecastOn the 4H TF, we see the classic Accumulation and Manipulation for Bitcoin. We're now in the Distribution Phase.
Nonetheless, on the lower TF, we'd be looking to take advantage of another AMD formation into the 4H FVG before we continue downwards.


AMD shortAMD in a rising wedge
Short setup with risk-reward ratio: 8,7
Entree, stoploss and exit are on the chart.

ANALYSIS ON AMDDear Traders and Investors,
I'm sharing with you this analysis on AMD to tell you to close your position if you're holding a long trade, as you can see in the chart, the price pulled back on the 0.5 level of the fib and gave us a confirmation, now it's heading towards the 0.6.
For further question, don't hesitate to ask!

$AMD Due for a Correction This WeekAMD has been showing a lot of bullishness since September 26. However, AMD has reached the upper range of the white channel and is due for a correction this week. I have the yellow trend line as a key support level and my first price target. I think there will be a solid bounce off this yellow support line in the short term.

AMD (wait for sell)Hi everyone - I'm with you with AMD signal and analysis. By checking the weekly and monthly graphs of AMD, the signs of decreasing power of the ascent can be seen. And in the daily time frame, the rotation of the market can also be clearly seen. And also, the bearish power has increased compared to the bullishness of the market.
In the 4-hour time frame, you can see that it touched the ceiling of the channel several times, but it did not break and reached an important level. By closing the price below this level, a good opportunity to sell opens up and we can make a good profit. And bearish can continue until the end of the weekly channel (green channel).

AMD BUYHi, According to my analysis of AMD stock, there is a good opportunity to buy. Or a long-term investment. All reasons for purchasing are explained as shown in the analysis. Good luck everyone
