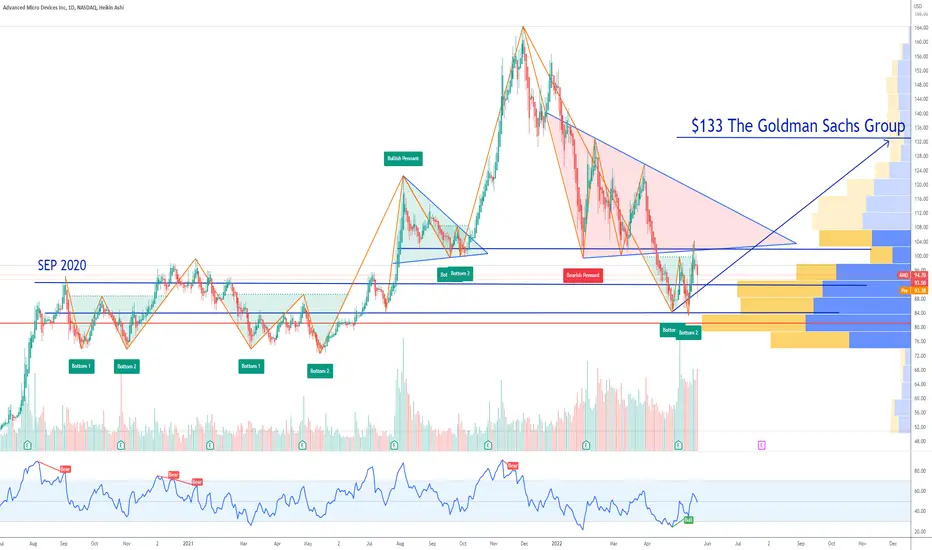
AMD Forward P/E discountIf you haven`t bought AMD here:
or here:
then you should know that AMD is trading at a 61% forward P/E ratio discount versus the 5 year average!
The Goldman Sachs Group has an $133 price target for it!
Looking forward to read your opinion about it.
Amdstock
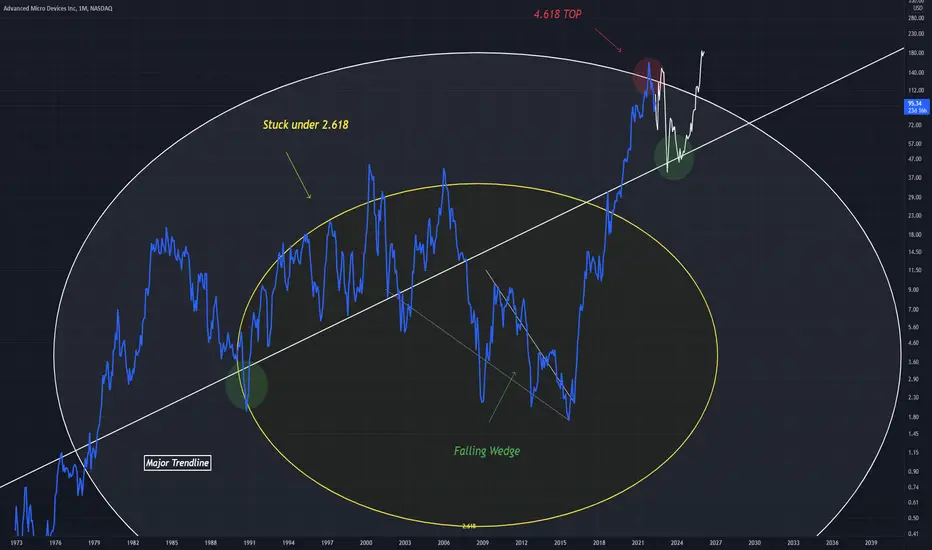
AMD AnalysisAn idea for AMD which suggests a pullback yet a support find above a major Trendline
Price action is very interesting in yellow, as it moves around the top of the circle (2.618)
White bars pattern is a guess of future price action (allowing support to be found at the Trendline.
Short $AMD CMP $104.05Short $AMD CMP $104.05. This one tried to bounce off of 200 SMA but failed. Today's big red candle is very big bearish sign that it will continue the downtrend. 20 and 50 SMA are nose diving on this one. It may hold $100 area but I am more inclined towards $90-$95 area support levels are more appropriate levels.
Short Target 1 is $100 area. Short Target 2 is $90-$95 area.

AMD earnings beat | Strong Buy Rating AMD entered the Buy area on oversold level predicted here:
AMD Q1 2022 Earnings:
EPS $1.13 vs $0.91 expected
Revenue $5.9B vs $5.2B expected
On 4/25/2022 Raymond James Upgraded AMD from Outperform to Strong-Buy setting a price target of $160.00
I think a reversal to $102 is most likely.
Looking forward to read your opinion about it.

AMD I like $166 next target, big run ahead I think So much confluence, volume profile looks ripe and similar to previous capitulations, looking so good.
AMDNot financial advice.
The essence of investing & trading is the intelligent and patient preying on the greed, fear, impatience, addiction and ignorance of the majority. It's definitionally Darwinian.

Back in the boxAMD just pullback to a major FIB retracement level. IMHO, it is going to consolidate and stay within a range for awhile.

Semis and Growth Stocks Leadership Up and Down - Look at AMDFor the past week we’ve been saying how the Semiconductors #SOX and NASDAQ-100 #NDX continued to not only trend in the same direction but their expansion between each other was evident of liquidation pressures continuing. These were even more evident as the 50 day moving average and 200 day moving average became dominant components of resistance. Nothing good comes of a stock when it’s unable to maintain the 50 day moving average!
The good news is the major indexes have not finally contracted into that 14,000 range on the #NDX that we’ve been touting on the Futures Market for about 2 weeks now.
Insert the chart here
It started to look as-if the low from April 12th was going to be a potential area for a leg up; however, it’s appearing a lower low could transform this upcoming week. As for right now, the mentioned recent low is holding the line by pennies. If the area breaks we will need to continue monitoring price action until a lower low is established, defended, and confirmed for the next leg upwards.
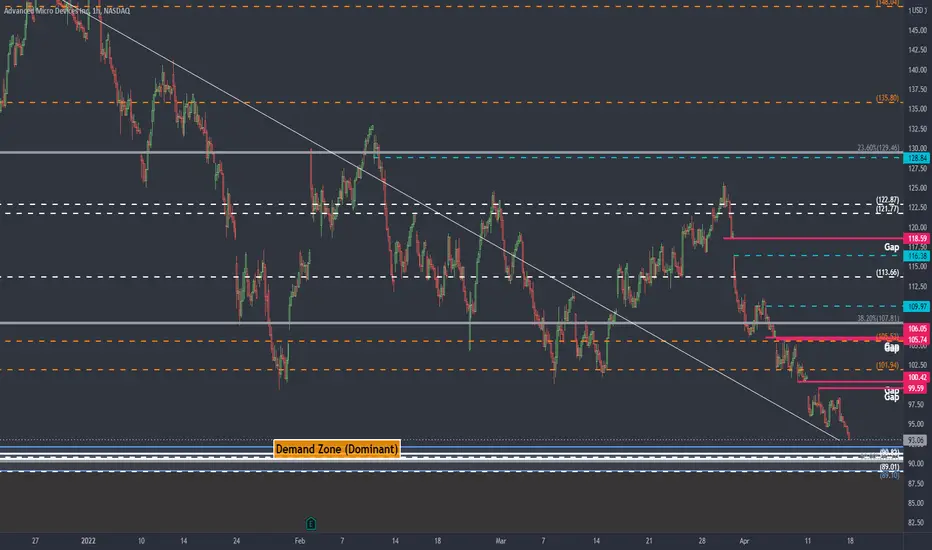
When we look at #AMD we can see the chart filled with continuous downward gaps and heading to the Demand Zone between 92-89, as pointed out in other postings and videos.
The Economics Thesis is surrounding the shortages of chips, which are in everything these days, thus a contributing factor into the price action throughout 2022. The stock has fallen about 43.50% (~ $72). As much as the news and “what is happening in this space” drives uncertainty and speculation on what's to come - I’m focused on my areas on the charts and within the technical analysis space. News and headlines (noise) is an ambiguous element into the world of trading and psychology. It turns the processors of emotional thinking, which cause tendencies to overthink and act with impulsive behaviors.
In any sense, there could be a turning point at the levels mentioned above. That is not to say we establish “thee low”, but it could generate some relief in attempts to close some upward gaps towards the recent highs of 125.67.
If all else fails, the next levels to watch are 792.0 and 72-80.
AMD at $100Advanced Micro Devices
Short Term - We look to Sell at 102.78 (stop at 111.05)
Preferred trade is to sell into rallies. Previous support at 100.00 now becomes resistance. 20 1day EMA is at 107.00. Short term oscillators have turned negative. Trading close to the psychological 100.00 level.
Our profit targets will be 74.92 and 69.10
Resistance: 100.00 / 125.00 / 155.00
Support: 80.00 / 73.00 / 60.00
Disclaimer – Saxo Bank Group. Please be reminded – you alone are responsible for your trading – both gains and losses. There is a very high degree of risk involved in trading. The technical analysis, like any and all indicators, strategies, columns, articles and other features accessible on/though this site (including those from Signal Centre) are for informational purposes only and should not be construed as investment advice by you. Such technical analysis are believed to be obtained from sources believed to be reliable, but not warrant their respective completeness or accuracy, or warrant any results from the use of the information. Your use of the technical analysis, as would also your use of any and all mentioned indicators, strategies, columns, articles and all other features, is entirely at your own risk and it is your sole responsibility to evaluate the accuracy, completeness and usefulness (including suitability) of the information. You should assess the risk of any trade with your financial adviser and make your own independent decision(s) regarding any tradable products which may be the subject matter of the technical analysis or any of the said indicators, strategies, columns, articles and all other features.
Please also be reminded that if despite the above, any of the said technical analysis (or any of the said indicators, strategies, columns, articles and other features accessible on/through this site) is found to be advisory or a recommendation; and not merely informational in nature, the same is in any event provided with the intention of being for general circulation and availability only. As such it is not intended to and does not form part of any offer or recommendation directed at you specifically, or have any regard to the investment objectives, financial situation or needs of yourself or any other specific person. Before committing to a trade or investment therefore, please seek advice from a financial or other professional adviser regarding the suitability of the product for you and (where available) read the relevant product offer/description documents, including the risk disclosures. If you do not wish to seek such financial advice, please still exercise your mind and consider carefully whether the product is suitable for you because you alone remain responsible for your trading – both gains and losses.

AMD Aimed Higher? Advanced Micro Devices
Short Term - We look to Buy at 101.31 (stop at 96.59)
We look to buy dips. 100.00 continues to hold back the bears. Trading close to the psychological 100.00 level. We expect a move higher in a corrective sequence, targeting Fibonacci retracement levels.
Our profit targets will be 114.62 and 123.06
Resistance: 120.00 / 145.00 / 155.00
Support: 100.00 / 84.00 / 72.00
Disclaimer – Saxo Bank Group. Please be reminded – you alone are responsible for your trading – both gains and losses. There is a very high degree of risk involved in trading. The technical analysis, like any and all indicators, strategies, columns, articles and other features accessible on/though this site (including those from Signal Centre) are for informational purposes only and should not be construed as investment advice by you. Such technical analysis are believed to be obtained from sources believed to be reliable, but not warrant their respective completeness or accuracy, or warrant any results from the use of the information. Your use of the technical analysis, as would also your use of any and all mentioned indicators, strategies, columns, articles and all other features, is entirely at your own risk and it is your sole responsibility to evaluate the accuracy, completeness and usefulness (including suitability) of the information. You should assess the risk of any trade with your financial adviser and make your own independent decision(s) regarding any tradable products which may be the subject matter of the technical analysis or any of the said indicators, strategies, columns, articles and all other features.
Please also be reminded that if despite the above, any of the said technical analysis (or any of the said indicators, strategies, columns, articles and other features accessible on/through this site) is found to be advisory or a recommendation; and not merely informational in nature, the same is in any event provided with the intention of being for general circulation and availability only. As such it is not intended to and does not form part of any offer or recommendation directed at you specifically, or have any regard to the investment objectives, financial situation or needs of yourself or any other specific person. Before committing to a trade or investment therefore, please seek advice from a financial or other professional adviser regarding the suitability of the product for you and (where available) read the relevant product offer/description documents, including the risk disclosures. If you do not wish to seek such financial advice, please still exercise your mind and consider carefully whether the product is suitable for you because you alone remain responsible for your trading – both gains and losses.

AMD: Buy Zone is 112-115AMD so far has completed 3 waves within this larger degree W-3, within an even larger degree W-1. Now, the uptrend is becoming exhausted, and the stock needs time to rest. Personally, I have sold covered calls against my AMD position to preserve some of the gains I've made over the last few weeks. I will be interested in adding to my position in the 112-115 level. However, after AMD reaches that level, it should go to about 140, then back down to today's levels, so there will be plenty of opportunity to add to your position over the coming 2 weeks or so. Ultimately, I believe this stock will reach $300+ by the end of the year, and it is my top chart for 2021.

SELL AMD TODAYGOOD EVENING,
1)we are below the VWAP .👌
2)the inverted order and strong condensation of the 4EMA.👇
3)bear divergence confirmed by STOCHASTIC .💪
4)protected by the last resistance. 💪
all these indicators say sell in a loud voice.
so BUY and open your wallets.🤑
GOOD LUCK.❤️

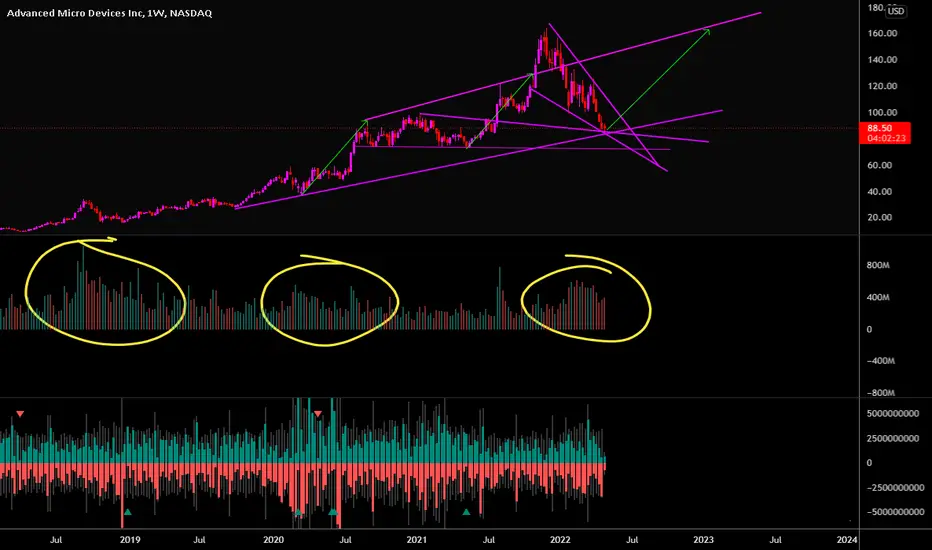
AMD - Final Push UpA chart for AMD showing bullish activity and price entering a major channel
A phase like this has been seen previously and has been marked with corresponding colours
A giant falling wedge is the culprit for the recent bullishness
One more final move up until top at 1.272

AMDAMD is having a nice little start to the day. Will pickup a few and maybe hold them over the weekend!

AMD Break Inbound? Advanced Micro Devices - Short Term - We look to Sell at 99.06 (stop at 103.51)
The medium term bias remains bearish. We look for losses to be extended today. This move is expected to continue and we look to set shorts at good risk/reward levels. Short term oscillators have turned negative. Previous support located at 100.00.
Our profit targets will be 84.22 and 79.31
Resistance: 120.00 / 145.00 / 155.00
Support: 100.00 / 84.00 / 72.00
Disclaimer – Saxo Bank Group. Please be reminded – you alone are responsible for your trading – both gains and losses. There is a very high degree of risk involved in trading. The technical analysis, like any and all indicators, strategies, columns, articles and other features accessible on/though this site (including those from Signal Centre) are for informational purposes only and should not be construed as investment advice by you. Such technical analysis are believed to be obtained from sources believed to be reliable, but not warrant their respective completeness or accuracy, or warrant any results from the use of the information. Your use of the technical analysis, as would also your use of any and all mentioned indicators, strategies, columns, articles and all other features, is entirely at your own risk and it is your sole responsibility to evaluate the accuracy, completeness and usefulness (including suitability) of the information. You should assess the risk of any trade with your financial adviser and make your own independent decision(s) regarding any tradable products which may be the subject matter of the technical analysis or any of the said indicators, strategies, columns, articles and all other features.
Please also be reminded that if despite the above, any of the said technical analysis (or any of the said indicators, strategies, columns, articles and other features accessible on/through this site) is found to be advisory or a recommendation; and not merely informational in nature, the same is in any event provided with the intention of being for general circulation and availability only. As such it is not intended to and does not form part of any offer or recommendation directed at you specifically, or have any regard to the investment objectives, financial situation or needs of yourself or any other specific person. Before committing to a trade or investment therefore, please seek advice from a financial or other professional adviser regarding the suitability of the product for you and (where available) read the relevant product offer/description documents, including the risk disclosures. If you do not wish to seek such financial advice, please still exercise your mind and consider carefully whether the product is suitable for you because you alone remain responsible for your trading – both gains and losses.

AMD Aimed LowerAdvanced Micro Devices - Short Term - We look to Sell at 120.45 (stop at 126.99)
Preferred trade is to sell into rallies. Prices expected to stall near trend line resistance. 50 1day EMA is at 121.00. Short term oscillators have turned negative. Previous support located at 100.00.
Our profit targets will be 101.28 and 85.50
Resistance: 120.00 / 145.00 / 155.00
Support: 100.00 / 85.00 / 72.00
Disclaimer – Saxo Bank Group. Please be reminded – you alone are responsible for your trading – both gains and losses. There is a very high degree of risk involved in trading. The technical analysis, like any and all indicators, strategies, columns, articles and other features accessible on/though this site (including those from Signal Centre) are for informational purposes only and should not be construed as investment advice by you. Such technical analysis are believed to be obtained from sources believed to be reliable, but not warrant their respective completeness or accuracy, or warrant any results from the use of the information. Your use of the technical analysis, as would also your use of any and all mentioned indicators, strategies, columns, articles and all other features, is entirely at your own risk and it is your sole responsibility to evaluate the accuracy, completeness and usefulness (including suitability) of the information. You should assess the risk of any trade with your financial adviser and make your own independent decision(s) regarding any tradable products which may be the subject matter of the technical analysis or any of the said indicators, strategies, columns, articles and all other features.
Please also be reminded that if despite the above, any of the said technical analysis (or any of the said indicators, strategies, columns, articles and other features accessible on/through this site) is found to be advisory or a recommendation; and not merely informational in nature, the same is in any event provided with the intention of being for general circulation and availability only. As such it is not intended to and does not form part of any offer or recommendation directed at you specifically, or have any regard to the investment objectives, financial situation or needs of yourself or any other specific person. Before committing to a trade or investment therefore, please seek advice from a financial or other professional adviser regarding the suitability of the product for you and (where available) read the relevant product offer/description documents, including the risk disclosures. If you do not wish to seek such financial advice, please still exercise your mind and consider carefully whether the product is suitable for you because you alone remain responsible for your trading – both gains and losses.

AMD: Will double or triple in the next 12 monthsA detailed explanation as to why I believe AMD stock will double or triple in the next 12 months. See my other posts for my Elliot wave count.

AMD: It is a wonderful time to buyHello traders, it looks like AMD is finishing up its W-2 within a larger degree W-3. We see that price is approaching the .786 fibonacci retracement, and we have a positive MACD divergence. This is a great opportunity too add to your long positions. Soon we will be in W-3 of W-3, so that will be a very powerful move to the upside. Good luck traders :)

AMD: Big Picture Looks GoodHey friends, here is my longterm view of the AMD chart. On the smaller scale, I think it should bottom in the $80-$90 region and then begin the next leg up to $300+. I would be selling at 300 with the hope of purchasing back at the 150 level for the final leg up to 500+ before AMD enters a prolonged bear market where price can reach the same level it is today.

AMD: Now is NOT the time to buyHello Friends, here is a fresh AMD update. Unfortunately, the outlook is not good right now. For me, I am expecting a final move down to the $86-$92 region before we resume the uptrend. I think the sweet spot will be $88, because this will be the .236 retracement. AMD is very volatile, so large swings like this should not be surprise. For now, I will wait for my price target :)

AMD: Time to fill the Gap at 106Hey all, I wanted to give a quick AMD update this morning. After today's price action, the structure of AMD's decline has become more clear. I believe we have 1 leg down to go which should bring us to the 106 region and fill the gap that was left behind. This will be good for AMD longterm, as it is not a a good thing to leave open gaps behind in the chart. I will be adding heavily in the 106 region if we get there. Upside targets are still in tact. Good luck traders.

#AMD More Entry Targetslast wave was having a higher momentum there for another downtrend is expected see highlighted in orange range showing entry range
keep in mind Targets are speculations the Sure thing is there is more downtrend on the short term
BE CAREFUL!! MANAGE YOUR OWN RISKS!!
DO YOUR OWN DD!! THIS IS NOT A FININCIAL ADVICE

AMD: Time to go longAMD underwent the C-Wave drop that we warned about in our update a few days ago. C-Waves are generally the fastest moving and harshest waves, so it is no surprise that AMD fell about 15% in just 2 days. The speed and depth of the move even exceeded our expectation. In fact, this move was so steep that it difficult to come up with a clear 5 wave pattern down. It may still just be 3 down so far.
My base case is this: AMD has bottomed and will now begin its W-3
My bear case is this: AMD has 1 more low to make, which will likely fill the gap at the 105 level
Either way my upside targets remain the same: 160 In 60 days, and 200 in 120 days
