Dow, go short. Hourly divergenceHere we now have a RSI and MACDH on the dow with a nice candle to show a potential reversal. This lines up now with the German DAX. Prices are quite overextended from a decent support box so we may see some profit thing / selling here. We have to be careful though with 5 min moving averages still not bearish and several rising trend lines.
If stops get taken out at 27428 we may see even more buying and a good opportunity to reverse and go long.
America

US Pushing Previous High/Safety Point Whilst Inner World CrumbleUS markets recovering from Q1 downfall. Markets must have attached themselves to the Falcon 9 and being dragged up to the International Space Station it seems considering what’s transpiring below it… (numbers V reality) Both markets flowing up the inner upward channel. The below remains the same but obviously with each positive day the market assumes a point of being stronger to tell a certain narrative. But we all know the saying ‘The bigger they are, the harder they fall’
VERY BEARISH if the following transpires before breaking the above safety points:
S&P: If P action closes below the orange line at 2723.3 attention will turn more bearish and watch for market to fall to 2460.2. In this instance will reassess market dynamics as it may bounce in this range or continue to fall
Dow: The same flows for Dow Jones with P action closes below the orange line at 22931.5 attention will turn more bearish and watch for market to fall to 20842.4. In this instance will reassess market dynamics as it may bounce in this range or continue to fall.
If a rise to Safety Zone seems the world is running ‘normal economics’ again.


Dow Jone Index DOUBLE HEAD AND SHOULDER FORMATION (??)I am seeking alternative views and opinions on this. I see a head and shoulder formation forming right after a head and shoulder formation. Current price is positioned at the key resistance neckline of both formations.
Let me know your views on this!
Iapiew


"Cisco: down move coming soon" by ThinkingAntsOk4H Chart Explanation:
- Price broke the Weekly Ascending Trendline and made a pullback to it.
- It is currently on an important Support Zone.
- If price has the strength to break it, there is potential to start a huge down move.
Weekly Vision:
Daily Vision:
Updates coming soon!

SPX SHORT THE 200 MA ?SPX 500 looks toppy here
The daily and 4 hour 200 sMA are very close (at 3010) so we can expect a rejection from this level
The 2850-2800 zone should be the next target.


FACEBOOKEverything is shown in the picture to whom it may concern, and I am at the service of everyone!

i think the T-BOND FUTURES for buying I think the T-bond FUTURES for buying just the level 1 ( 184.03 ) and level 2 (189.13 )

AAPL BREAK DOWN THE TRENDBREAKIN THE UP TREND AND TEST AGAIN WITH THE HANGING MAN CANDLE AND DEARISH CANDLE ===== short psitions to the golden levels on fibbonacci


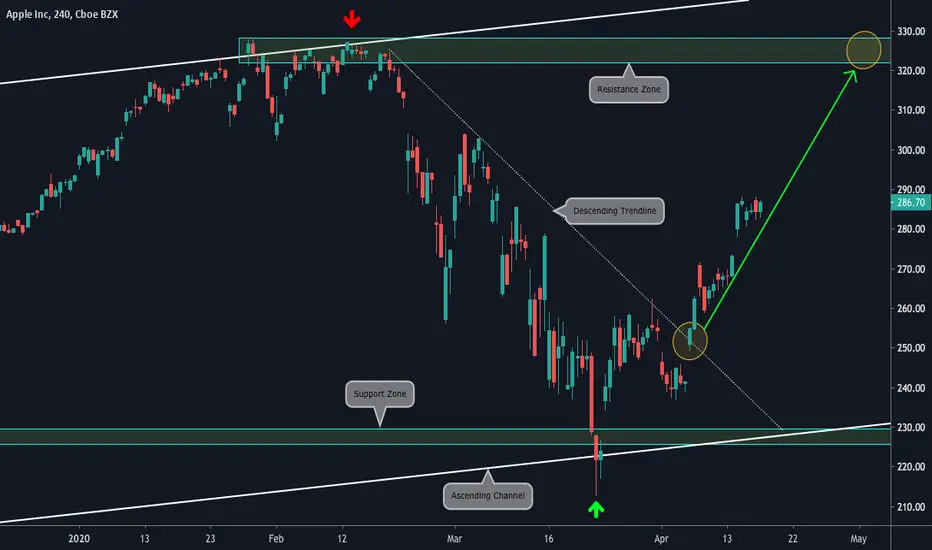
"Apple: towards the All Time Highs Zone" by ThinkingAntsOk4H Chart Explanation:
- Price bounced on the bottom of the Weekly Ascending Channel.
- Price broke the Descending Trendline and started its up move.
- Now, price has free path to go towards the ATH Zone.
Weekly Vision:
Daily Vision:
Updates coming soon!

Dow. H+Shoulders. DivergenceDivergence on the dow hourly MACDH. Possible head and shoulders, watch out for a fakeout breakout

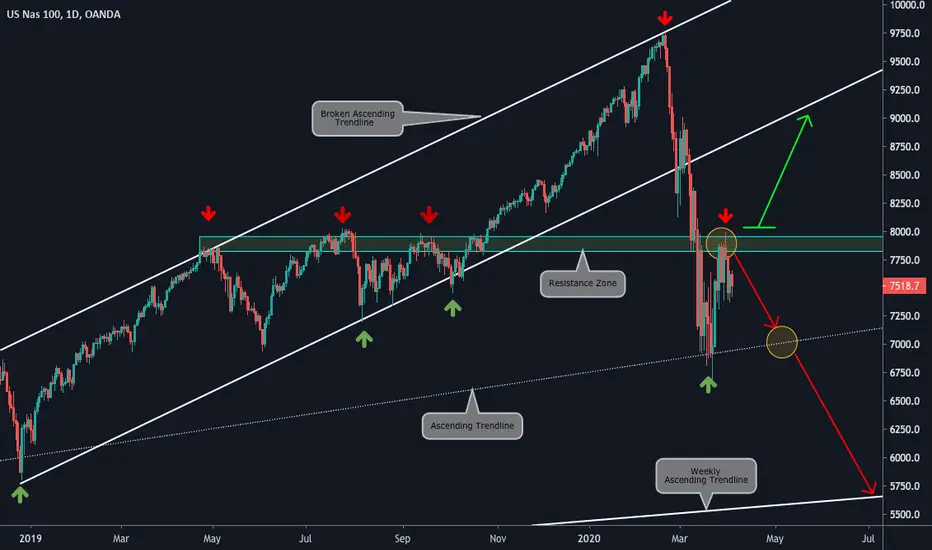
"Nasdaq: one up move more" by ThinkingAntsOk4H Chart Explanation:
- Price broke the Descending Channel and started a down move.
- It made a huge bounce from the Ascending Trendline.
- Now, it is above a Support Zone, trying to develop an ABC Corrective Structure.
- After that, price will move up towards the Pullback on the Descending Channel.
Weekly Vision:
Daily Vision:

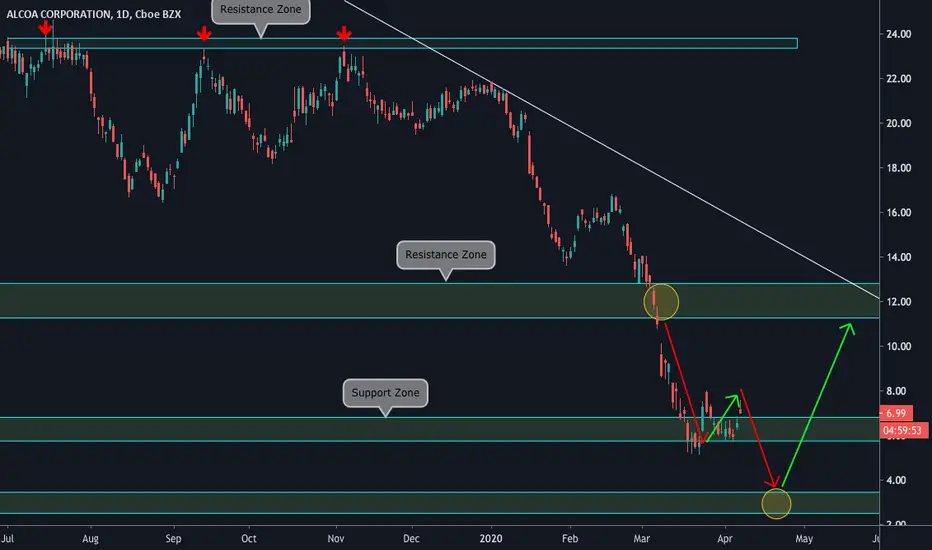
"Alcoa: one more down move coming" by ThinkingAntsOkDaily Chart Explanation:
- Price is on a Descending Trend.
- It si close to an important Support Zone.
- We expect price to get to there before looking for buy setups.
Weekly Vision:
4H Chart Vision:
CYCTB? American Express CO. Hello friends,
I feel in this time, it is important to document.
With that being said, I have always felt in the past I was always calling the bottom.
With this chain of posting I will post my thoughts on what I think the bottom will be.
Most companies are over sold and over leveraged.
Hope this finds you well.
Happy trading.
Disclaimed - This is NOT financial advice - Its chart speculation.

"Nasdaq: Top and Bottom Analysis" by ThinkingAntsOkDaily Chart Explanation:
- Price broke the Ascending Channel and, then, went towards the Ascending Trendline.
- It bounced from there until it faced the Resistance Zone.
- After that, it started the down move again.
- We will be looking for sell setups until price breaks the Resistance Zone at 8.000.
4H Vision:
Weekly Vision:
Updates coming soon!
Growth Covid-19 confirmed cases USUS is still on exponential growth curve confirmed cases (no signs of deceleration).

