$GOLD Index - Q3/2023 *3M (Quarterly)
Looking at TVC:GOLD on the 3M(Monthly) Tf(Time-frame)
from an investor perspective view of positioning;
(long-term investing on the yellow stone)
we can see it sitting at no men's land at the current price,
as well Changing Character and Breaking Market Structer (Lower Low) in price action ;
(Lows of Q2)
Despite its Bearish Price Action on *3M ,
States and Central Banks around the World have continued accumulating,
spreading wide their balance sheets in-to TVC:GOLD Reserves .
And so have done many another States,
including 2 out of three Global Superpowers of
China ECONOMICS:CNGRES and Russia ECONOMICS:RUGRES
America

Western Union is poised for upsideCup and handle has formed on the WU company since 7 March 2023.
During the time it's formed higher lows and has just broken above the Cup and Handle giving a conservative entry level.
Other indicators show upside to come.
7>21>200
RSI>50
Target R15.91

Dollar General (DG) | Short-term OpportunityHi,
A leading American discount retailer, Dollar General operates over 19,000 stores in 47 states, selling branded and private-label products across a wide variety of categories.
In fiscal 2022, 80% of net sales came from consumables (including paper and cleaning products, packaged and perishable food, tobacco, and health and beauty items), 11% from seasonal merchandise (such as toys, greeting cards, decorations, and gardening supplies), 6% from home products (for example, kitchen supplies, small appliances, and cookware), and 3% from apparel.
Stores average roughly 7,500 square feet, and about 75% of Dollar General locations are in towns of 20,000 or fewer people.
The firm emphasizes value, with most of its items sold at everyday low prices of $5 or less.
Technically speaking it has reached inside an interesting area. A few criteria matching with each other and probably it is worth to take a shot, from the shown box - $90 to $119, should be technically okay.
Criteria are simple:
1. The long trendline
2. All-time Fibo level 62%
3. The round number, psychological number, $100
Target around $140 - $150
Good luck,
Vaido

BAC is a good buy due to termoil in the markets. At the price of <$30 per share, this is a good opportunity to buy some Bank of America stock.
There are major issues with the banking system, mortgage market and bond market.
Due to the system we live in, this will lead to destruction of small banks, and the capital will flow into the large established banks. GS is too expensive so BAC offers some more potential.
I also prefer BAC because they are a little bit more open to Bitcoin.

Lyra showing strong upside to come, but first...W Formation formed on Lyra. And the price broke above the neckline and just shot up.
Now there are candles with Fair Value Gaps, which will need to close.
This will likely cause the price to come down, rebalance with the prices, consolidate and then move up again...
Other indicators show bullish moves for Lyra including:
7>21>200
RSI>50
Target one will be 6.56 USD

$DXY - The Ballads of Dollar (100-105)-The Dollar Index TVC:DXY has experienced lots of tremendous
vertical upside during these past two-three weeks.
From negative economic news of Chinese CCP report ;
to US economy on Sticky Inflation
and persistent outlook of Interest Rates being Hiked again,
seems as investors, smart money and quite of many retail traders are fleeing in to
TVC:DXY given safety.
Meanwhile TA speaking,
TVC:DXY has been broken Resistance Trendline from 114 High after occuring a FAKE-OUT
at the Bottom Support of Range (100.8) level.
Price went to close to the Weekly 200EMA,
which seems to have provided lots of Support for TVC:DXY
by pushing the price higher .
(check the next candelstick version idea)
Upcoming Resistances to watch for TVC:DXY :
-104.707
(Last Lower High + confluencing S/R area)
-105.883 (Lower High from 114)
(aswell being drawn a Range's Ceiling
TRADE SAFE

$DXY - Middle Range Warzone (100-105) - TVC:DXY has had a vertical rally from its fake-out breakdown of Range,
finding Support at 200EMA and got back to the Middle Zone Range S/R of 103 level.
The last idea published when TVC:DXY broke the range to the downside
( TVC:DXY -Headed South 97) played out in the opposite way of forecast expectation.
Eerie similar bars pattern move but on North direction, not South. (press play for bars)
With TVC:DXY currently closing the week at 103.4 level,
looking for short-term weakness next week to correct a bit from the Rally starting
from 99.6 to 103.
Next Resistances to look out for ;
- previous Macro LH @104.7
- Range's Ceiling 105.9
- Strong Resistance level at Macro Fibbonacci taken from 114 High to 100.8 Range Low
(0.618 Golden Zone @ 106.1)
Clearing these upcoming Resistances,
would put TVC:DXY clear bullish territory for the rest of 2023 and 2024.
Trouble times ahead for Financial Markets in this case scenario,
especially when combined with the Chinese Real-Estate Panic that just started on Friday with
Evergrande declaring bankruptcy
TRADE SAFE !
*** Note that this is not Financial Advice .
Please do your own research and consult your own Financial Advisor
before partaking on any Trading Activity based solely on this Idea !

$DXY - Headed South (97) - The Dollar Index TVC:DXY is trading below many resistances
(broken big range of 100.8-105 ; trendline resistance from 114 High; 20-50EMA)
In the short term TVC:DXY seems to be gravitating towards downside, with a completion
of macro correction ABC Waves, with C wave probably ending at 97 macro S/R
resistance area.
This critical macro S/R is quite likely the next stop for TVC:DXY to find some floor of
Support to bounce greatly.
With TVC:DXY headed South at 97, other Financial Markets Sectors will perform great
in gains, so would Bitcoin and other cryptocurrencies
TRADE SAFE !
*** Note that this is not Financial Advice.
Please do your own research and consult your own Financial Advisor before partaking
on any trading activity based solely on this Idea.

$DXY -Middle Range Warzone (105vs100)- TVC:DXY seems to be wanting a break-out from Resistance Trendline
coming from 114 Highs, despite failing to do so.
A Resistance Trendline that has pushed the price lower each time price has approached it.
Wether that break-out and resumption is bound to happen or not in the short term,
it is yet to be seen.
Currently, TVC:DXY is in the midst of a Middle Range War-Zone, struggling for direction.
For now, Price-Action suggest a Lower High being printed
at 104.5 , a Lower High from 114 Downtrend.
By Breaking Structure(BoS) of the most recent Lower High (LH) 104.5
would validate the Trendline break-out and suggest
furthermore uptrend continuation for TVC:DXY ,
headed for the the Range's Ceiling at 105.8 and testing the broken
macro structure Support Trendline
Move towards 105.8 range's ceiling would be quite bearish for overall Financial Market's
condition.
While a move to the range's bottom at 100 level would be quite promising for other Market Sectors
to continue performing well.
Very interesting week ahead for The Markets, especially TVC:DXY ,
which dictates Financial Markets Swings
*** TRADE SAFE
NOTE that this is not Financial Advice .
Please do your own Research before partaking on any Trading Activities
based solely on this Idea.

$DJIA -Awaiting Apex's End (break-out)
- AMEX:DJIA has managed to raise up in price for three consecutive days.
Resulting a break-out from Neutral Triangle Pattern,
aswell Shifting Character from it's most nearest high
1:17 Risk -to- Reward Ratio call given inside on break-out day.
17% gains to be met overtime as long uptrend resumes on Market Structure.
This is very well co-dependent on whatt TVC:DXY will perform through the next interest rate hikes decision to be made.
Back to AMEX:DJIA ,
worth mentioning aswell is that DJ:DJT (Dow Jones Transportation Index) has exploded +50%.
Usually these types of impulsive moves of DJ:DJT smell trouble for AMEX:DJIA in the short term, but strong in fundementally speaking, as long price rises with DJ:DJT
.
(some sort of correction can be anticipated from the recent price action)
Safest Buy-in from here ;
re-test of broken CHoCH and Triangle's ceiling)
TRADE SAFE
*** Note that this is not Financial Advice !
Please do your own research before partaking on any trading activity based solely
on this Idea

$USD/CHF - Bottom of Range Bound *M- $USD/CHF has been trading inside a range bound from basically
since 2012.
Past two months, price action came very close to testing
the Lows of printed on January 2021 at 0.87576$
At the current Monthly Candlestick,
Price its breaking out from a Falling Wedge (bullish pattern).
Its measured move would put $USD/CHF at 0.97$
There sits a great opportunity to Buy $USD/CHF from here,
while stoploss can be adjusted in different ways depending on
your trading style and your risk appetite .
(we'll zoom in more for market structure on smaller tf)
Bounce to at least 20 & 50 EMA is highly a probable outcome,
conflicting as well with a test of the nearest S/R area.
TRADE SAFE
***NOTE that this is not Financial Advice .
Please do your own research and consult your own Financial Advisor
before partaking on any trading activity based solely on this Idea

$USD/CAD - Big Monthly Range *M(tf)$USD/CAD seen on *Monthly time-frame
Price Action seems to have Broken Structure on *M.
However, price still on Strong Supports :
- *M mid-range S/R area
- Triangle Bottom Area of Support (broken for now)
- Support Trendline from Lows
More confirmations to come The Week ahead in terms of Price Action
for the BoS situation & wether supports will hold $USD/CAD or plunge it.

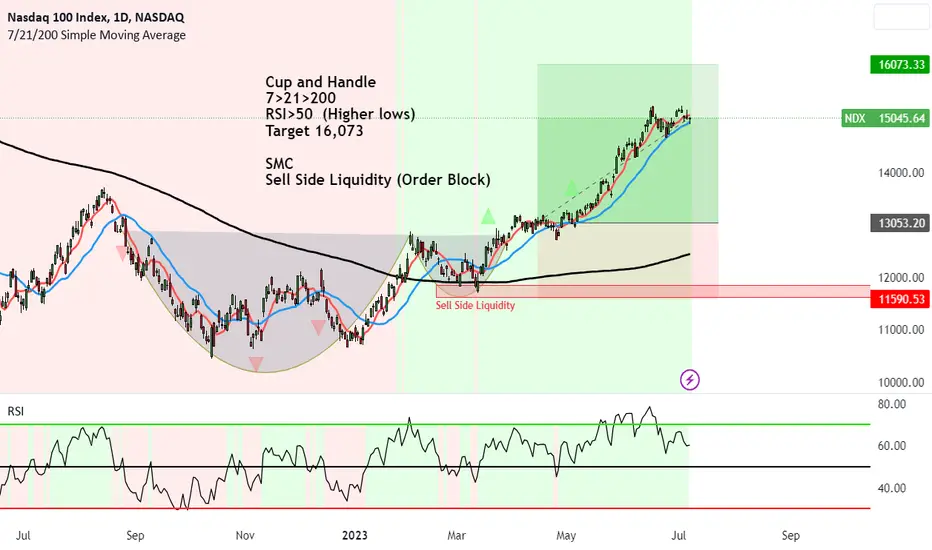
UPDATE Nasdaq is on track to new All Time HighsCup and Handle formed on Nasdaq and since then the price has rocketed up.
We still have bullish confirmation of further upside.
7>21>200
RSI>50 (Higher lows)
Target remains at 16,073
One could even lock in half profits here and raise stop to above breakeven.
Fundamentals:
With the Big 7 outperforming this year, we are seeing the innovation of AI, Metaverse and machine learning attract new investors into the market. This will help push up the price bring on higher earnings and help the economy - which diminishes the likelihood of a recession.
The Big 7 are the major tech companies:
Apple, Microsoft, Alphabet, Amazon, Nvidia, Tesla, and Meta.
And as they adapt, innovate and integrate AI into their business models, products and services, this will continue to bring investors into the market and
drive their prices up.
And this means the Nasdaq will continue to rally.
SMC
Sell Side Liquidity (Order Block)
Smart Money buys into positions (and sweeps liquidity) from traders who are long (get stopped) and for short traders who enter into their trades.
$XAU - NATH's Ahead ? LONG opportunities incoming for Gold *W (tf) (wave 5)
Wave 4 completed ?
Long Confirmation is anticipated with the red trendline resistance breakout and CHoCH's on smaller time
frames.
Current support trendline support on green and 20EMA on *W
TA speaking, Gold is sitting at a very sweet spot until the uptrend is invalidated
- Looking ahead for New All Time Highs for Gold in the midst of this troubleshooting
frenzy Economic Enviroment
US's Debt Ceiling Crisis and governments not trusting any longer The US Dollar
in their balance sheets.
Did you know that through-out 2022 and the on-going of 2023 amongst many countries,
Russia and China, two Global Superpowers,
have been stacking Gold up as their
State Reserves in heavy amounts !
Do they know something we don't !?
TRADE SAFE !
*** Note that this is not Financial Advice !
Please do your own research and consult your own Financial Advisor
before partaking on any trading activity based alone in this idea

$DXY - Bull Flag *12Hr TVC:DXY - 12Hr* Bull Flag
- TVC:DXY Bull Flag post break-out still valid and in play until Price Action nullifies it.
Breaking the Bull Flag (in green) and the Resistance Trendline (in red) coming from 114 Highs
will confirm another Macro Higher Low in $DXY.
(in play would be the macro wave C putting The Dollar Index at 96)
LH confirmation would give the other Financial Markets sectors room to explode headed to the upside,
stronger then we've seen so far for the year.
TRADE SAFE
*** NOTE that this is not Financial Advice !
Please do your own research and consult your Financial Advisor
before partaking on any trading activity based solely on this Idea .

$DXY - 'ABC' Waves Completed - The Dollar Index TVC:DXY seems to have completed Wave C of its A-B-C Elliot Waves Correction, today on ECONOMICS:USINTR Fed's announcement.
TVC:DXY must hold the lows of Wave C at 102.6 and 1 level of Fibb' Zone,
otherwise, its macro downtrend from 114 High will be printing another Bearish Lower High
This, however, would be a fantastic opportunity for The Financial Markets
to explode more on their uptrend resumptions .
TRADE SAFE
*** NOTE that this is not Financial Advice !
Please do your own research and consult your Financial Advisor
before partaking in any trading activity based solely on this Idea .

$SPX500 - Breaching Macro Golden Zone - FX:SPX500 breached through Macro Fibbonaci Golden Zone,
taken from the Highs of 4812 $ to the lows of 3489 $.
Although managing to do so, must be noted that FX:SPX500
is Dead in Volume(below average volume) and overbought in RSI .
Weekly Close in 2Days 13hrs.
Regarding it's Price Action, the overall condition of
current uptrend still intact, as long as it maintains
the support trendline and remains above HL (to have a BoS).
TRADE SAFE
*** This is not Financial Advice !
Please do your own research and consult your Financial Advisor
before partaking in any trading activity based solely on this idea

EUR/USD -Swing Trade 'Short Opportunity'- Swing Short Trade opportunity for $EUR/USD
Short trade within Ascending Triangle,
which is a Neutral Pattern that can be broken either
to Bulls or Bears.
Demand yells for lower $EUR/USD.
Even on Volume Profile ; 4Hr* (TF)
Stay Sharp !
Until the next one ..
TRADE SAFE
*** NOTE that this is not Financial Advice
Please do your own research and consult your own Financial
Advisor before partaking on any trading activity based
solely on this Idea

$DXY -Wave 'B' Completed- It seems TVC:DXY found temporary Support
on the Bullish Cross Over in the last Week,
by testing it thrice and jumping around.
Concerning is the Change of Character (CHoCH) in Wave A
of A-B-C correction ;
by violating the last
Higher High of 103.3 (where fibb is taken).
However, this may only be a small issue regarding
Higher Time Frames Uptrend.
Zones to watch the weekk ahead for TVC:DXY ;
- Support to hold at 103.3 ;
(1 Fibb' level + S/R + EMA's Area
- Wave B Continuation completion after Impulsive Wave A
*Resistance at 0.618 Fibb's Golden Zone
(or a bit Higher zooming in on Smaller TF Order Block)
- Wave C continuation putting TVC:DXY @ 102.6 fibb level and trendline

$DXY - A Big Range (100.8 - 105.9) - The Dollar Index TVC:DXY has a very interesting
short to mid term time frame ahead regarding
its Price Action and Decision Making Time ticking .
Currently TVC:DXY is bouncing around a Big Middline S/R
area of 100-106 Range.
Both 'ANIMALS' have their fair share of Case,
while for now,
Bulls are more dominant on medium term
while Bears have taken total control of short term *Hourly Time Frames
by CHoCH impulsively and having a realif bounce (completion of Wave
(Bulls) - - -> Break out & Retest + Bull Flag formation pattern post break-out
(Bears) - - - > Fakeout ; Wave C Headed Lower

$DXY -Ballads of Dollar $- Monitoring The Dollar Index TVC:DXY and constantly keeping an eye on its Price Action packed with Stories to Tell ,
is very important in your Trading Journey.
TVC:DXY its ;
The best Strategy,
the best Signal
the best Indicator
Why ?
Because it's a Dollar Story !
As the phrase goes :
'Paper Rules the World'
And so it does,
to the average man working 9-5 having no aspiration to know the dark valleys of this World.
And so it does,
regarding us that are involved in Trading Financial Markets.
While the most valuable of fiat currencies out there is The Mighty Dirty Dollar to whom the whole Economic System is based upon,
it's a must to be diligent and vigilant over The Dollar Index's TVC:DXY
price action stories.
TRADE SAFE
*** This is not Financial Advice !
Please do your own research and consult your Financial Advisor
before partaking in any trading activity based solely on this idea

$DJIA -Awaiting Apex's End *2WBig Move incoming for Dow Jones Industrial Average.
AMEX:DJIA has created Triangle's Apex approaching the end .
Note that this is a Neutral Pattern, it can go each ways ;
Bearish and Bullish.
(depending on TVC:DXY , Geo-Politics & Macro Economics conditions)
For now, it's better to observe and stay sharp and await for further confirmations.
Nothing is clear yet TA speaking for AMEX:DJIA
AMEX:DJIA is one of the Heaviest Financial Sector for United States.
That being said,
it is very important to always have a lookout of its Price Action
and Trends Directions for further clarification of how other US Financial Sectors
will perform.
A Change of Charachter would definetely bring more clarification of reaching levels
of ATH or LOW
At the time of this idea being released price is finding some support at S/R
zone and 20-50EMA over maintaining their bullish crossover.
For now, it's better to observe and stay sharp and await for further confirmations.
Nothing is clear yet TA speaking for AMEX:DJIA , as well taking in to consideration
The Debt Ceiling decision that is yet to take place.
TRADE SAFE
***
Note that this is not Financial Advice !
Please do your own research and consult your Financial Advisor before partaking
any trading related activities based soly on this idea.

DOWJNESbreak renge . wait for pullback
come to breakeven 2-last renge
next pullback go to high renge
