America


Positive naz band Length Positive rise from may 2020, transitions from trump to Biden with new laws and restrictions, we should see a negative shelf in the near future. However it is a good test for Americans economic resilience. Any other ideas or opinions welcome !

A trivial analysisIt's very simple, break the trends and support and resistance and Fibonacci numbers. But I think the market is bullish because of crossing the Fibonacci gold range. Up to specified limits

DXY 6H - EOY Bullish MoveFollowing my Daily chart on this chart:
This intraday fib adds up to see a push up to 93.5 before we get an idea on who tf won this election, Jan 20th.
From there I would expect the $ to continue crashing, just an idea.
I would not trade this as it is going against a heavy downtrend since March though it is good to add it as a confluence to other pairs.
If this bullishness holds up this week I would like to see it continue for the first weeks in January.
See how the year ends...


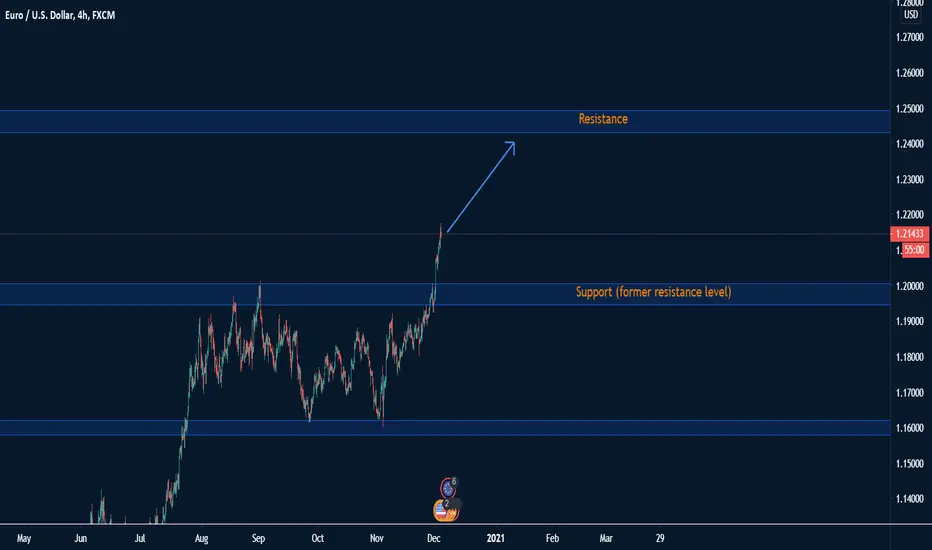
EURUSD is growing like a weedEURUSD broke the former resistance level (current support level). As you can see, the Euro is heading towards the next resistance. Our target is 1.243. At the moment, it is a BUY from me.
$AAL Daily Chart flashing Eye Spy a Squeezing chart again on AAL play that last pop up and had good returns thinking its about that time of the year. Lets see if we can get another spike in the coming months.

EUR/USD analysisWe have to wait a little longer until we see if the market manages to break the resistance level.

GBP/USDit break the up channel and it could follow the arrows to the support zone ...
follow for daily signals

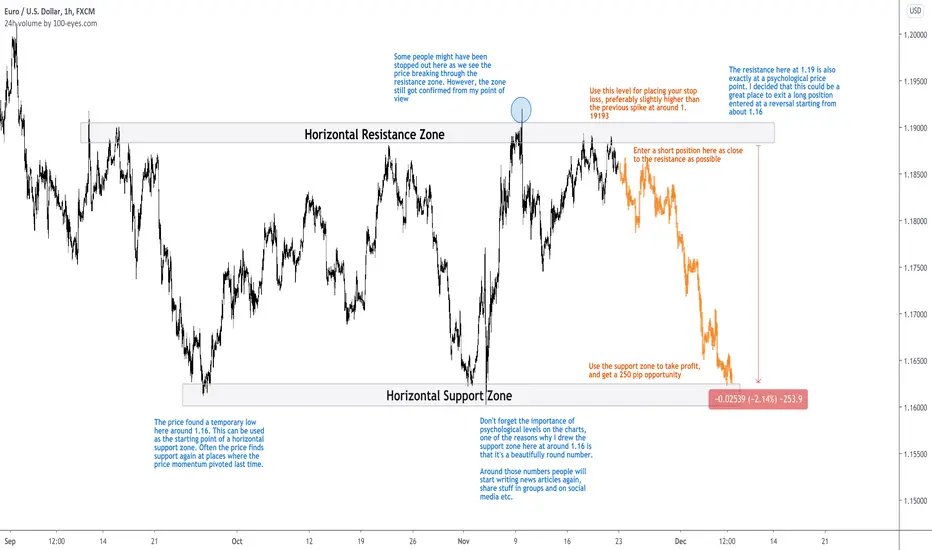
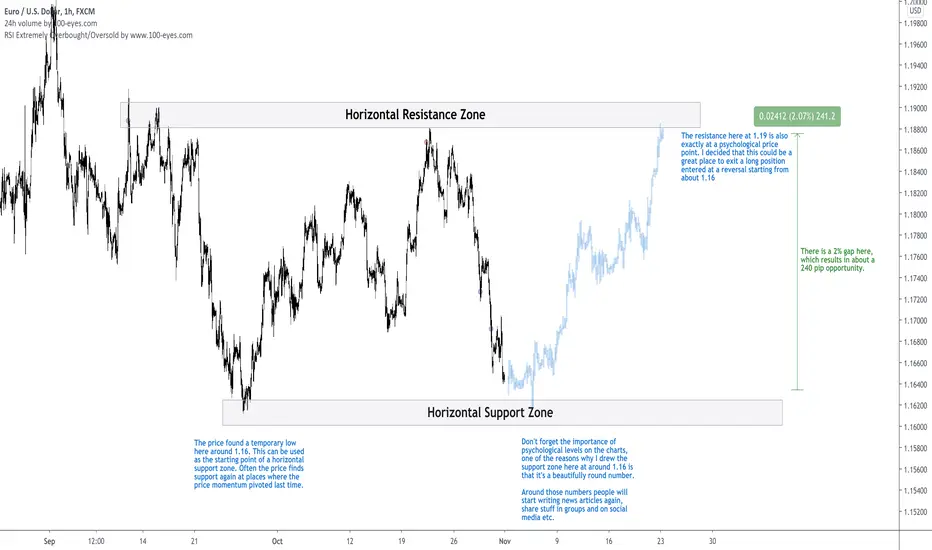
EUR/USD Moving On From Two Successful Trades - SHORT PositionIn this technical analysis I will walk you through the most important horizontal zones on EUR/USD at the moment that have given us great profits so far.
If you recall, the first trade using smaller horizontal zones resulted in a beautiful short as displayed in this idea
In combination with the weekday weekend effect, the price reversed beautifully. We are also entering a new week now so I expect a similar reversal to happen due to weekday weekend effect in confluence with the horizontal zone.
Then, we had a subsequent beautiful trade with the same horizontal zones as the idea I am posting now on the previous idea here with a long position
This just worked out beautifully. I intend to use these zones one more time for a trade that makes use of the scenario where the zones still hold. If it does, we're looking at a 250 pip opportunity here with great risk reward.
I tried to make the chart as self-explanatory as possible. In case you still have any questions, free free to leave a comment or send me a personal message.
-Trading-guru
2020 US Election Indicator (November 3rd 2020)November 3rd 2020 USA Presidential Election (S&P 500 Incumbent Winner Indication)
Alright, it's time for the showdown! It's finally November 3rd 2020 and we find out more tonight!
Will the S&P 500 close over 3288.3 points today? If it does, it should be expected that Trump is the winner of the 2020 USA presidential election, but if we sink below 3288.3 then there is a chance that Biden wins.
My original forecast for the election before seeing any of this data was for a Trump win as well, so it just feels like everything has come together to signal his win even if last minute. Considering polling and contrarian indication, Cindicator's hybrid artificial intelligence projecting a 60% chance of a Trump win, failed impeachment, and all the October email scandals since 2016, I am under full belief Trump will win, even if by a close measure.
This is an election indicator that has been historically accurate 20 out of 23 previous election analyses. I've been seeing some articles that say Biden is signaled to win because of the downtrend we had over the past few weeks, but that was before a few days ago when we hit a trend reversal, and started pulling back over August 3rd 2020 S&P 500 levels.
In 2016, the S&P 500 dropped -4.79% over the 3 month period from the open of August 3rd 2016 to market close of November 3rd 2016. As of right now about an hour before market close, we have reached a high of 3.08% since August 3rd 2020, and we are still in the positive above the 3288.3 points. We could end in the next hour around 3360-3370 points, and that would be an incumbent win as per the election indicator rules.
Thanks for tuning in :) Disclaimer, anyone in the trade needs to do their own due diligence and decide what is right for YOU. My charts can be wrong at any time and it's very important that you have your own strategies and plans in place. I run this channel for my own educational purposes of learning to trade, and I will never be 100% right, so please do not let me confirm any bias for you! (Dangerous to do so, stay safe and remember the basics & rules of risk assessment.) Expect the unexpected and happy trading!

This 544 Pip Opportunity Is Backed Up By Confluence!In this idea on GBP/USD we find confluence of two major chart patterns. A supporting trend line and a horizontal support zone.
In trading, the presence of confluence refers to a circumstance where multiple technical analysis factors collectively form the same indication. Since multiple factors are combined, confluence has the potential to greatly increase the reliability and accuracy of trades. Arguably confluence is the most important probability enhancer in trading.
The support zone is created due to the S/R flip. Besides buying at support and selling at resistance, the ”Support/Resistance Flip” principle provides reliable entry opportunities. Although supports and resistances are likely to hold, they do not always hold.
After a support or resistance is broken, the level remains useful. This is due to the general trading rule that a broken support becomes resistance, and a broken resistance becomes support. In other words, once a broken resistance level gets retested, it tends to act as support. This concept is particularly reliable when a support or resistance level breaks on high volume.
Together, this marks a very high probability reversal point. I see a great potential here for a 544 pip trade set-up.
Follow me for consistent high quality updates, with clear explanations and charts.
Please like this post to support me.
- Trading Guru
--------------------------------------------------------------
Disclaimer!
This post does not provide financial advice. It is for educational purposes only!

USD/CAD Shows Signs of Confirmation on Horizontal SupportIn this idea I explain how to leverage the S/R flip principle to find support in an area where previously resistance was found. I then use this level to suggest a long trade set-up towards the resistance trendline.

Support and Resistance - Most Important Zones for EUR/USDAll info can be found on the chart. DMs are open!
DXY Nov 2nd - Crash?If this is the retracement before the crash right after the election that would be mint, see what the week brings!

just my thoughts11 minutes ago
So, Feds have, yet again, cut, 45 minutes before closing bell. Expect a rally to resistance 3450ish, then a drop back to support and maybe beyond. There are some major contribution to this! for starters, if you look at the day clock it has already consolidated and went into expansion! Now we await the major move! Another Huge contribution is the european markets, which will not only affect europe, but the world economy, Including but not limited to S&P! Another reason is it is extremely over brought, i know we have added over a 100k retail traders, but that numbers is not realistic in any time frame or period! lol! CUTs may do nothing at this point,
Apple has also Suffered! which will also hurt!
China is seeing a slight increase in cases, and some are going back on lockdown!
China has administered over a 100,000 doses of vaccines! (no clinical trials) :(
China has also seen a increase in cases!
Last thing, Coronavirus is up more then march! don't panic, IT IS NOT TIME YET! :( :( :( :( :( :( :( :( :( :(
Only thing i will say on that pullback to 3450 is that the last wick on the 4 hour is longer than any other! so spx may be DOOMED

VIX Approximations Update (Oct 26th-Dec 2nd 2020)S&P 500 Volatility Index (VIX) (October 26th through December 2nd 2020)
Just making an update to a previous VIX forecast that I see going outside my last expected ranges, I felt it necessary when checking on SPX trends, especially with yesterday's start to a drop in E-mini futures. See below for previous guesses:
Thanks for tuning in :) Disclaimer, I am not responsible for any losses incurred while attempting to use my data, I hope this can prove to be some sort of learning tool for some and give insight as to how I personally come up with my own numbers. Take into full consideration this could be a completely bad forecast. Cheers

Descent in the SPX (October 26th-November 9th 2020)S&P 500 Index (SPX) (October 26th through November 9th 2020)
Low: 3362.9 points
High: 3455 points
How E-mini futures market started off yesterday:
My previous SPX forecast:
My adjustments today are more to correct the trajectory and duration I was originally expecting. Will be interesting to see how this spooky week turns out. Time for temporary bloodbath just before halloween? ;)
Thanks for tuning in :) Disclaimer, I am not responsible for any losses incurred while attempting to use my data, I hope this can prove to be some sort of learning tool for some and give insight as to how I personally come up with my own numbers. Take into full consideration this could be a completely bad forecast. Cheers

Fascinating Oscillation on EUR/USD Results in Price Reversal!Hi everyone, let's review some fascinating price behavior here on EUR/USD based on the weekly seasonality.
Funnily enough, I spotted this behavior last week and already provided a chart with a similar idea. I kept mentioning how the price trend reversed over the weekend and suggest a trade that went along with the trend anyway. My own chart got used against me and the price reversed beautifully according to the behavior and did not follow the trend at all.
In this idea I learn from that mistake and suggest a price reversal trend trade set-up. Every major shift in price trend has started exactly after the weekend.
We have an excellent opportunity to use this information and trade it to our advantage! If you spot the reversal soon after the week starts, you can safely place your positions and trade along with the trend until the week is over.
I suggest to wait after opening to get a confirmation of the move (again, nothing sudden is happening so you will be on time even a few hours later) and then trade according to the direction.
Follow me for consistent high quality updates, with clear explanations and charts.
Please like this post to support me.
- Trading Guru
--------------------------------------------------------------
Disclaimer!
This post does not provide financial advice. It is for educational purposes only!

USD/JPY Maximize Your Risk-Reward With This Simple Trick!In the end, what matters most in trading is risk reward ratio and win percentage. We can see here on USD/JPY some great indicators of a bearish price continuation. However, in itself that is not enough.
I suggest to maximize the risk reward ratio by waiting for the price to be closer to the top resistance line before entering with a trade. This will allow you to get a better RRR. In this trade set-up you can see from the chart how I created a 4 RRR trade idea.
Follow me for consistent high quality updates, with clear explanations and charts.
Please like this post to support me.
- Trading Guru
--------------------------------------------------------------
Disclaimer!
This post does not provide financial advice. It is for educational purposes only!

EUR/USD DAILY PICTURELook for times to accumulate on lower timeframe, as the big picture is continued uptrend.

USOIL Increased Volatility Allows For a Great Trade Set-up!All info can be found on the chart. Feel free to DM me if you have any question!
