AMGEN Nearing a Breakout—Is It Time to Act?Is AMGN on the Verge of a Major Move?
With Amgen Inc. (NASDAQ: AMGN) currently trading at $287.38, the stock is hovering close to key resistance at $294.65, a level that could dictate its next big move. Despite sitting 17% below its historical high of $346.85, AMGN has rallied significantly from its absolute low of $211.71, reflecting a 35% rebound.
Technical indicators suggest the stock is approaching a crucial inflection point. The RSI14 at 59.99 shows the stock is nearing overbought conditions but hasn't crossed the threshold yet, while the MFI at 64.63 hints at strong money flow. Moving averages are aligned bullishly, with MA50 at $283.00, MA100 at $279.02, and MA200 at $272.19, all supporting the uptrend.
However, recent "Sell Volumes Take Over" patterns indicate increased selling pressure near highs, creating potential short-term volatility. Will buyers absorb the selling and push AMGN through resistance, or is the stock setting up for a reversal? With macroeconomic uncertainty and biotech sector sentiment playing a role, this could be a make-or-break moment for AMGN traders and investors.
The big question—are you positioned for what’s next?
AMGN Price Roadmap: Decoding Market Moves Step by Step
Tracking AMGN’s price action through pattern recognition gives traders an edge in predicting potential moves. Let’s break down the most relevant patterns that played out successfully, confirming their main direction.
1. January 27, 2025 - Buy Volumes Take Over (Sell Direction Ignored)
Price opened and closed at $282, but despite a 6.35% range, the bearish move wasn't confirmed. Instead, we saw an influx of Buy Volumes Max just hours later, setting the stage for an upward move.
2. January 28, 2025 - Increased Buy Volumes (Confirmed Uptrend)
The Buy Volumes Max pattern held strong, with price climbing to a high of $283.22 before consolidating. This confirmed that the previous sell pattern failed, while buyers took control.
3. January 31, 2025 - Sell Volumes Take Over (Bearish Shift Confirmed)
Price action showed heavy selling pressure, with a range of $285.42 - $287.11. The next pattern, Increased Sell Volumes, validated the bearish momentum, confirming a 4.71% decline shortly after.
4. February 1, 2025 - Increased Sell Volumes (Downtrend Holds)
The continuation of high sell volumes pushed AMGN down to $284.92, confirming a successful transition from the previous Sell Volumes Takeover pattern. Traders caught in longs at resistance likely got shaken out, while aggressive sellers dominated the flow.
What’s Next?
With AMGN testing key resistance near $287, the next pattern will be crucial. A break above resistance could invalidate the current bearish structure, while a failure to hold recent highs could send price back toward the $280 zone. Watch the order flow carefully—the next move could be explosive.
Technical & Price Action Analysis: Key Levels to Watch
In trading, levels are everything. If a support doesn’t hold, it flips into resistance—same story in reverse. Here’s what we’re watching right now on AMGN:
Support Levels to Catch a Bid
259.29 – First real demand zone; buyers need to step in here.
252.45 – If this level doesn’t hold, expect liquidity grabs below.
251.47 – Close to the danger zone, where panic selling could accelerate.
248.56 – Bulls’ last line of defense before a major flush.
231.50 – If we see this, something bigger is at play.
Resistance Levels That Must Break for Upside
294.65 – First stop for any real breakout traders.
300.00 – Psychological round number, algos are watching.
318.54 – Mid-term target if we get momentum.
328.35 – A key pivot for long-term positioning.
330.92 – Break above here, and we’re in new territory.
Power Levels – Where Big Money Is Positioned
Support that Must Hold:
297.91 – If lost, could act as strong resistance on retest.
325.91 – Major liquidity zone, failure here signals deep correction.
333.15 – Last line before heavy trend Trading Strategies Based on Rays: Key Scenarios & Setups
The VSA Rays mapped on the chart serve as the foundation for our trading framework. These Fibonacci-based dynamic levels define zones of interaction, where price has two choices—continue the trend or reverse. Positions should only be considered after price interaction with the rays and the confirmation of a directional move.
Each price move progresses from ray to ray, establishing first, second, and third targets for trades. Moving Averages further refine these levels, acting as dynamic support and resistance zones.
📈 Optimistic Scenario: Trend Continuation & Breakout Play
If price successfully interacts with the MA50 ($283.00) and MA100 ($279.02) and bounces off a VSA ray, we are looking at a bullish continuation.
First target: $294.65 (Initial breakout zone)
Second target: $300.00 (Psychological and technical resistance)
Third target: $318.54 (Longer-term target for swing traders)
Key trigger: Confirmation above the breakout ray + moving average support. A strong close above these levels increases the probability of a trend continuation.
📉 Pessimistic Scenario: Rejection & Breakdown Play
If price interacts with $294.65 but fails to break through, then a reversal setup is in play.
First target: $259.29 (Initial support zone)
Second target: $252.45 (Key demand level)
Third target: $231.50 (Bearish exhaustion zone)
Key trigger: Rejection at resistance ray + moving average failure. If price fails to hold MA50 ($283.00) or MA100 ($279.02), it signals a deeper correction.
🔥 Trade Setups Based on Key Levels
Breakout Buy above $294.65 → Target $300.00, $318.54
Reversal Short from $294.65 → Target $283.00, $259.29
Bounce Buy from $259.29 → Target $294.65, $300.00
Sell on Breakdown below $259.29 → Target $252.45, $231.50
Resistance That Could Reject Hard:
244.25 – Hidden selling pressure waiting above.
227.79 – Institutional sell wall if price wicks up.
If these support levels get sliced through, expect them to flip into resistance, trapping weak hands and fueling the next move. Keep stops tight—this game isn’t for the faint-hearted.
🚀 Let’s Talk Trading – Drop Your Comments Below!
Markets move, but precision matters—and that’s why you should save this idea and check back later to see how price respects my levels. If you find these insights useful, hit that Boost button and let’s keep tracking the moves together! 📈
Got questions? Want to discuss a setup? Drop them in the comments—I always check and answer! And if you have a specific asset you’d like analyzed, let me know. Some ideas I can share publicly, while others we can keep private, depending on what you need.
My ray-based strategy maps out all key levels automatically, but it’s only available in Private. If you’re interested in using it, just send me a DM. Trust me, once you see how price follows the rays, you’ll never trade the same way again.
The best part? These levels work on any asset. If you want a custom markup—just say the word. Let me know which tickers you’re watching, and I’ll add them to my list for upcoming analyses. More Boosts = more priority!
And of course, if you’re new here, follow me on TradingView to stay updated on fresh ideas. Smart trading is all about being in the right place at the right time. Let’s catch these moves together! 🚀🔥
AMGN

Buyback Patterns for Swing TradingNASDAQ:AMGN shows a buyback run followed by a sell day that was instigated by market makers as buyers quickly disappeared. Remember that corporate buybacks are done by bank floor traders to add stock to their inventory so they won't take profits at the peak of the run; those are other market participants, such as market makers.
NYSE:KO is another example of a buyback run and how price moves back down after the professionals conclude their buybacks. The buybacks were announced in May this year so this stock has just started its share repurchase program.

AMGN potential buy setupReasons for bullish bias:
- Price bounced from support
- Weekly bullish candle closing at support
- 0.5 fib retracement
Entry Level (CMP): 278.40
Stop Loss Level: 264.03
Take Profit Level 1: 292.77
Take Profit Level 2: 307.14
Take Profit Level 3: Open

AMGN potential buy setupReasons for bullish bias:
- Price bounced from strong support along with 0.382 fib retracement
- Price respected trendline
- Strong bullish candles
Entry Level(CMP): 291.29
Stop Loss Level: 279.64
Take Profit Level 1: 302.94
Take Profit Level 2: Open

AMGN Amgen Options Ahead of EarningsIf you haven`t sold AMGN ahead of the HZNP buyout:
Then analyzing the options chain and the chart patterns of AMGN Amgen prior to the earnings report this week,
I would consider purchasing the $322.5 strike price Calls with
an expiration date of 2024-2-9,
for a premium of approximately $6.60.
If these options prove to be profitable prior to the earnings release, I would sell at least half of them.

🔬💊 Amgen Innovations & Strategic Moves 🚀🌟 Lumakras Breakthrough:
Amgen (AMGN) pioneers cancer treatment with Lumakras, the first medication targeting a mutation found in approximately 13% of lung cancer patients.
💰 Strategic Acquisition:
Amgen acquires Horizon Therapeutics for a substantial $28 billion in cash.
Incorporates Tepezza, an FDA-approved medicine for thyroid eye disease, into Amgen's product portfolio.
📈 Market Outlook:
Bullish stance on AMGN suggests support levels above $260.00-$265.00.
Anticipated upside target in the range of $360.00-$365.00.
Exciting developments in biotech and strategic expansion for Amgen! 🌐💉
#AmgenInnovation #Biotech #StockMarket 📰📊

Stock of the Month: Vertex (VRTX)Our portfolio is up by more than 15% in the month of November. We are strictly following Mark Minervini's Trading Methodology. Here is a quick summary:
Mark Minervini's trading methodology, often encapsulated in his SEPA (Specific Entry Point Analysis) system, is a comprehensive approach to trading that emphasizes the importance of timing, risk management, and stock selection. Here’s a concise summary:
Trend Template: Minervini looks for stocks in a strong uptrend, using specific criteria for moving averages and price action to determine the health of the trend.
Volatility Contraction Pattern (VCP): He identifies stocks undergoing a VCP, a series of tightening price consolidations which often precede a significant breakout.
Risk Management: He sets strict stop-loss orders to limit potential losses, often using a maximum risk threshold per trade to manage overall portfolio risk.
Buy Points: Minervini waits for a proper pivot point before entering a trade, ensuring the stock is moving on high volume out of a sound base pattern.
Leadership: Preference is given to market leaders, stocks that outperform the market with strong earnings growth, sales, return on equity, and profit margins.
Market Direction: He trades in harmony with the overall market direction, increasing exposure during bull markets and preserving capital during bear markets.
By focusing on these key principles, Minervini aims to capture significant trends, minimize losses, and compound gains efficiently. Remember, this strategy requires discipline, continuous learning, and the ability to adapt to changing market conditions.
Stock of the Month November: Vertex
Detailed Technical Analysis
Price and Moving Averages : The price of VRTX has recently experienced a bullish breakout. It is trading above all key moving averages (MA), including the 50-day, 100-day, and 200-day MAs, which are aligned in ascending order—a bullish signal known as a 'golden cross'. The 50-day MA is often used as a short-term trend indicator, and its position above the longer-term MAs suggests a strong upward trend.
Volume : There's a noticeable increase in volume accompanying the price rise, which is a positive sign as it indicates strong buying interest.
Moving Average Convergence Divergence (MACD): The MACD line is above the signal line and above zero, which is bullish. The histogram is showing increasing momentum to the upside.
Relative Strength Index (RSI): The RSI is above 70, which typically indicates overbought conditions. However, in strong trends, the RSI can remain overbought for extended periods.
IBD Ratings: The IBD (Investor's Business Daily) ratings show a high relative strength rating of 93, suggesting that the stock is outperforming 93% of all other stocks in terms of price performance.
Bollinger Bands: The price has moved towards the upper Bollinger Band, which could signal that the stock is overextended in the short term.
Support and Resistance: The chart shows previous resistance around the $360 level, which appears to have been decisively breached and may now serve as support.
Candlestick Analysis: The recent candlesticks show strong bullish bodies, which confirms the buyers' control.
Price Targets: If you're using chart patterns for price targets, the recent breakout suggests a continuation of the uptrend.
Potential Risks: The overbought RSI readings could indicate a potential pullback or consolidation in the near term. Additionally, the elevated volume on up days should be monitored to ensure it doesn't start declining, which could signal a weakening trend.
Here is a link top our updated portfolio:
www.tradingview.com

AMGN Amgen Options Ahead of Earnings If you haven`t sold AMGN on the HZNP deal:
Then analyzing the options chain and the chart patterns of AMGN Amgen prior to the earnings report this week,
I would consider purchasing the 262.5usd strike price Puts with
an expiration date of 2023-11-17,
for a premium of approximately $8.15.
If these options prove to be profitable prior to the earnings release, I would sell at least half of them.
Looking forward to read your opinion about it.

AMGEN is exploding upwardsAmgen / AMGN is having an incredible price jump on a 1day MACD Buy Cross.
Inside this long term Channel Up pattern, the stock isn't unfamiliar at all with such explosive legs upwards as the same move happened in August 4th/7th/8th.
It is a clear wedge consolidation into aggressive expansion pattern. All supported by the 1day MA50.
It is not too late to buy and target 296.80 (Resistance A).
Follow us, like the idea and leave a comment below!!

AMGEN Short-term buy signalAmgen Inc (AMGN) broke above the quick Bull Flag pattern and is targeting the top of the Channel Down pattern at 277.00. Based on the 1D MACD, this is a symmetrical bullish sequence as the one that peaked in early November. That will be a major test for the uptrend as the longer the price stays high, the easier it will form a 1D Golden Cross, the first since February 22 2023.
-------------------------------------------------------------------------------
** Please LIKE 👍, FOLLOW ✅, SHARE 🙌 and COMMENT ✍ if you enjoy this idea! Also share your ideas and charts in the comments section below! **
-------------------------------------------------------------------------------
💸💸💸💸💸💸
👇 👇 👇 👇 👇 👇

Amgen Inc. 20% ROI opportunities Amgen Inc. (AMGN) approaching significant resistance, able to absorb weekly buying pressures. From here (AMGN) can fall back to channel support, eliciting losses of 20% over the following 3-5 months. Inversely, if a settlement above this resistance level occurs, (AMGN) would be placed into a buy signal where gains of 20% would be expected over the following 5-6 months.

$NDX looks good, better than $DJIRecently we made a post on how $NDX would outperform $DJI being it lacked #banks & #oil & it has done this.
As we have stated for some time, we're still CAUTIOUS BULL on the #stockmarket. Even after this latest fiasco.
CAUTIOUS is the key word.
Daily $NDX broke channel to upside AND longer term downtrend!!!!!!!!!!!!!!!!!!!!
Weekly chart shows #NDX holding above the weekly moving avg's & there was a bullish moving avg crossover, yellow circle, & has held.
12900 is an important level for #NASDAQ 100. Breaks that 13700 is next target.
$DJI looks okay. It held well until recently. It is close to forming a bearish crossover but we'll see. IMO likely not. While #DJI is much weaker as a whole cherry picking individual #stocks on the index should be okay. We stated $MSFT $AAPL have done well & newbie $AMGN & $VZ for yield.
#msft #aapl #amgn #VZ

AMGN in the rising channelOn this chart the price is in a clear rising channel: lower band is acting as support and upper band is acting as resistance. At this time the price is going down, but it's still in the mid of the range. So the best thing to do is to wait for the price to hit the support in order to enter a long position.
Target/take profit is displayed on the chart (295,87)

AMGN Amgen to buy HZNP for $27.8 BillionAMGN Amgen to buy HZNP Horizon Therapeutics for about $27.8 billion.
This huge spend could trigger a selloff in AMGN Amgen stock after earnings.
It`s speculative, but looking at the AMGN Amgen options chain ahead of earnings , I would buy the $240 strike price Puts with
2023-2-17 expiration date for about
$2.75 premium.
If the options turn out to be profitable Before the earnings release, I would sell at least 50%.
Looking forward to read your opinion about it.


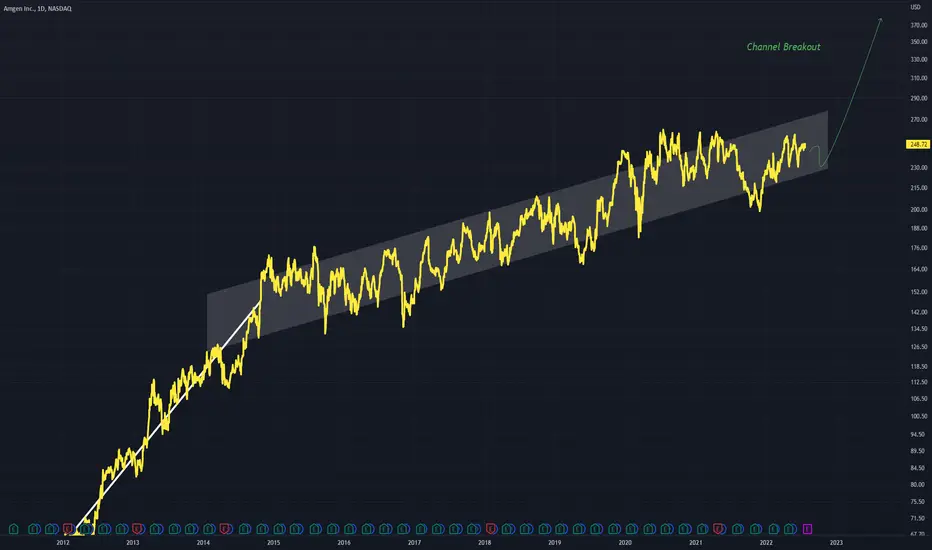
AMGN - Channel Breakout For a long period of time price on AMGN has been within an ascending channel
This channel could be viewed as a flag of a bullflag, but we will just assume its only an ascending channel .
A breakout higher out of the channel is required to continue the bull trend
$AMGN reversal looks nice #sss50percentrule possible2d2u on the week and making it to the target will trigger the 50% rule on the month. This may be a nice swing if it can hold and keep pushing.

$AMGN watch for break of the 240 zoneSellers have been present in Amgen , keeping this stock under the 240 zone since FEB's pop.
Lot of dark pool and call option flow showing bullish signs as the stock continues consolidating and eating away supply.
I think the bulls win here, alarm it for $240 as a good long idea.
I'm in a starter JAN 275c looking to add more positions upon breakout
Conversely , if bulls fail to capitalize downside target would be 220 zone.

$AMGN LONG IDEA$AMGN is one of my favorite bio tech stocks as it has solidified its place as a winner over the years. They had a bit of a slowdown and consolidation over the past few years as they didn't have as much involvement with COVID, but certainly didn't lose too much value.
Watch for a 4hr close above $241.50 to send us back to $260+ over next few weeks.

Amgn analise wyckoffon this entry we have a distribution phase now we see a support point which confirmed the testing of the climactic movement

Biotech in bearish trend50sma has been an important moving average for this ETF.
We see 3 consecutive tests of the 50sma as resistance and a bounce lower.
As we see lower highs and lower lows, the bearish trend is confirmed.
I expect we fail again and test the blue line ($144.5).

AMGN has a nice setupAMGN looks ready to rip. Bullish crossover on the Stochastic, Super Trend is green and price closed above the 200 EMA. Looking for $230+ this week.

AMGN with nice setupHi Traders,
AMGN fell after Q2 Earnings back in August and entered a downtrend down to ~200 USD. With this, it entered a strong area of support (ATH of 2018, low of Oct. 2020).
AMGN then broke downward trend but then get capped by resistance at 210 USD and retestet downward trendline from above.
By the end of October just before earnings it started to move up with significant increase in volume. This weeks retest of supportlevel at 210 USD was perfectly in line with fib levels.
So by now the short term trend tends to be upwards, we have retestet trendline and support level and earnings behind us. Maybe ex-date can ruin this setup, but to be safe, an entry could also be done after passing last high at 219.26 USD. SL slighty under supportlevel of 210 USD.
First target is trendline and maybe ATH.
Cheers
