Time to sell AMZN Stock The AMZN stock is still in the uptrend but has put up a number of patterns to sell.
Pattern:
Deep Crab on H4
Strong resistance at 187
H4 has a double top with divergence.
AMZN

Amazon at ATH $188Hello Traders, Skyboxpips here
Amazon has been in a bullish trend and is near the $188 level with great bullish momentum.
We can anticipate Amazon reacting to the $188 level by a false breakout then sell to the short-side or a break and retest to the buyside.
I

AMAZON: Bullish continuation to 210.Amazon is bullish on its 1D timeframe (RSI = 67.557, MACD = 2.990, ADX = 31.700) as it is unfolding a very stable uptrend supported by the 1D MA50. This is the second bullish wave of the Channel Up, that is the dominant long term pattern. The 1D MACD suggests that we are entering the final phase of this wave that is aiming for a HH at +78.73% from the HL. We are bullish (TP = 210.00).
See how our prior idea has worked out:
## If you like our free content follow our profile to get more daily ideas. ##
## Comments and likes are greatly appreciated. ##

Good time to invest in AMZN stocksWeekly AMZN chart looks great, possibly a 55% upside in the next few months. I'll follow it for sure and a great time to invest and stock up on Amazon.

Amazon's Billion-Dollar: Anthropic Investment Fuels AI Arms RaceAmazon's foray into the realm of artificial intelligence has reached unprecedented heights with its monumental investment in Anthropic, a San Francisco-based startup pioneering generative AI technology. With a staggering $2.75 billion injection, Amazon ( NASDAQ:AMZN ) solidifies its commitment to staying ahead in the AI arms race, marking its largest venture investment to date. This strategic move underscores the escalating competition among tech giants to harness the transformative power of AI and secure their positions in the rapidly evolving technological landscape.
Amazon's Strategic Maneuver:
By doubling down on its investment in Anthropic, Amazon ( NASDAQ:AMZN ) demonstrates its strategic foresight in identifying and capitalizing on emerging technologies with disruptive potential. Anthropic's cutting-edge AI capabilities, including its foundation model and chatbot Claude, position it as a formidable contender in the AI landscape, challenging established players like OpenAI and ChatGPT. Amazon's substantial backing not only enhances Anthropic's resources for research and development but also strengthens its competitive edge in driving advancements in generative AI.
Implications for AI Innovation:
The infusion of billions of dollars into Anthropic reflects the growing significance of AI as a transformative force across industries. With Anthropic's groundbreaking AI models outperforming industry benchmarks and setting new standards for performance and capability, the potential for innovation in areas such as language processing, reasoning, and multimedia analysis is immense. Amazon's strategic collaboration with Anthropic is poised to accelerate the pace of AI innovation and unlock new possibilities for enhancing customer experiences and driving business outcomes.
Tech Giants' Spending Blitz:
Amazon's blockbuster investment in Anthropic is part of a broader trend of heightened investment activity among cloud providers and tech giants in the AI space. As competition intensifies, companies like Microsoft, Google, and Salesforce are also making significant investments in AI startups to bolster their AI capabilities and expand their market reach. This spending blitz underscores the pivotal role of AI in shaping the future of technology and underscores the strategic imperative for companies to stay at the forefront of AI innovation.
Regulatory Scrutiny and Ethical Considerations:
While the surge in AI investments signals a growing appetite for innovation, it also raises important questions regarding regulatory oversight and ethical considerations. Concerns about antitrust issues, revenue reporting practices, and the potential for misleading investors have prompted regulatory scrutiny, including inquiries by the U.S. Federal Trade Commission. As AI continues to reshape industries and societies, stakeholders must navigate complex ethical and regulatory landscapes to ensure responsible and equitable AI development and deployment.

✅AMAZON POTENTIAL SHORT🔥
✅AMAZON will soon retest a key resistance level of 188.92$
So I think that the pair will make a pullback
And go down to retest the demand level below at 174.16$
SHORT🔥
✅Like and subscribe to never miss a new idea!✅

AMAZON BULLISH BREAKOUT ON CONSOLIDATIONAmazon just confirmed a bullish breakout on the identified minor resistance level created with the consolidation zone. Expecting a move back up towards the previous high created.

Amazon Rally or Crash: Decision Point Approaching!For Amazon, we're currently at a critical juncture with two potential scenarios:
Scenario 1 - Uptrend: This scenario suggests that Amazon has completed a five-wave cycle, finishing Wave I in September 2020, and concluded the corrective phase (Wave II) by December 2022. If this is the case, we're now in Wave III, indicated by a five-wave impulse upwards, comprising a higher Wave (1) followed by a corrective Wave (2). This scenario implies that after hitting a low at $81.43, the stock is in an uptrend. The maximum extension for this uptrend, or red Wave 5, leading to a higher Wave (1), is targeted at $181.
Scenario 2 - Ongoing Correction: Alternatively, it's posited that the overarching Wave II hasn't finished yet, and only a Wave (A) of the correction has been completed so far. Here, we anticipate the formation of Wave (B) shortly, to be followed by a Wave (C). The exact target of Wave (C) would depend on where Wave (B) concludes. For this scenario, the benchmarks for a potential Expanded Flat correction range between $177 (100% extension) and $214 (138% extension). Surpassing these values would negate the scenario of an incomplete Wave II, confirming that we are in Wave III.
The current chart patterns lean more towards the first scenario, indicating an uptrend and the end of Wave II at $81.43. The critical levels are thus set at $181 for confirming the uptrend, and between $177 to $214 for the alternate scenario. Breaking through these levels would clarify which phase Amazon is currently in.

AMZN Oversold - Initial LongCouple points to consider
1) RSI
2) Bullish divergence as drawn
3) Price below BB (In general price tends to print inside Bollinger Bands, usually a move below/above them will almost immediately result in the opposite move)
4) 5 oscillators flashing bullish on 3D chart
For me an easy 20-30% profit long trade. Too bad I can't be arsed to open a trading account on a broker.

AMZN's Cup and Handle forecasts bullish continuation LONGMZN on a daily chart is in the continuation phase of a cup and handle patter which started In
August 2022. Of the Magnificent 7, it has performed better than the rest with the exception of
NVDA. The cup and handle pattern suggests continuation to the price level of $ 200 which is
similar to the all-time high with 5- 8% added for inflation ( July and November 2021 in the
range of 187 ). On the reliability of a cup and handle pattern and that of a daily chart
compared with a lower time frame I will take long positions in AMZN in both AMZU EFT shares
and long dated call options for AMZN more or less ITM at $ 175.

Amazon's Zoox Robotaxis Accelerate Towards Autonomous FutureIn the race towards autonomous driving supremacy, Amazon's self-driving car unit, Zoox, is making significant strides to enhance its capabilities and expand its testing footprint. With plans to drive faster, farther, and even at night in Las Vegas, Zoox is positioning itself to compete with rivals like Waymo and General Motors' Cruise. These developments underscore the relentless pursuit of innovation in the realm of self-driving technology and the quest to redefine transportation as we know it.
Zoox's Ambitious Expansion:
Announced recently, Zoox's expansion plans in California and Nevada signal a bold step forward in its quest for autonomy. The company aims to increase the testing parameters for its fleet of uniquely designed vehicles, allowing them to operate at higher speeds of up to 45 miles per hour. Additionally, Zoox is extending its testing territory in Las Vegas to five miles, exposing its robotaxis to more diverse and challenging driving conditions than ever before.
Embracing Nighttime Driving and Adverse Weather:
In a bid to gather comprehensive data and enhance the robustness of its autonomous systems, Zoox is venturing into nighttime driving and light rain conditions. This strategic move underscores the company's commitment to addressing real-world challenges and fine-tuning its technology to operate seamlessly in various environmental scenarios.
The Pursuit of Full Autonomy:
Like its competitors, Zoox aspires to achieve full autonomy, envisioning a future where human drivers are replaced by self-driving vehicles. While the timeline for this transition remains uncertain, the advancements made by Zoox in expanding testing capabilities and refining its technology bring this vision closer to reality.
Navigating Regulatory Challenges:
While the promise of autonomous driving is tantalizing, regulatory hurdles remain a significant barrier to widespread adoption. The halting of testing by General Motors' Cruise following regulatory scrutiny serves as a stark reminder of the challenges inherent in navigating the regulatory landscape. Nevertheless, companies like Zoox are undeterred, pressing forward with their innovation agenda while ensuring compliance with regulatory requirements.
Amazon's Strategic Acquisition:
Amazon's acquisition of Zoox in 2020 for over $1 billion sparked speculation about the tech giant's intentions, including the possibility of using the autonomous vehicles for delivery purposes. While Zoox has yet to unveil its long-term plans beyond robotaxis, the acquisition underscores Amazon's strategic vision and its commitment to revolutionizing the future of transportation.
Conclusion:
As Zoox accelerates towards a future of autonomy, the trajectory of self-driving technology continues to evolve rapidly. With each milestone achieved and every challenge overcome, companies like Zoox are edging closer to realizing the transformative potential of autonomous driving. As the world eagerly anticipates the dawn of a new era in transportation, one thing is clear: the journey towards autonomy is fraught with challenges and opportunities, but the destination promises a future of safer, more efficient, and truly revolutionary transportation.
Amazon - Break And RetestHello Traders, welcome to today's analysis of Amazon.
--------
Explanation of my video analysis:
In 2020 Amazon created a beautiful triangle breakout which was followed by a +75% rally and then a -50% correction. After the correction was over, Amazon perfectly retested a confluence of support and reversed aggressively towards the upside. Considering that Amazon just rallied 100%, I am now just waiting for a retest of the structure mentioned in the analysis.
--------
I will only take a trade if all the rules of my strategy are satisfied.
Let me know in the comment section below if you have any questions.
Keep your long term vision.

W Short Trade Symmetrical Triangle Breakdown Wayfair is an e-commerce platform for furniture and home goods sold online.
It has had gradually decreasing volatility on the daily chart in a symmetrical
triangle, W is halfway between the past earnings in early February and the upcoming in
May. Price is currently also compressing inside the triangle and halfway between
the mean VWAP and the first upper VWAP as the chart shows. The analysis of a short trade
is also supported by the AI algo of Luxalgo using Gaussian Regression line analysis to forecast
the downtrend. Targets are 47.25 which is the intersection of the forecasted trend down
and the support trendline of the triangle as well as 38.65 which is the intersection of that
same trendline and the pivot low of October 2023. The stop loss is 63.9 at the immediate pivot
high. The trade is projected to be a 25% trade is equal partial profits are taken at both
targets or 28% if the first target is a 1/3 partial closure.

NVIDIA NASDAQ Topping Out Multi Year Correction IncomingNVIDIA and the whole stock market is topping out. I see a crash coming perhaps within the next month or two. NVIDIA has weekly bearish divergence on the RSI so a drop is imminent and a possible multi year downtrend as the chart shows. The valuation is over 2 trillion, thats a little ridiculous as are most valuations on these companies. This blowoff in the stock market is now the whales who bought at the bottom unloading their bags onto the new investors. I can see it in the comments. As soon as I read on a live stream that NVIDIA is going to save the world and go to 20k by some randinos, that indicates to me that its the top.
THIS BELOW IS A NEAT LITTLE READ, NOT MY OWN THIS IS BY Justin Gabriel | Feb 17, 2023
In 1929, at the height of an economic boom in America, Joseph Kennedy Sr. (father of JFK) was working as a stockbroker on Wall Street. As the story goes, Joseph was walking around when he decided to sit down for a shoeshine. While polishing his shoes, the young worker gave Joseph some of his favorite stock picks. When Joseph heard the shoeshine boy giving out stock tips, he figured the party was about to end, and it was time to get out of the market. Joseph proceeded to exit his positions in the market and bought short positions that bet on the market going down.
Shortly after that, the stock market entered a free fall. On Monday, October 28, 1929, the market dropped about 13%. The next day it fell another 12%. These became better known as Black Monday and Black Tuesday, and ushered the United States into The Great Depression.

AMZN - 1H - RISING WEDGE - SHORT ENTRYIn this chart we have observe a RISING WEDGE and we expectation it will go down after a certain level which is defined in the chart.
No Divergence Spotted

✅AMAZON SWING SHORT FROM SUPPLY AREA🔥
✅AMAZON is going up now
But a strong resistance level is ahead at 188.09
Thus I am expecting a pullback
And a move down towards the target at 167.44
SHORT🔥
✅Like and subscribe to never miss a new idea!✅

AMAZON Resistance Ahead! Sell!
Hello,Traders!
AMAZON is trading in an
Uptrend but is locally
Oversold and as the
Stock will soon retest
A horizontal resistance of 188.31$
It is likely that we will see
A local bearish correction
Sell!
Like, comment and subscribe to help us grow!
Check out other forecasts below too!

👜💼 Tapestry (TPR) - Amazon Deal and Growth Strategies! 📈💡📊 Analysis:
Amazon Deal: Tapestry's groundbreaking deal with Amazon to sell Coach bags.
Acquisition: Planned acquisition of Capri Holdings for $8.5 billion.
Revenue Growth: Record revenue and anticipated stable long-term growth.
📈 Bullish Sentiment:
Entry: Suggested entry above the $39.00-$40.00 range.
Upside Target: Aiming for an upside in the $66.00-$68.00 range.
🌐 Note: Monitor market trends and company developments! 🚀📊 #Tapestry #StockAnalysis #AmazonDeal 🛍💰

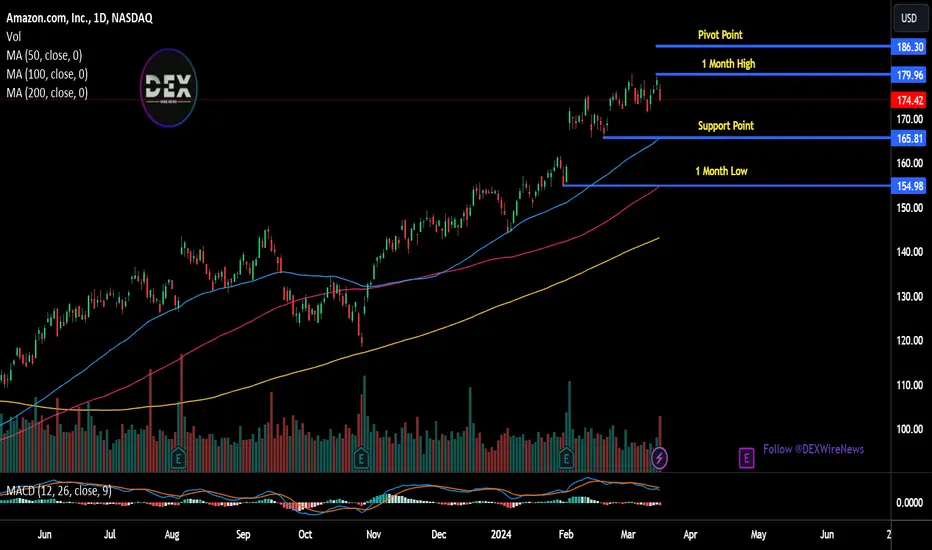
AMZN Share Price Hits 25-Month HighAMZN Share Price Hits 25-Month High After Inclusion in DJIA Index
As of February 26, Walgreens Boots Alliance (WBA) is no longer used in the calculation of the Dow Jones Industrial Average, replaced by Amazon (AMZN).
The planned index rebalancing was carried out because:
→ Walgreens shares currently have the lowest price among all companies included in the Dow index;
→ S&P Dow Jones Indices adds Amazon as it seeks to increase the Dow's retail exposure to reflect the emerging nature of the US economy. This was also influenced by the fact that shares of the retail chain Walmart (WMT) underwent a 3:1 split.
The AMZN stock chart today shows that:
→ the AMZN stock price is moving in an upward trend, its contours are indicated by a blue channel;
→ after a strong report (we wrote about this on February 5), a bullish gap formed on the chart — it is now more clearly visible between the levels of 161.5 and 166.5;
→ in the last days of winter, the price approached the upper border of the channel;
→ the price is in the upper half of the channel, and the median line (reinforced by the gap area), according to technical analysis, has the potential to provide support to it;
The inclusion of AMZN stock in the WMT Index means that the AMZN stock market may experience a short-term surge in demand (as it often does in similar cases) as various index funds will be forced to buy AMZN stock (and sell WBA) to make their portfolios match the Dow Jones Industrial Average.
However:
→ the price of AMZN today may already take into account the rebalancing that was announced earlier;
→ as you know, in 2021, Jeff Bezos actively sold his AMZN shares at a price of $180 per share. At the same time, according to annual corporate reporting, Bezos intends to sell about 50 million shares this year. This is seen as an argument holding back demand. And the bearish divergence on the RSI indicator hints at the depletion of buying pressure in the short term.
Although in the long term, taking into account the fundamentals, the market remains strong. According to the average opinion of TipRanks, analysts forecast shares AMZN = $208.23 in 12 months.
This article represents the opinion of the Companies operating under the FXOpen brand only. It is not to be construed as an offer, solicitation, or recommendation with respect to products and services provided by the Companies operating under the FXOpen brand, nor is it to be considered financial advice.

"Amazon Analysis and Potential Scenarios"Amazon's chart indicates that the region marked in red may function as a selling-oriented order block. If there is a 2-day closing above the red horizontal line, the next target could be 187.86, following the channel. In our buying zones, the horizontal line at the price of 161.73 may present a buying opportunity. 2-day closings below the green horizontal line may sequentially act as buying zones from light to dark. In the 2-day chart, levels 161.73 and Kaufman Moving Average at 162.34 are considered as significant support zones.
WARNING: THIS ANALYSIS IS NOT INVESTMENT ADVICE. CONSIDER YOUR RISK TOLERANCE AND FINANCIAL SITUATION BEFORE MAKING DECISIONS. FUTURE PERFORMANCE IS NOT GUARANTEED; THIS IS MERELY AN OPINION. INVEST PRUDENTLY AND CONDUCT THOROUGH RESEARCH.

Jeff Bezos Sells Another $2.4B in Amazon StockAccording to a new regulatory filing, Amazon founder Jeff Bezos sold more than 14 million shares over the past few days worth around $2.4 billion, completing his stock sale plan.
Bezos adopted a trading plan Nov. 8 to sell up to 50 million Amazon ( NASDAQ:AMZN ) shares — valued at more than $8 billion — during a period ending in January 2025.
He first sold 12 million shares earlier this month, worth more than $2 billion, and then sold separate 12 million share tranches through February. It’s Bezos’ first sale of the company’s stock since 2021.
Amazon’s stock closed at more than $167 per share on Tuesday. Shares are up more than 76% over the past 12 months.
Bezos controlled about 12.3% of the company’s outstanding stock as of a February 2023 proxy filing, including shares he fully owns and shares owned by his ex-wife, MacKenzie Scott, over which he still has voting rights. He now controls about 11.8% of the company’s stock.
Amazon’s ( NASDAQ:AMZN ) annual filing showed that the trading plan was adopted six days after Bezos said on Instagram, on Nov. 2, that he was leaving Seattle and making Miami his official residence.
Washington state’s capital gains tax, passed in 2021, imposes a 7% tax on any gains of more than $250,000 from the sale of stocks and bonds, with some exceptions. By making Miami his home, Bezos stands to save around $600 million in tax expenses after selling 50 million shares under the plan. Florida does not have a capital gains tax. Like Washington state, Florida also does not have an income tax.
Bezos launched a $2 billion Bezos Day One Fund in 2018 that focuses on homeless families and preschool education. The Bezos Earth Fund, launched in 2020, is putting $10 billion toward climate initiatives.

AMZN in a triangle pattern LONGAMZN on the 15 minute time frame is in a relative symmetrical triangle pattern. A volume
profile and intermediate term anchored VWAP are overlaid. They validate one another since
the POC line and the mean anchored VWAP line up. Price is below both of them. My forecast
is that price will rise and temporarily so sideways in the high volume and volatility zone
of VWAP / POC and then ascend higher as that tug o war is finalized. My long target for now
is 170.35 as the top boundary line of the high volume area of the VP. This is a good trade
for shares on margin to get some juice into the trade. I will instead take call options for
March 16th striking $ 172 for some leverage and beyond linear RIO. AMZN is good to go.
Admittedly, this is an early bird trade. I see the risk as minimal.

AMAZON -15% dip possible. Take advantage of it.It has been 3 months (Nov 17 2023, see chart below) since our last buy trade on Amazon (AMZN), which hit both Targets:
February opened with a big gap upwards and the stock has been consolidating ever since. This consolidation, along with the completion of a 1D MACD Bearish Cross last week, is indicative of a top formation. In fact it is similar with the starting sequence of the last Higher High (September 14 2023) of the 1-year Channel Up.
The first pull-back/ technical correction of this pattern was a -22.61% decline and the second -18.83%. If the corrections are on a -4% progression, we can assume a -14.60% decline this time. That falls marginally below the 0.382 Fibonacci retracement level (assuming the 2.0 Fib extension from the October 26 2023 bottom will be the peak).
As a result, we are expecting $155.00 as a fair pull-back currently and buy entry for the long-term. A break below the 1D MA50 (blue trend-line), will be the technical confirmation of the sell signal.
-------------------------------------------------------------------------------
** Please LIKE 👍, FOLLOW ✅, SHARE 🙌 and COMMENT ✍ if you enjoy this idea! Also share your ideas and charts in the comments section below! This is best way to keep it relevant, support us, keep the content here free and allow the idea to reach as many people as possible. **
-------------------------------------------------------------------------------
💸💸💸💸💸💸
👇 👇 👇 👇 👇 👇
