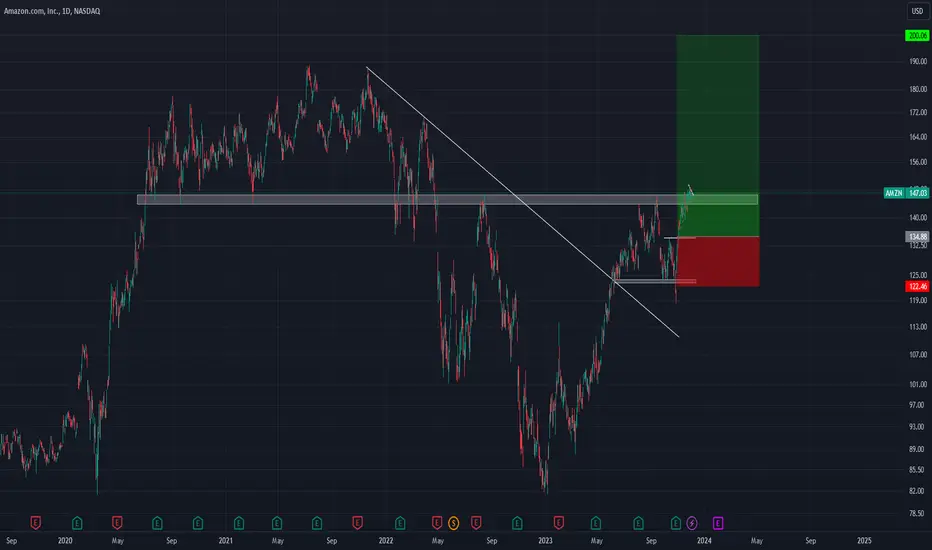
AMAZON Swing Long! Buy!
Hello,Traders!
AMAZON was retesting a
Horizontal support level
Of 143.5$ while trading
In an uptrend and now we
Are already seeing a
Bullish rebound so I think
That we will see a
Further move up
Buy!
Like, comment and subscribe to help us grow!
Check out other forecasts below too!
AMZN


Amazon Soaring: Unveiling the AI-Powered Path to Prosperity
The recent surge in Amazon's stock, propelling its founder Jeff Bezos to a staggering $3.8 billion gain in just 24 hours, reflects not only the resilience of the e-commerce giant but also the growing investor confidence in its 2024 outlook.
Market Resilience Amidst Tech Turbulence:
Despite facing headwinds alongside other major tech firms during last week's market downturn, Amazon demonstrated remarkable resilience, boasting a 2.60% increase in its shares in Todays trading session. This resilience is attributed to the optimistic outlook on Amazon's profit prospects, particularly fueled by advancements in artificial intelligence (AI).
The Power of AI Investments:
Amazon's strategic investments made during the pandemic are proving to be a catalyst for its current success. The company's commitment to AI development is paying off, with advancements in technology contributing to robust growth trends and improved profit margins. As the world becomes increasingly digitized, Amazon's proactive stance in harnessing the potential of AI positions it at the forefront of the e-commerce and technology sectors.
Cloud Business Boom:
A noteworthy factor contributing to Amazon's positive momentum is the anticipated increase in demand for its cloud business, driven by AI advancements. As businesses across the globe recognize the transformative power of AI, Amazon is well-positioned to capitalize on this trend. The company's cloud services, bolstered by AI capabilities, are expected to play a pivotal role in meeting the evolving needs of industries ranging from healthcare to finance.
Jeff Bezos: The Top Gainer:
The $3.8 billion boost in Jeff Bezos' net worth not only solidifies his status as one of the world's wealthiest individuals but also highlights his unwavering commitment to Amazon's success. Bezos, as the visionary founder, continues to steer the company toward new heights, leveraging AI and other cutting-edge technologies to secure its dominant position in the market.
Technical Analysis: A Bullish Outlook:
A closer look at Amazon's technical analysis reveals a strong development within a rising trend channel in the medium long term. This signals increasing optimism among investors and indicates a continued rise in the stock's value. The breakthrough of resistance at $145 reinforces the bullish sentiment, predicting a further ascent in the near future.
Conclusion:
Amazon's recent stock surge, coupled with Jeff Bezos' substantial gains, underscores the company's ability to weather market uncertainties and emerge stronger. As AI continues to shape the future of technology and business, Amazon's strategic investments and forward-thinking approach position it as a beacon of success in the e-commerce and cloud computing arenas. Investors and industry enthusiasts alike are eagerly watching as Amazon navigates the evolving landscape, driven by the promise of AI-powered prosperity.

Unveiling the Forces Behind $AMZN's 81% Gain in 2023
Amazon (NASDAQ: NASDAQ:AMZN ) quietly emerged as one of the standout performers, recording an impressive 81% gain in its stock value. While the spotlight was often on other tech giants like Nvidia and the AI sector's newfound fascination, Amazon's remarkable turnaround marked one of its best years on record, adding approximately $700 billion in market value.
I. Riding the Tech Stock Wave:
Amazon's surge in 2023 was not isolated but part of a broader trend in the tech industry. The Nasdaq Composite soared 43%, and the Nasdaq 100 experienced a 54% jump, reflecting the overall bullish sentiment in the sector. The "Magnificent Seven," the seven most valuable tech stocks, witnessed substantial gains, positioning Amazon right in the middle of this impressive cohort.
II. Strategic Moves and Profitability Surge:
A pivotal factor contributing to Amazon's success in 2023 was CEO Andy Jassy's strategic approach to enhance profitability. The company underwent its most extensive layoff ever, shedding around 27,000 corporate employees, and divesting experimental ventures like the Scout home delivery robot and the Amazon Care healthcare service. Additionally, several Amazon Go stores employing the "Just Walk Out" technology were closed.
These decisive actions, coupled with sustained growth in high-margin businesses like the third-party marketplace, advertising, and Amazon Web Services (AWS), led to a remarkable surge in operating margin. In the third quarter alone, operating income catapulted from $2.5 billion in the previous year to an impressive $11.2 billion. The cumulative operating income for the first three quarters of 2023 reached $23.7 billion, compared to $11.2 billion in 2022.
III. Continued Focus on Profitability:
Looking ahead to 2024, Amazon's focus on profitability remains a core strategy. Jassy's commitment to leveraging earlier investments, such as incorporating advertisements into Prime Video, signals a continued drive to boost the company's profit margins. While Amazon's current price-to-earnings ratio of 75 might seem steep by conventional metrics, the sustained potential for margin expansion justifies the valuation.
IV. AI and Future Growth:
Artificial Intelligence (AI) emerges as a pivotal growth opportunity for Amazon in 2024. The launch of the Bedrock AI hosting service and a strategic partnership with Anthropic AI, backed by a $4 billion investment, showcase Amazon's commitment to advancing in the AI landscape. Although a breakthrough in AI is not essential for continued success, it could undoubtedly amplify Amazon's growth trajectory. With competitive advantages in e-commerce and AWS, Amazon is well-positioned to thrive in the evolving tech landscape.
Conclusion:
While replicating an 81% jump in 2024 may be unlikely, Amazon's trajectory points to sustained growth. With a wide economic moat, the company has ample room to drive profits higher, supported by strategic moves, expanding margins, and an increasing focus on AI. Investors should keep a keen eye on Amazon in 2024, as the tech giant continues to navigate the ever-evolving landscape with resilience and innovation.

EOY Review $AMZN still some pivots to take out upsideNASDAQ:AMZN another bright green candle on the year
it did take out the low of previous year in Q1 by a bit
so, strat wise it's a 2 down on the year, obviously bright green
is it extended? maybe.....
but, the good thing for those with a bullish bias, still 2 previous yearly highs to take out
how strong will AMZN be in 2024? Let's see

AMZN Potential INV HSIf AMZN is able to show enough strength to break and hold above 154.36 then she can see a follow through on the current bullish momentum.

AMZN: Stock Price Ends Year Stronger Than S&P 500Amazon shares are up approximately 79% year to date in 2023, outperforming the S&P 500. This reflects the company's strong fundamentals:
→ Amazon's third-quarter results beat Wall Street estimates, helped by growth in its cloud and advertising businesses. According to Barchart, analysts are forecasting AMZN's earnings growth of 35% in fiscal 2024, as well as revenue growth of 11%.
→ Positive forecasts are associated with the activation of retail trade. In the past three months alone, the SPDR S&P Retail ETF has gained 16.4%, significantly outpacing the S&P 500's 6.8% gain over the same period, according to FactSet data. Therefore, AMZN could benefit significantly from the holiday shopping season.
→ Analysts are praising the prospects of the Prime platform, which will soon broadcast games involving 40 major league teams in baseball, basketball and hockey.
The chart shows that the AMZN stock price is moving steadily within the ascending channel (shown in blue). Wherein:
→ the price quickly rebounded from its lower border at the end of October - a sign of strong demand;
→ the price is able to stay in the upper half of the channel, using its median line as support and forming rising lows in December;
→ at the beginning of the new week, the price exceeded the psychological level of USD 150, setting a high of the year.
Now the bulls need to consolidate the progress made and keep the price above the psychological level — it is possible that we will see a test of the USD 150 level, which previously acted as resistance, therefore, there is reason to expect that it will serve as support. It is possible that the bulls will try to update the fresh high of the year.
This article represents the opinion of the Companies operating under the FXOpen brand only. It is not to be construed as an offer, solicitation, or recommendation with respect to products and services provided by the Companies operating under the FXOpen brand, nor is it to be considered financial advice.

Let AMZN Be … [ Short-term] Uhm... ohm...
I think we should leave NASDAQ:AMZN and @JeffBezos alone.
The #Amazon price has fiercely struggled in the range of 140-150 for over a month. Bulls and bears have been battling for every inch of territory, causing traffic jams, and there's not much we can do.
However, with a strong full-bodied candle last week and Bulls gradually winning small battles, my prediction is that as soon as the market opens, we will have a Gap up.
HOWEVER , this is not the time to Buy. Chasing the peak is always wrong. Just stay put, please.
The time for a beautiful Buy position might be shaking its leg, enjoying itself, has passed since the end of October.
Be patient and wait for the next opportunity.
WHAT A WISE TRADER DOES?
If you're holding a Buy position : Move the stop loss to a safe point to preserve profits.
If you're holding a Sell position : Uhm... set the stop loss carefully.
If you haven't done anything yet? Well, just continue not doing anything!

✅AMAZON WILL KEEP GROWING|LONG🚀
✅AMAZON is trading in a
Strong uptrend and we
Are seeing a bullish breakout
Of the key horizontal level
Of 145.00$ which is now
A support and we will be
Expecting a bullish move up
LONG🚀
✅Like and subscribe to never miss a new idea!✅

AMZN Analysis for XmasLooking for more upside potential on AMZN and even more with Xmas comming.
Still in a long investment position but we are now on a critical level to watch.
The $150.0 level is a very high intensity level of rejection and reversing so warning.
BUT, I have a strong conviction on this bull signals we had previously to go to the Historical High, and some can also see a reversal H&S pattern on the chart with a neck level at $150.0 precisely.
For next week, I will be looking at the little bull flag we can see near the $150.0 to see if we can confirme the curl long scenario.
Great Trades !
Amazon TA -Swing Idea - Going up?hey guys its amir whats up?
so NASDAQ:AMZN first of all its not a secret that amazon its an absolute monster company, one of the strongest of them all. So lets analyze:
- Amazon just touched a support trendline since 2018 acts as support and got bounced (also daily time frame closed hammer candlestick, ill see later how I upload to this idea more updates in different time frames)
- price touched fib 0.328 which perfectly sits on the trendline and bounced from there.
- 50 MA getting a bullish shape (not strong yet but still attempting to go bullish) and 200 ma shows a fight between bulls and bears but still the bulls are dominating.
- we see that we are getting buying pressure (bottom indicator marked by arrows and circles)
- I see that the volume in the about 6 months is actually very controlled and stable which is pretty good I mean you dont want huge spikes and flip flops keep it stable all the way the better. Since April 22 you can see in the volume that the bears were in control, watch at all the red bars and watch the drop of the stock in that area. and for the last few months they just fade away in a stable way.
// so to summerize, I do think that AMZN have great stracture, and they have more room to push forward in the coming weeks/months.
maybe to get inside the trade right now its a bit early because needed some more confirmations, but I probably will enter now because I can set my stop loss very close and if its will reach than not a big deal just cut it, and if I'll have more confirmations soon i will add more to the position.
The main TP points are : 147.73, 163.50, 177.76
for me great risk reward trade.
let me know what you think guys <3

Mega Cap ReviewApple, MSFT, NVDA, Google, AMZN, Meta, Tesla
All are showing bearish trend changes.
Will Mega caps take down the market?

AMZN December OutlookRSI trend bearish, Stochastic eyeing upside. Not much to say about direction. Blue zones indicating price gaps.

Nvidia Tesla Microsoft Google Apple Amazon Meta AnalysisNvidia Tesla Microsoft Google Apple Amazon Meta Analysis | Support & Resistance Guide
00:00 QQQ Forecast
05:46 Sp500 ETF analysis
08:03 Nvidia Stock NVDA Forecast Technical Analysis
09:23 Tesla Stock TSLA Forecast Technical Analysis
11:12 Apple Stock AAPL Forecast Technical Analysis
13:03 Amazon Stock AMZN Forecast Technical Analysis
14:00 Google Stock GOOGL Forecast Technical Analysis
15:49 Microsoft Stock MSFT Forecast Technical Analysis
17:32 Meta Forecast Technical Analysis

Why we are selling AMZN at 148The market's bull run is set to end based on the indications for seeing on the S&P.
AMZN is one of those stocks that have been quite bullish and a correction is on the card at the 150 mark. The technical indicators are:
1) Daily chart is overbought
2) H4 is overbought and lot of divergence present
3) The upward trend line has been violated which has been intact since October 23, 2023
4) There is a shark pattern in play
This will need to be held for 3-4 weeks until it hits close to 132 or there is a buy pattern. Good luck to you and may the pips be with us.

✅AMAZON SHORT FROM RESISTANCE🔥
✅AMAZON has been growing recently
And the stock seems to be locally overbought
So as the price has approached a horizontal resistance of 147$
Price fall is to be expected
SHORT🔥
✅Like and subscribe to never miss a new idea!✅

Nvidia Tesla Microsoft Google Apple Amazon Stock Analysis | SuppNvidia Tesla Microsoft Google Apple Amazon Stock Analysis | Support & Resistance Guide

$AMZN Inverse Head & Shoulders PatternThe stock of Amazon.com, Inc. ( NASDAQ:AMZN ) is currently exhibiting an inverse head and shoulders pattern, a noteworthy development in technical analysis that often signals a potential bullish reversal. For this pattern to be confirmed, it is essential for NASDAQ:AMZN to achieve and sustain a weekly close above the neckline of this formation.

AMZN - Time to LONG ?AMZN long term profit ?
A popular stock + Cup & Handle pattern + Good fundamental details + Above the average line 150. Only an idea and not a recommendation for trading!

TSLA NVDA MSFT AMZN AAPL GOOGL META Forecast00:00 QQQ Forecast
09:15 Sp500 ETF analysis
10:50 Nvidia Stock NVDA Forecast Technical Analysis
12:44 Tesla Stock TSLA Forecast Technical Analysis
14:10 Apple Stock AAPL Forecast Technical Analysis
15:49 Amazon Stock AMZN Forecast Technical Analysis
17:00 Google Stock GOOGL Forecast Technical Analysis
17:44 Microsoft Stock MSFT Forecast Technical Analysis
19:02 Meta Forecast Technical Analysis

Black Friday Buzz for AMZNThe Giant of e-commerce and AWS for small businesses, which now has AI integrated, is moving up in anticipation of a strong Black Friday for $NASDAQ:AMZN.
The new CEO who took over form Jeff Bezos is doing a good job. As the CEO of the AWS division, he did an amazing job building that division of AMZN. Outstanding CEOs make a company great. CEOs are more important than most investors realize.
Weekly Chart shows that AMZN is about 40 points from its all-time high, so plenty of opportunity for it to move up further from here. The Blue lines indicate levels where Dark Pool buy zones and Pro traders moved in most heavily. These are now strong support levels for the stock.

AMZN SHORTS $$$Hi everyone, just here to update you all on what I will be looking for in AMZN next week. Starting on the Weekly we tapped into a key FVG and took BSL many many months ago and have wicked down now near the close of friday. I Have begun looking at opening about 10% of my initial 2% risk per trade. I will add more accordingly based on Monday's opening if given the chance. now on Daily, we have a clear high and as we speak I'm looking for a lower high to confirm! And on the hourly lastly, we have clear breaks of structure in the bear's favor. I plan on holding this til the 140-136 range and scaling out accordingly! god bless and good luck ;)

AMZN SHORTSAs I stated in the picture. AMZN Is hitting a key Weekly FVG. Here i am watching for a 1H, 4H, and 1D swing high with a recent low broken to enter some put options. I will enter and take profits with PDL being taken out. These setups provide between 50-125% profit based on setup and entry. I will continue to update you all as price shoes more confirmation! Like and shoot your questions below!
