AMAZONAMZN is getting ready for another push towards 230 level.
Disclosure: We are part of Trade Nation's Influencer program and receive a monthly fee for using their TradingView charts in our analysis.
AMZN

Stock Market Forecast | TSLA NVDA AAPL AMZN META MSFTStock Market Forecast | CME_MINI:NQ1! CME_MINI:ES1! QQQ AMEX:SPY
Mag 7 Forecast | NASDAQ:TSLA NASDAQ:NVDA AAPL AMZN META MSFT GOOG

AMAZON Resistance Ahead! Sell!
Hello,Traders!
AMAZON keeps gaining
Bullish momentum so we
Are bullish biased mid-term
However it will soon hit a
Horizontal resistance of 219.00$
From where we will be expecting
A local bearish correction
Sell!
Comment and subscribe to help us grow!
Check out other forecasts below too!
Disclosure: I am part of Trade Nation's Influencer program and receive a monthly fee for using their TradingView charts in my analysis.

Stock Market Forecast | TSLA NVDA AAPL AMZN META MSFTStock Market Forecast | CME_MINI:NQ1! CME_MINI:ES1! SPY QQQ
Mag 7 Forecast | NASDAQ:TSLA NASDAQ:NVDA AAPL AMZN META MSFT GOOGL

AMAZON eyes $255 on the 3rd such buy signal in 18 months!AMAZON Inc. (AMZN) has been trading within a 18-month Bullish Megaphone pattern whose latest bottom was on the April 07 2025 Low. Since then, the pattern has started its new Bullish Leg, which has been confirmed by the break-out above its 1D MA50 (blue trend-line) and the 1W RSI's above its MA.
The previous two Bullish Legs hit at least their 3.5 Fibonacci extension levels and the 2nd Bullish was +30% more than the 1st. If the stock achieves a +60% gain from its April bottom again, it will be almost exactly on its 3.5 Fib ext.
As a result, we believe that a $255 Target (on the 3.5 Fib), is more than realistic to be achieved by September.
-------------------------------------------------------------------------------
** Please LIKE 👍, FOLLOW ✅, SHARE 🙌 and COMMENT ✍ if you enjoy this idea! Also share your ideas and charts in the comments section below! This is best way to keep it relevant, support us, keep the content here free and allow the idea to reach as many people as possible. **
-------------------------------------------------------------------------------
💸💸💸💸💸💸
👇 👇 👇 👇 👇 👇

Stock Market Forecast | TSLA NVDA AAPL AMZN META MSFT GOOGLStock Market Forecast | CME_MINI:NQ1! CME_MINI:ES1! SPY QQQ
Mag 7 Forecast | NASDAQ:TSLA NASDAQ:NVDA AAPL AMZN META MSFT GOOG

Heikin Ashi VS Regular candlesticks - EducationalNASDAQ:AMZN
Everything is explained in the video.
I hope you will find it very educational and test it. Those who trade stocks will probably switch to Heikin Ashi :)
Thank you!

$NVDA $TSLA $META $AMZN – Triangle Squeeze Incoming?📊 Symmetrical triangle formations are building across these tech giants — and volatility is compressing.
🔍 What to watch:
📈 Breakout above upper trendline = bullish momentum
📉 Breakdown below lower trendline = bearish confirmation
📉 RSI on NASDAQ:NVDA is at 73.04 = overbought warning
⚠️ NASDAQ:NVDA earnings drop May 28, could be a trigger for resolution
These coils don’t last forever. Price is building pressure — and one strong candle could break the dam.
Stay sharp, and tighten your stops.
This is where risk management matters most.
👇 Which side are you betting on — breakout or breakdown?

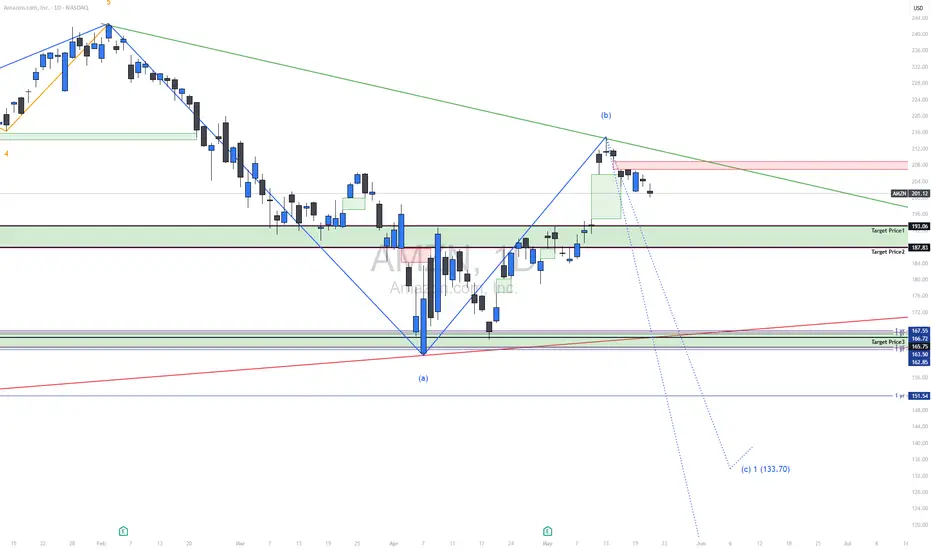
SHORT | AMZN NASDAQ:AMZN
Current Price Action:
Price: $201.12
Recent Drop: -2.95 (-1.45%)
Support and Resistance Levels:
Immediate Resistance: $208–$212 (recent rejection zone)
Immediate Support: $193.06 (Target Price 1)
Further Supports:
Target Price 2: $187.83
Target Price 3: $167.55
Target Price 4: $164.72 / $163.55
Target Price 5: $151.54
Final Wave Target (c): $133.70
Trendlines:
Green Downtrend Line: Remains respected; price rejected at confluence.
Red Long-Term Support Trendline: Still valid; could act as a structural bounce level if tested.
Recent price action shows a breakdown from the short-term bullish move, indicating possible start of wave (c) to the downside.
Wave Structure:
Completion of corrective wave (b) followed by potential impulsive wave (c) targeting lower support areas.
Elliott Wave count suggests $133.70 is a possible wave (c) extension zone under bearish pressure.
Target Prices:
Target Price 1: $193.06
This zone is a minor support where bulls may attempt a defense.
Target Price 2: $187.83
A structural level from previous consolidation and a high-probability zone for price reaction.
Target Price 3: $167.55 – $163.55
Consolidated support zone; may attract buying interest or lead to acceleration if broken.
Target Price 4: $151.54
1-year support and psychological level.
Target Price 5 / Wave (c): $133.70
If the bearish wave unfolds fully, this is the projected terminal zone.
Summary:
Amazon (AMZN) has rejected a key resistance zone and appears to be entering wave (c) of a broader correction. The structure is bearish below the downtrend line and indicates further downside. Critical support levels to watch are $193.06 and $187.83 in the short term, with deeper targets at $167.55 and possibly as low as $133.70. This correction could accelerate if key support zones are breached.
Stock Market Forecast | TSLA NVDA AAPL AMZN META MSFTStock Market Forecast | CME_MINI:NQ1! NASDAQ:QQQ AMEX:SPY CME_MINI:ES1!
Mag 7 Forecast | TSLA NVDA AAPL AMZN META MSFT GOOGL

AMZN: A Power Move for the Smart Trader | The Rebound Play?🚀 AMZN 2025 Trade Plan
After an early 2025 rally to $240+, Amazon (AMZN) has pulled back sharply to around $167, opening the door to what could be one of the most attractive rebound setups of the year.
With AWS still growing strong and net income nearly doubling in 2024, the fundamentals are on Amazon’s side. Add to that bullish analyst outlooks pointing to $226–$253 this year, and we might just be looking at a golden entry zone.
📌 Entry Points:
Start building a position at $167
Add more if it dips toward $160 or $151 (52-week low)
🎯 Profit Targets for 2025:
First stop: $210
Next: $226
Final push? $240+
This setup blends technical recovery with strong financials and long-term bullish sentiment. Patience, discipline, and solid risk management are key as AMZN finds its footing.
⚠️ Disclaimer: This is not financial advice. All trading involves risk. Always do your own research and consult with a licensed financial advisor before investing.

Amazon (AMZN) shares jump more than 7%Amazon (AMZN) shares jump more than 7%
As shown in the Amazon (AMZN) share chart, the price surged by over 7% yesterday, breaking above the key psychological level of $200 and closing at its highest point since early March.
The sharp rise in demand was driven by reports of a trade truce between the US and China following talks in Geneva. According to Reuters, the US has decided to lower the “de minimis” threshold on goods from China. This move could help de-escalate a potentially damaging trade war between the world’s two largest economies. For AMZN stock, this is a bullish signal, as Amazon sells a wide range of low-cost Chinese goods.
Technical analysis of Amazon (AMZN) shares
From a bearish perspective, the AMZN price has recovered to the 0.618 Fibonacci retracement level after falling from an all-time high to the early April low. In this context, selling pressure may re-emerge with the intention of resuming the downtrend—especially as most oscillators on the chart are signalling strong overbought conditions.
From a bullish perspective:
→ The pattern of higher highs and higher lows in late April and early May may have outlined the median of an ascending channel;
→ Yesterday’s price surge in AMZN shares may point to the channel’s upper boundary.
Given these conditions, it is reasonable to expect a minor pullback before the Amazon’s stock price resumes its upward trajectory within the blue channel.
This article represents the opinion of the Companies operating under the FXOpen brand only. It is not to be construed as an offer, solicitation, or recommendation with respect to products and services provided by the Companies operating under the FXOpen brand, nor is it to be considered financial advice.

Stock Market Forecast | TSLA NVDA AAPL AMZN META MSFTStock Market Forecast | CME_MINI:NQ1! NASDAQ:QQQ AMEX:SPY CME_MINI:ES1!
Mag 7 Forecast | NASDAQ:TSLA NASDAQ:NVDA AAPL AMZN META MSFT GOOG

Amazon - Look At This All Time High Retest!Amazon ( NASDAQ:AMZN ) will create the bottom soon:
Click chart above to see the detailed analysis👆🏻
The trend on Amazon is clearly towards the upside and the recent correction of about -30% did not change that at all. Rather, we are now witnessing an extremely bullish all time high break and retest and therefore, if Amazon actually creates bullish confirmation, this could form a bottom.
Levels to watch: $180
Keep your long term vision,
Philip (BasicTrading)

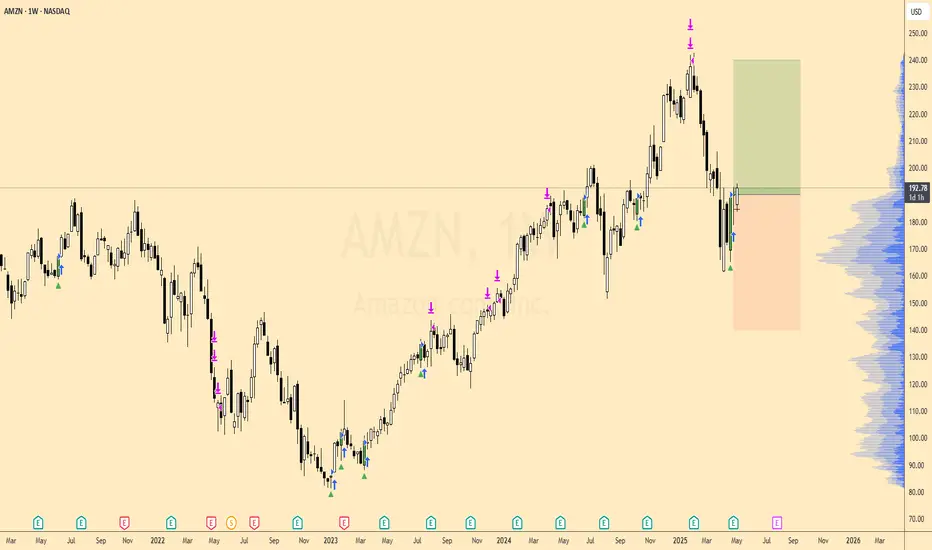
AMZN Weekly Bullish Setup - 91% Historical Win RateI’m looking to go long on Amazon (AMZN) on the weekly chart as the price that has acted this way has been a strong indicator for a swing trade in the past.
Since early 2023, AMZN has climbed from the mid-$70s to a peak above $245, carving out clear impulse moves followed by healthy pullbacks.
The current pullback has returned into the $185–195 region, which on the weekly VP shows the largest volume accumulation (HVN). Historically this zone has marked both places to buy into rallies and logical areas to defend.
We were in a 5 week range. Last week printed a bullish rejection candle (long lower wick), accompanied by my weekly “buy” arrow (green triangle). This mirrors 34 prior occurrences of the same pattern on AMZN’s weekly chart.
Targeting the $240 region, this is a 1:1 trade
Pull Back is RequiredAMZN Sell Setup - GETTEX:AMZ
Bearish Momentum on Daily Chart
Instrument: AMZN
Timeframe: Daily
Direction: Sell
Confidence: 75%
Setup Overview:
AMZN is showing bearish signals after a recent pullback. MACD has a bearish crossover, and RSI is overbought at 61.25, indicating potential for a downward move. VIX is rising, and 10-year yields are increasing, adding to market pressure. Social sentiment on X is mixed, but news sentiment leans bearish.
Trade Details:
Entry Price: $198.82
Profit Target: $182.23 (~5% downside)
Stop Loss: $205.61 (2:1 risk-reward ratio)
Position Size: 4% of portfolio
Expected Move: -5%
Key Indicators:
MACD: Bearish crossover
RSI: Overbought at 61.25
Market Context: Rising VIX, increasing 10-year yields
Follow for Best AI Signals on the market

Stock Market Forecast | TSLA NVDA AAPL AMZN META MSFTStock Market Forecast | CME_MINI:NQ1! CME_MINI:ES1! QQQ SPY SP:SPX
Mag 7 Forecast TSLA NASDAQ:NVDA AAPL AMZN META MSFT

AMZN Amazon Options Ahead of EarningsIf you haven`t bought AMZN before the previous rally:
Now analyzing the options chain and the chart patterns of AMZN Amazon prior to the earnings report this week,
I would consider purchasing the 210usd strike price Calls with
an expiration date of 2025-6-20,
for a premium of approximately $3.75.
If these options prove to be profitable prior to the earnings release, I would sell at least half of them.
Disclosure: I am part of Trade Nation's Influencer program and receive a monthly fee for using their TradingView charts in my analysis.

If you think the 2025 bottom is in you couldn't be more wrongIf you think the bottom for 2025 is in and it's only up from here let me have what you're smoking.
Just a puff, please!
About 80% of social media retail traders are confidently calling a bottom, that's a major contrarian signal.
Herding equals danger!
If everyone is bullish, most are already positioned long leaving a few buyers to push prices higher.
It's known as "pain trade" where markets often move in the direction that causes the most discomfort.
Many of loudest voices are retail traders influencers chasing engagement, not portfolio managers or data driven strategists.
AMEX:SPY SP:SPX NASDAQ:QQQ AMEX:DIA NASDAQ:META NASDAQ:NVDA NASDAQ:MSFT NASDAQ:GOOG NASDAQ:AAPL NASDAQ:AMZN

Stock Market Forecast | TSLA NVDA AAPL AMZN META MSFTStock Market Forecast | NASDAQ:QQQ AMEX:SPY
Mag 7 Forecast | NASDAQ:TSLA NASDAQ:NVDA AAPL AMZN META MSFT

AMZN Weekly Options Trade Plan 2025-04-16AMZN Weekly Analysis Summary (2025-04-16)
Below is a synthesis of all the reports and our resulting view:
──────────────────────────────────────────────
Comprehensive Summary of Each Model’s Key Points
• Grok/xAI Report – Viewed AMZN’s charts as showing a short‐term bearish bias even as some technicals (daily MACD) hint at a possible rebound. – Noted price near key supports and high put open interest. – Recommended a bearish single‐leg play: buying the $172.50 put at a premium of $0.85 (despite that premium being a bit high relative to our “ideal” range).
• Claude/Anthropic Report – Highlighted that on shorter timeframes (and with max pain at $185), some momentum and oversold conditions might create a bounce. – Emphasized bullish short‐term potential, recommending a trade on the $180 call at a premium of $0.71.
• Gemini/Google Report – Interpreted the technicals (EMAs, RSI, Bollinger Bands) as strongly bearish, with price testing a critical support level near $176. – With the options chain showing significant put volume at lower strikes, they recommended buying the $170 put (ask roughly $0.46) for its leverage and within or close to the target premium range.
• Llama/Meta Report – Also examined the multiple technical indicators and noted the mixed signals. – Although they observed bearish factors, their conclusion was cautious enough to state “NO TRADE RECOMMENDATION TODAY” if conditions aren’t optimal.
• DeepSeek Report – Concurred with the bearish outlook on both intraday and daily levels. – Recommended a trade on the $170 put (premium $0.46) with clear risk management (stop out if AMZN rallies above approximately $177.50).
────────────────────────────────────────────── 2. Areas of Agreement and Disagreement Between Models
• Agreements – Most models agree that AMZN is trading below key short‐term and longer-term EMAs, with technical momentum looking bearish. – There is a consistent theme in the options data of high put open interest and strong volume in strikes below the current price. – Several reports (Grok/xAI, Gemini/Google, DeepSeek) favor a bearish put trade based on support levels and risk/reward dynamics.
• Disagreements – The Anthropic analysis offered a moderately bullish case (with a call trade) based on oversold short‐term conditions and a max pain level high above current price. – Llama/Meta expressed enough caution so that if price action does not break expected levels, the trade might be skipped entirely. – The recommended strike/premium differs: Grok/xAI’s $172.50 put is slightly closer to the money with a higher premium, while Gemini/DeepSeek prefer the leaner $170 put (solid liquidity, premium ~ $0.46 in our target range).
────────────────────────────────────────────── 3. Clear Conclusion
Overall Market Direction Consensus: The majority of the reports lean toward a moderately bearish outlook given that AMZN’s current price is below key EMAs, near immediate support levels, and is trading in a high-volatility environment. Although there’s one bullish view (and some caution from Llama/Meta), the bearish technicals and put-side open interest weigh more heavily for a weekly option play.
Recommended Trade (if conditions are met at open): • Trade: Buy a single-leg, naked put option. • Strike: $170.00 • Expiration: April 17, 2025 • Premium: Approximately $0.46 per contract (which sits nicely near our ideal range of $0.30–$0.60) • Entry Timing: Begin at market open based on confirmed weakness below support levels • Profit Target: Approximately a 100% gain on the premium (aiming for roughly $0.90) • Stop Loss: About $0.35 (or exit if AMZN rallies decisively above roughly $177.50) • Trade Confidence: Around 65% given the technical bearish bias and clear liquidity, though mindful of the risk that a short-term bounce at support could reverse the trade.
Key Risks and Considerations: • A sudden short-term recovery (bouncing off support around $176) could trigger losses. • High volatility (indicated by the VIX) means that intraday whipsaws remain possible. • The mixed viewpoints (especially the bullish call suggestion) underscore that any entry must respect tight stop-loss discipline. • News and broader sector conditions could alter momentum unexpectedly.
────────────────────────────────────────────── 4. TRADE_DETAILS (JSON Format) { "instrument": "AMZN", "direction": "put", "strike": 170.0, "expiry": "2025-04-17", "confidence": 0.65, "profit_target": 0.90, "stop_loss": 0.35, "size": 1, "entry_price": 0.46, "entry_timing": "open" }
Disclaimer: This newsletter is not trading or investment advice but for general informational purposes only. This newsletter represents my personal opinions based on proprietary research which I am sharing publicly as my personal blog. Futures, stocks, and options trading of any kind involves a lot of risk. No guarantee of any profit whatsoever is made. In fact, you may lose everything you have. So be very careful. I guarantee no profit whatsoever, You assume the entire cost and risk of any trading or investing activities you choose to undertake. You are solely responsible for making your own investment decisions. Owners/authors of this newsletter, its representatives, its principals, its moderators, and its members, are NOT registered as securities broker-dealers or investment advisors either with the U.S. Securities and Exchange Commission, CFTC, or with any other securities/regulatory authority. Consult with a registered investment advisor, broker-dealer, and/or financial advisor. By reading and using this newsletter or any of my publications, you are agreeing to these terms. Any screenshots used here are courtesy of TradingView. I am just an end user with no affiliations with them. Information and quotes shared in this blog can be 100% wrong. Markets are risky and can go to 0 at any time. Furthermore, you will not share or copy any content in this blog as it is the authors' IP. By reading this blog, you accept these terms of conditions and acknowledge I am sharing this blog as my personal trading journal, nothing more.

AMAZON is on its 3rd historic +1000% growth Bull Cycle.Amazon (AMZN) almost has been trading within a multi-year Channel Up pattern since the Housing Bubble bottom in November 2008 and this month almost touched its 1M MA50 (blue trend-line).
With the exception of the 2008 Housing Crisis and the 2022 Inflation Crisis, which bottomed on the 1M MA100 (green trend-line), the 1M MA50 has never been broken. In fact it has been the key Support of every Bull Cycle that surprisingly has so far peaked on a +1051% rise.
As you can actually see by the 1M RSI, such corrections, like the one in the past 3 months, are quite common within the Channel Up and offer excellent long-term buy entries.
So, technically the Inflation Crisis bottom (December 2022) on the 1M MA100 has initiated Amazon's 3rd historic Bull Cycle within this pattern and based on the previous two, it may also peak after a +1051% rally inside 2028. Our projected Target on this is $900.
Would you miss out on such an opportunity in the past?
-------------------------------------------------------------------------------
** Please LIKE 👍, FOLLOW ✅, SHARE 🙌 and COMMENT ✍ if you enjoy this idea! Also share your ideas and charts in the comments section below! This is best way to keep it relevant, support us, keep the content here free and allow the idea to reach as many people as possible. **
-------------------------------------------------------------------------------
💸💸💸💸💸💸
👇 👇 👇 👇 👇 👇

TESLA BULLISH 14th April 2025Do not blindly trade anything without maanging your risk.
If market supports then I am expecting a green candle in Tesla.
Again please do not blindly trade anything ever. Hope this helps and yes I am long
