Part 2 | 7 big tech | QQQ Sp500 Price level Trend Guide- TSLA lacking bear follow through after breaking H&S
- AAPL all time high 190.37 is roughly the 3T dollar resistance hit in AH
- GOOGL still daily downtrend with MSFT
AMZN

Part 1 | 7 big tech | QQQ Sp500 Price level Trend Guide- QQQ inside bar will likely break tomorrow or Monday still no daily time frame lower high set for me unless we see a hourly downtrend confirmed.
- NVDA 3 inside bars will likely break tomorrow as well

Part 3 | 7 Big Tech Stocks | QQQ & Sp500 Price Level Trend Guide- META clear EMA 12 support
- Quadruple top but still above support need convincing bear volume to break below 277 for me to say this is a temporary top.

NVDA TSLA AAPL AMZN GOOGL MSFT | QQQ Sp500 Trend Analysis Guide- QQQ inside bar need to break yesterdays highs
- SPY hourly trend will be our guide to see if daily Lower high will be set
- NVDA stock inside bar resistance 420
- TSLA bulls likely want to re-test H&S neckline resistance
- AAPL rising wedge Resistance
- AMZN inside bar
- GOOGL still in daily downtrend
- MSFT also daily downtrend

𝗡𝗮𝘀𝗱𝗮𝗾 𝗨𝗽𝗱𝗮𝘁𝗲: $QQQ Daily. Red flag 🚩 for bearsHolding mid-bolli after an ugly candle yesterday. Red flag 🚩 for bears ATM. Another push higher for a final wave to put divergence in before a real pullback? What do you think?
$NQ_F NASDAQ:NDX NASDAQ:AAPL NASDAQ:MSFT NASDAQ:AMZN NASDAQ:META NASDAQ:GOOG NASDAQ:TSLA NASDAQ:NVDA NASDAQ:SOX $ES_F AMEX:SPY SP:SPX TVC:DXY NASDAQ:TLT TVC:TNX TVC:VIX #Stocks

6 Big Tech Stocks | $QQQ Weekly consolidation Price Trend Guide- QQQ & Sp500 weekly time frame consolidation, low of consolidation likely not set yet, need hourly trend changes back to the bulls first
- TSLA stock confirmed bear break H&S pattern
- NVDA stock broke 420 support and flushed 400 psychological support break than its 394
- AAPL EMA 12 daily and 2D still full bull control
- AMZN bull break to 52 week high lack follow through
- GOOGL continuation of daily downtrend
- MSFT joined team bear with GOOGL confirming its first daily downtrend.

Price Level Trend Guide TSLA NVDA AAPL AMZN GOOGL MSFT|Sp500 QQQ- TSLA stock forming daily H&S pattern
- NVDA stock 420 support needs to hold for bulls, bear would likely break this level if we even get a slight red day on QQQ
- AAPL 2D EMA 12 still full bull control although its starting to feel slowly at this ATH range
- AMZN nice bull break Thursday looking like its consolidating sideways
- GOOGL back into its chop zone after breaking both sides with no follow through
- QQQ daily EMA 12 support inside bar today forming EQ that will break monday
- SPY 4h H&S confirmed bear break.

TSLA NVDA AAPL AMZN GOOGL MSFT | QQQ SPY Weekly Analysis- TSLA stock forming daily H&S pattern
- NVDA stock 420 support needs to hold for bulls, bear would likely break this level if we even get a slight red day on QQQ
- AAPL 2D EMA 12 still full bull control although its starting to feel slowly at this ATH range
- AMZN nice bull break Thursday looking like its consolidating sideways
- GOOGL back into its chop zone after breaking both sides with no follow through
- QQQ daily EMA 12 support inside bar today forming EQ that will break monday
- SPY 4h H&S confirmed bear break.

Stock market is going to crash as this candlestick pattern callsThere is a Bearish Harami reversal pattern in the making on the S&P 500 ETF weekly time frame. It looks perfect as a textbook sample.
Stop is above last week's top at $445
Target is just above the opening of the second candle of preceding growth at $392

NVDA TSLA AAPL AMZN GOOGL MSFT | QQQ SPY Price Level Analysis- QQQ healthy pull back last 3 days and bounced hourly uptrend will be the guide
- SPY same with QQQ hourly uptrend is the guide
- NVDA relative weaker compare to QQQ
- TSLA potential 4h head and shoulder
- AAPL ATH closed still the strongest tech , 2D EMA 12 full bull control
- AMZN bull break out of its consolidation
- GOOGL bounce back into its side ways range
- MSFT potential bear flag still need to bounce more

Daily Market Analysis - THURSDAY JUNE 22, 2023Fed Chair Powell's Testimony Dampens US Stock Market, BoE Set to Raise Rates Amid Bleak Outlook
Key events:
Switzerland - SNB Interest Rate Decision (Q2)
Switzerland - SNB Press Conference
UK - BoE Interest Rate Decision (Jun)
UK - BOE Inflation Letter
USA - Initial Jobless Claims
USA - Existing Home Sales (May)
USA - Fed Chair Powell Testifies
USA - Crude Oil Inventories
US Stock Market Declines as Powell's Testimony Signals Potential Interest Rate Increases
The US stock market faced a downturn on Wednesday following Federal Reserve Chairman Jerome Powell's testimony before Congress. Powell emphasized the central bank's commitment to addressing inflation and hinted at the possibility of additional interest rate hikes. This led to the third consecutive day of losses across all three major US stock indices, with tech giants and related companies exerting significant downward pressure.
During his testimony to the US House Financial Services Committee, Powell reaffirmed the central bank's determination to bring inflation back to its targeted goal of 2%. He indicated that if the current economic trajectory continues, it would be reasonable to expect future interest rate increases. Market indicators, such as CME's FedWatch tool, currently suggest a 74.4% probability of a 25 basis point rate hike at the conclusion of the upcoming monetary policy meeting in July.
Powell's Testimony Continues, Energy Stocks Lead S&P 500 Gainers
Federal Reserve Chairman Jerome Powell is set to provide additional testimony before the Senate Banking Committee on Thursday. In the S&P 500, energy stocks emerged as the top gainers among the 11 major sectors, recovering from a notable decline witnessed the previous day. On the other hand, the technology and communication services sectors experienced the largest percentage drops.
AMZN stock daily chart
Amazon.com (NASDAQ: AMZN) Faces Lawsuit by FTC Over Alleged Deceptive Practices
Amazon.com (NASDAQ: AMZN) encountered legal challenges as the Federal Trade Commission (FTC) filed a lawsuit against the e-commerce giant. The lawsuit accuses Amazon of deceiving customers by allegedly obtaining their subscription to Prime services without obtaining proper consent.
TSLA stock daily chart
Tesla Inc (NASDAQ: TSLA) Slumps Following Downgrade by Barclays
Tesla Inc (NASDAQ: TSLA) witnessed a significant decline of over 5% following a downgrade by Barclays. The stock was downgraded from Buy to Hold, raising concerns about potential price cuts by the electric vehicle manufacturer. These price cuts have raised worries about the impact on Tesla's margin and earnings.
US Dollar Currency Index daily chart
US Dollar Reverses Gains, Gold Struggles to Maintain Position
The US Dollar faced significant selling pressure during American trading hours, leading to the end of its three-day winning streak and the elimination of its weekly gains. As of early Thursday, the US Dollar Index (DXY) remained relatively stable, hovering just above the 102.00 level.
Meanwhile, the price of gold experienced a drop to its lowest level in three months on Wednesday, dipping below $1,920. However, it managed to recover slightly later in the American session as US Treasury bond yields retreated. Nevertheless, early Thursday sees XAU/USD struggling to maintain its position, trading in negative territory slightly below $1,930.
XAU/USD daily chart
Central Banks' Monetary Policy Decisions Awaited Amid Concerns
Thursday will be marked by the closely watched monetary policy decisions of two major central banks: the Swiss National Bank (SNB) and the Bank of England (BoE).
The Bank of England (BoE) is set to convene following another worrisome inflation report, with expectations pointing towards an additional 25 basis point interest rate increase.
Despite being the first major central bank to initiate rate hikes as a measure to combat inflation, the BoE's efforts have been relatively less effective compared to other banks. British inflation currently stands as one of the highest among developed economies, nearing 9%. Consequently, the BoE is expected to be the last central bank to conclude its rate-hiking cycle. Projections suggest that the bank will implement six more 25 basis point rate hikes, eventually reaching a peak rate of over 6% by the end of this year or the beginning of the next.
Given the challenging macroeconomic conditions, it remains uncertain how the UK will manage to avoid a recession.
GBP/USD daily chart
UK Inflation Report Fails to Boost British Pound
The release of the UK inflation report did not generate a significant influx of buyers for the British pound. Despite initially testing resistance at 1.28, the GBP/USD currency pair retraced to pre-data levels and even reached its lowest point in five sessions. In contrast, the EUR/GBP currency pair witnessed a notable reversal from its nearly oversold state and surged above 0.86.
EUR/GBP daily chart
BoE Hawkish Surprise and Key US Data Awaited
There is a possibility of a hawkish surprise from the Bank of England (BoE), potentially including a 50 basis point rate hike, either in the current meeting or in one of the upcoming meetings. This anticipation is expected to maintain the GBP/USD currency pair on a trajectory for further gains, especially considering the prevailing environment of a weakening US dollar.
Market participants will also closely monitor the release of the weekly Initial Jobless Claims data from the United States, which has the potential to inject new momentum into the market. The US economic calendar will further feature the publication of Crude Oil Inventories and Existing Home Sales data for May. Additionally, FOMC Chairman Jerome Powell will continue his semi-annual congressional testimony, providing valuable insights into the policy outlook.

Part 2 Big 6 Tech stocks | QQQ Sp500 Detail Price Trend Analysis- QQQ and SPY shaping up that 4h head and shoulders pattern
- NVDA bear break of that rising wedge
- TSLA looking like a blow off top now
- AAPL strongest tech stock chart still looks perfect intact 2D EMA 12 full bull control
- AMZN still chopping within its zone starting to weaken
- GOOGL formed its first daily downtrend
- MSFT starting to weaken too

Part 1 Big 6 Tech stocks | QQQ Sp500 Detail Price Trend Analysis- QQQ and SPY shaping up that 4h head and shoulders pattern
- NVDA bear break of that rising wedge
- TSLA looking like a blow off top now
- AAPL strongest tech stock chart still looks perfect intact 2D EMA 12 full bull control
- AMZN still chopping within its zone starting to weaken
- GOOGL formed its first daily downtrend
- MSFT starting to weaken too

The Art of PatienceAmong the dozens of qualities and attributes, experts say traders need, patience is one of the most important qualities a trader can possess. It is a virtue often overlooked in the fast-paced world of trading, where new traders are lured into the trap of the get-rich-quick ideology. The ability to wait for the right trades can be the difference between success and failure, but how can we grow our patience?
In this article, we will dive into the art of patience. We will discuss why patience is important and methods to cultivate patience.
Why Patience is Important in Trading
In this day and age, patience is a difficult thing to master. As a society, we almost want things before we know we want them. That makes waiting for nearly anything a monumental burden for most. We are so impatient that we are willing to pay money to remove things that require patience. Ads on video or music streaming apps or expedited package delivery are great examples. However, this does not mean we cannot learn and become disciplined in the art of patience.
Patience allows traders to take a long-term view of the market. That market can be a volatile and unpredictable environment, and the temptation to blindly leap into a trade can be immense if we cannot maintain discipline and patience. Emotional or impulsive trades often lead to losses.
Patience allows traders to wait for ideal opportunities that are thoroughly analyzed, utilizing a robust yet simple trading system. If we as traders take the time to be patient and genuinely analyze potential opportunities we can often avoid trades that are likely to be unprofitable.
How to Cultivate Patience
Patience is not a natural trait for everyone, but it can be cultivated through practice. Here are some tips for building your patience:
Set realistic goals: Patience really requires a long-term perspective. Traders should set realistic goals for their trading strategy and focus on achieving them over time, rather than trying to get rich quick. The old adage of “Rome wasn’t built in a day” couldn’t be more pertinent. Great things take time to develop, but they are often worthwhile.
If you miss, you miss: Something that is difficult for any trader is missing an opportunity. Maybe you were pulled away or just generally distracted, and an opportunity passed by you. It is unwise to hop on the FOMO train in the hope that there is still room up or down for a trade to be profitable. It is far better to take a step back and analyze the market and find new entries or opportunities that can be verified by your system. Missed opportunities are also a great learning experience to build yourself up rather than tear yourself down.
Avoid distractions: Ohhhh look a squirrel! Anyways, the markets can be overwhelming, and it can be easy to get distracted. Examples of distractions would include nonconsequential/irrelevant news, misleading social media posts or groups, and personal environmental factors. Avoid distractions and focus on your trading plan; your future self will be thankful.
Practice mindfulness: Many mistakenly think mindfulness is to make your mind a blank canvas, devoid of thought, and disregarding everything external. Mindfulness is the practice of being present in the current moment, recognizing when your mind wanders, and letting it go as you bring your focus back. View your mind as a muscle that needs to be trained, not entirely dissimilar to an athlete training their body. Mindfulness can help you stay focused and avoid impulsive decisions as you bring yourself to the present moment.
Conclusion
The funny thing about patience is that it takes time to develop. Patience is a foundational pillar for a trader's market psychology, but it is one of the hardest to build up. It allows traders to wait for the right opportunities, avoid emotional decision-making, and take a long-term view of the markets. By cultivating patience and applying it to your trading strategy, you can increase your chances of success.

Healthy Pull Back or More Downside? QQQ SPY Big 6 Tech Analysis- QQQ & SPY potential bearish pattern H&S forming
- Still a very healthy consolidation pull back at the moment
- TSLA 4 hour time frame 12 EMA full bull control guide
- NVDA rising wedge pattern is my guide
- GOOGL daily downtrend potentially shaping up
- AMZN similar to GOOGL cant get out of its chop box zones rejected resistance again today
- MSFT starting to pull back enough that if next bounce is shallow might start to shape up more downside
- AAPL strongest of them still very shallow pullbacks and healthy at the moment, 12 EMA 2 day time frame absolute full bull control

What is emotion in trading?Emotion in trading refers to the psychological and emotional state of traders that can influence their decision-making process and trading behavior. Trading can be a highly emotional endeavor due to the inherent risks, potential financial gains or losses, and the pressure associated with making split-second decisions in dynamic markets.
Some common emotions experienced by traders include:
1| Greed: A strong desire for more profits, often leading to excessive risk-taking and holding onto winning trades for too long.
2 | Fear: The feeling of anxiety or unease about potential losses, leading to hesitation, over-caution, or selling trades prematurely.
3 | Hope: The optimistic expectation that a losing trade will turn around, causing traders to hold onto losing positions longer than they should.
4| Frustration: The feeling of annoyance or impatience due to unexpected market movements or unsuccessful trades, potentially leading to impulsive decision-making.
5| Overconfidence: Excessive belief in one's trading abilities, leading to taking on higher risks or neglecting proper risk management strategies.
6| Regret: Feeling remorse or disappointment about past trading decisions, which can cloud judgment and lead to revenge trading or irrational behavior.
These emotions can significantly impact trading performance. Emotional decisions may deviate from rational analysis and objective strategies, potentially leading to poor trade execution, excessive losses, or missed opportunities.
Successful traders aim to manage their emotions effectively by adopting a disciplined approach, implementing risk management strategies, maintaining a trading plan, and cultivating psychological resilience. They strive to make trading decisions based on logic, analysis, and adherence to predefined rules rather than being swayed by momentary emotions.
AMAZON expecting bullish push
Hi viewers, AMZN here technicalls are strong bullish push to expect
TP1:115
TP2:120
TP3:123

Detail Price Level Trend Guide | NVDA TSLA AAPL AMZN GOOGL MSFT- NVDA short term 15m time frame bull break lacking follow through then weaker compare to QQQ into end of day on Friday
- TSLA still relative stronger than QQQ gap filled 4h 12 EMA still full bull control guide
- AAPL zero red flags trading around ATH, 2 day time frame 12 EMA full bull control guide
- AMZN weaker of the big tech closed right at support into end of day potentially may break below it on Tuesday
- GOOGL weakest of the big tech, may form a daily downtrend if we break prior pivot 121 level
- MSFT similar to AAPL trading in ATH range, no red flags yet need to confirm hourly downtrend for bears, for bulls still in full control.

Technical Levels for $AMZN | Fibonacci & Pivot PointsThese levels are good for swing traders and long term investors.

6 Big Tech Stocks Price Action Trend Guide |Support & Resistance- QQQ and SPY still very healthy pull back on the daily chart. although QQQ is definitely extended, but still want to see bears prove it to us first in the price action (changing of trends)
- TSLA relative strength compare to QQQ filled its gap.
- AMZN and GOOGL weaker, still cant get over its side ways range.
- MSFT and AAPL trading in its ATH range no red flags at all on its charts yet
- NVDA small red flag break of yesterdays double top with no bulls follow through and came back into the range, still need structural changes on the daily chart for it to really have any meaning
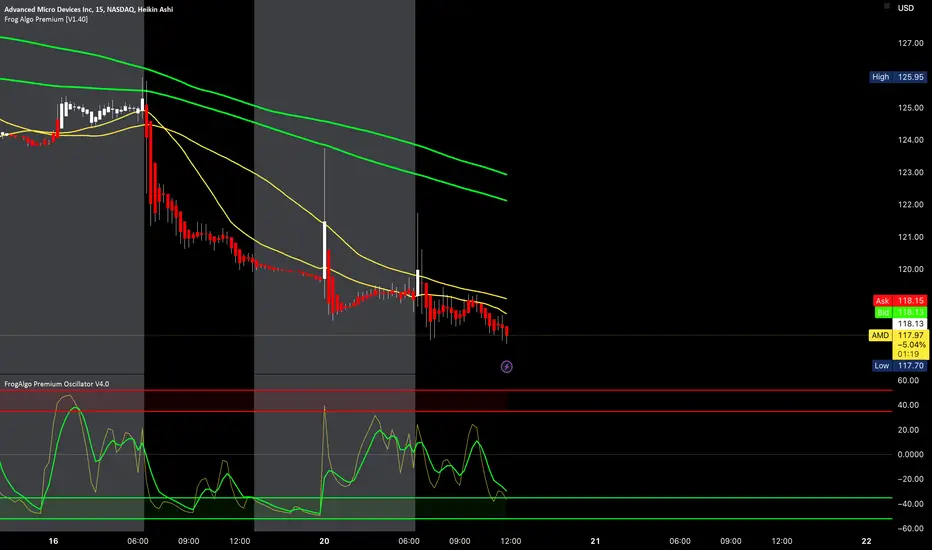
- AMD daily downtrend confirmed today

Amazon W Formation looking sweet to $152.00 About the Co. On the daily Amazon has formed what's known as a Short Formed W Formation.
This is where the second rounding bottom has a HIGHER low than the first.
This is more bullish than a standard W Formation, IMO, because it means the bulls did not let the price get to the previous low.
The fact that the price has broken up and out of the neckline, shows strong buying momentum, which will push the price higher.
Other indicators confirm...
7>21>200
RSI>50 - Higher lows
Target $152.00
ABOUT THE COMPANY
Amazon.com, Inc. is a global technology company focusing on e-commerce, digital streaming, artificial intelligence, and more.
Founding: Amazon was founded by Jeff Bezos on July 5, 1994, in Bellevue, Washington, USA.
First Product: Initially, Amazon was an online marketplace for books.
Name Origin: Bezos chose the name "Amazon" to suggest scale (Amazon River is one of the largest rivers in the world) and because it started with "A," which would appear early in alphabetical order.
Public Listing: Amazon went public on May 15, 1997, and is listed on the NASDAQ.
Expansion: After books, Amazon expanded to sell music, videos, and, eventually, everything from groceries to electronics, clothing, and more.
Global Presence: Amazon operates in multiple countries around the globe, including the United States, Canada, United Kingdom, Germany, France, China, Japan, and India.
Amazon Prime: Launched in 2005, Amazon Prime is a subscription service offering free two-day shipping, streaming music and video, and other benefits.
AWS: Amazon Web Services (AWS), launched in 2006, provides on-demand cloud computing platforms and APIs to individuals, companies, and governments.
Kindle: In 2007, Amazon introduced the Kindle e-reader, revolutionizing the book industry by making digital books popular.
Employees: Amazon is one of the world's largest employers, with over a million employees
Physical Stores: Amazon also owns physical stores, including Whole Foods Market (acquired in 2017) and Amazon Go, a chain of cashier-less convenience stores.
Devices: Apart from Kindle, Amazon has produced several successful electronics, including the Fire TV, Fire tablets, and Echo smart speakers, which feature the voice-controlled AI assistant, Alexa.

Top 3 AI stocks NOT to buy now | Stock Market Price Level Guide - QQQ and SPY still complete full bull control cant remember the last time bears confirm a hourly downtrend.
- TSLA relative weaker to QQQ today
- AAPL and MSFT lead bull leading the market today, ALL time highs
- GOOGL and AMZN weaker of the techs today
- NVDA also weaker with double top from yesterday
- im shorting SOXX so buying SOXS and would like to see AVGO AMD NVDA potentially fall here, if not ill stop out small from todays highs sideways range.

NVDA TSLA AMZN GOOG MSFT AAPL QQQ Sp500 Detail Price Level Guide- NVDA ATH in price discovery mode
- TSLA relative weaker than QQQ today potentially need some consolidation for the bulls after a fast move.
- GOOGL weakest of all Tech still in range for potentially daily bearflag
- MSFT AAPL testing 52 week high resistance
- QQQ zero signs of bear still, need AT LEAST an hourly downtrend for anything to happen
- SPY weaker than QQQ today but zero red flags still at the moment same thing n
