Sp500 QQQ|TSLA NVDA AAPL AMZN GOOGL MSFT Price level Trend Guide- PPI and FOMC meeting tomorrow
- SPY & QQQ hourly time tightening range, will break tomorrow
-TSLA still full bull control 4h 12 EMA
- NVDA falling wedge bull break
- AAPL likely testing ATH again, 2D ema 12 full bull control
- AMZN daily bull break lacking some follow through
- GOOGL weakest of the big techs still only retrace 50% of last weeks pull back
- MSFT likely re-test of 52 high double top
AMZN

AMZN Amazon could lose market share because of ChatGPT If you haven`t sold AMZN here for a profit:
Then you should know that the implementation of a chatbot like ChatGPT, powered by OpenAI's advanced natural language processing capabilities, could indeed provide an opportunity for consumers to find the cheapest price online for the same product. In an era where price comparison and cost-saving measures are highly valued by customers, this feature could be a valuable asset for Bing.
Amazon's reputation for having expensive and overvalued prices has been a topic of discussion among consumers. While Amazon provides a wide range of products and convenient shopping experiences, some users have expressed concerns about the pricing competitiveness on the platform. This presents an opening for Bing to attract cost-conscious consumers who are actively seeking better deals.
Furthermore, the concern over the origin of products, particularly those manufactured in China, has gained attention in recent years. Some consumers prefer to avoid purchasing Chinese-made products due to quality, safety, or political reasons. If Bing can provide a search experience that allows users to filter or identify the origin of products more effectively, it could cater to a segment of consumers who prioritize alternative sourcing.
If I had to buy some options, that would be the following puts:
2024-1-19 expiration date
$105 strike price
$4.10 premium
Looking forward to read your opinion about it!

TSLA NVDA AAPL AMZN GOOGL MSFT|Sp500 QQQ Price Level Trend Guide- CPI Data 830am EST tomorrow
- FOMC & PPI Wednesday
- TSLA side ways tightening range will break tomorrow, 4h 12 EMA full bull control guide
- NVDA bull break from falling wedge
- AAPL likely testing all time high again soon
- AMZN retracing almost all of its drop likely testing its recent high
- GOOGL weakest of the big tech still potential forming a daily downtrend
- MSFT in the middle still has potential to form that daily downtrend but QQQ needs to start its weekly consolidation
- SPY testing 0.65 golden pocket resistance
- QQQ gap filled looking for weekly consolidation soon

TSLA NVDA AAPL GOOGL AMZN MSFT | Detail Price Levels Trend Guide- TSLA bulls 4 hour time frame 12 EMA full bull control, Bears need to form a hourly downtrend as first step
- NVDA bull break lacking follow through, bears still need to confirm that hourly downtrend as well
- AAPL holding 2 day time frame EMA 12 full bull control
- GOOGL MSFT AMZN - potentially shaping up a daily downtrend

TSLA GOOGL AMZN NVDA AAPL MSFT |Sp500 QQQ Detail Market Analysis- TSLA extended to resistance, but still full bull control on 4h 12 EMA
- GOOGL MSFT AMZN potentially shaping up a daily downtrend
- AAPL strongest of big techs holding up still 2Day EMA 12 bull control guide
- Sp500 held support that was prior resistance
- QQQ 5th reject from golden pocket zone if big techs confirm daily downtrend QQQ wont be able to hold

TSLA AAPL NVDA GOOGL AMZN | Sp500 QQQ Market Price LEVELs Guide- TSLA CLEAR 12 EMA 4 hour time frame support guide
- NVDA falling Wedge Guide
- GOOGL Lead Bear of big tech bull break with no follow through on Monday
- AMZN potential setting a lower high on daily
- AAPL stronger big tech 2 day time frame EMA 12 perfect support guide

TSLA NVDA GOOGL AMZN AAPL MSFT | QQQ SPY Price Levels Analysis- TSLA still relative strength compare to QQQ once we lose that strenth daily consolidation might be on its way.
- NVDA likely testing 366 soon, will be interesting to see the price action when we come to the gap territory
- GOOGL back to low of its chop zone support range- bull break lacking follow through
- AAPL still in daily uptrend holding better than its peers
- MSFT also weak losing its daily uptrend now neutral trend.
- QQQ still have daily uptrend intact
- SPY no red flags today held very well despite QQQ weakness money rotate into SPY sectors and IWM.
- VIX barely moved much due to money rotating around need every sector to drop for VIX to spike fast

Amazon Up 47% This Year Already!Amazon is once again proving its innovative prowess by negotiating with key players like Verizon, T-Mobile, Dish Network, and AT&T to offer budget-friendly or free mobile services to its U.S Prime subscribers. This groundbreaking step could transform the telecom sector and strengthen Amazon's position by merging e-commerce and telecom.
Bundling wireless plans and a Paramount+ subscription into Prime, Amazon is poised to significantly boost its market status.
The company's stock has already skyrocketed 47% this year, with a 14% hike in May alone. A few potential roadblocks include the weekly 200 simple moving average at $132 and resistance at $144. Yet Amazon's consistent growth pattern suggests minimal impact.
Despite a 55% pullback between 2021 and 2022, Amazon is likely to bounce back and may even outperform its past peak.
With a successful telecom endeavor, shareholders could see stocks surge past $188 and potentially break the $200 resistance. This venture not only bodes well for investors but could also reinvent the e-commerce landscape by providing unparalleled integrated services.
If you enjoyed this post, make sure to like, and follow for more quality content!
If you have any questions or comments, comment below. We reply to every comment!
See below for more information on our trading techniques.
As always, keep it simple, keep it Sublime.

S & P: Macro Bull Flag Consolidation?If you zoom out on the S & P 500, the measured moves and fibs line up fairly perfectly and in my opinion
paints a more realistic picture as far as expectations for the market moving forward. It is hard for me to see
this market going market going all that much higher at all. With blow off top type price action in names like NVDA
and the recent price action in AAPL, this type of price action makes the most sense to me.

TSLA NVDA AAPL MSFT GOOGL AMZN Detail Trading Guide with Levels- most of all these big tech stocks and market itself are due for weekly consolidation so the most likely scenario for me in the next coming weeks is more so a sideways or slight dip action.
- the size of this consolidation pull back will determine our next move
- Tesla about to form its first monthly uptrend since ATH
- Nvidia potential 4h head and shoulders pattern
- AAPL & MSFT potentially testing ATH

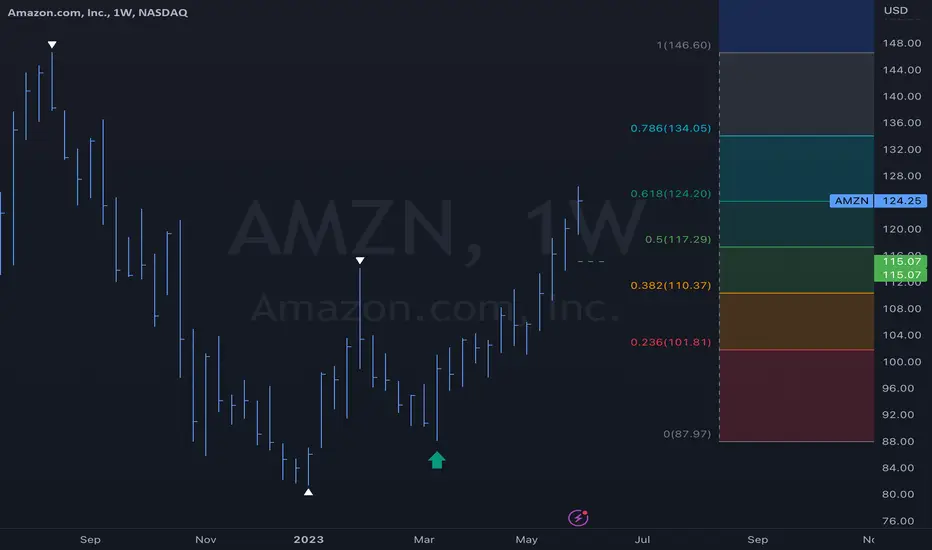
$AMZN weekly Fibonacci NASDAQ:AMZN weekly chart pierced the 618 fib level and pulled back. Still in uptrend support at the green dotted line.
AMZN 45min trade- short position On the chart we can see a bullish trend, however Relative Strength index shows potential bearish divergence. We would enter a short position once the price reaches the upsloping line.
Stop loss: 127.52 USD
Target: 118.52 USD

AMZN - TREND BREAKOUT AND CONTINUATIONFor more updates, please follow my TradingView page, and if you find the content useful, kindly hit the "thumbs up" button to show your support. If you have any queries regarding trading, please feel free to send me a direct message on TradingView. Additionally, please share this content with your friends who may find it beneficial.
Please note that any trading updates provided here are for educational purposes only, and it is always advisable to conduct your own research before making any investment decisions. It is important to ensure that all conditions are met before following any trade plan suggested in this update.

$AMZN Down Trend Begins NASDAQ:AMZN The first time #amazon 20 month moving average is crossing below the 50 month moving average. This is could be the beginning of a new down trend. Also in a bear flag.

MyMI Options Play - AMZN CallsAMZN has recently broken it's current downtrend channel as identified but has also broken above and found closure/support above the 50% retracement from the $180 ATHs that it saw back in Nov. 2021.
I haven't purchased my long-term opts on this yet to see if a reversal in the current market push due to NVDA and other AI-Based movements that are holding up the markets. I expect some retracement at some point and potentially back to $114. From there I will look at the support we find back at that 50% retracement level ($114) and look for a long-term hold to back to the $140-$145s (if not higher).

AMAZON on a 1D Bullish Cross, first since Feb 2020!Amazon Inc (AMZN) just completed a Bullish Cross on the 1D time-frame, the first in more than 3 years (February 04 2020)! That alone is the strongest long-term buy signal we could get. On the shorter term, now that the price is comfortably above the Bear Cycle Lower Highs, we will start targeting on every pull-back the upper Fibonacci levels, which match fairly well the Lower Highs Resistances of the Bear Cycle. Our medium-term target is 146.50 (slightly below the 0.618 Fibonacci).
-------------------------------------------------------------------------------
** Please LIKE 👍, FOLLOW ✅, SHARE 🙌 and COMMENT ✍ if you enjoy this idea! Also share your ideas and charts in the comments section below! **
-------------------------------------------------------------------------------
💸💸💸💸💸💸
👇 👇 👇 👇 👇 👇

AMZN - Breakout Rising Trend Channel🔹AMZN has broken the rising trend up in the medium long term.
🔹The moving average indicator has also given a positive signal.
🔹AMZN has support at 113 and resistance at 136.
🔹Overall assessed as technically positive for the medium long term.
Chart Pattern;
🔹DT - Double Top | BEARISH | 🔴
🔹DB - Double Bottom | BULLISH | 🟢
🔹HNS - Head & Shoulder | BEARISH | 🔴
🔹REC - Rectangle | 🔵
🔹iHNS - inverse head & Shoulder | BULLISH | 🟢
Verify it first and believe later.
WavePoint ❤️

NVDA TSLA MSFT GOOGL AAPL AMZN | Support & Resistance Guide- Support & Resistance guide for all 6 big tech stocks NVDA TSLA MSFT GOOGL AAPL AMZN
- psychological 1 trillion dollar level for NVDA 405
- TSLA wedge pattern still in play
- zero red flags on the chart for MSFT and AMZN need hourly downtrends to confirm for any signs of bears

AMZN - Take off 60% ? AMZN - Take off 60% ?
A popular stock + above the average line 150MA + Down Resistance line breakout (4 times & BOOM).
Only an idea and not a recommendation for trading !

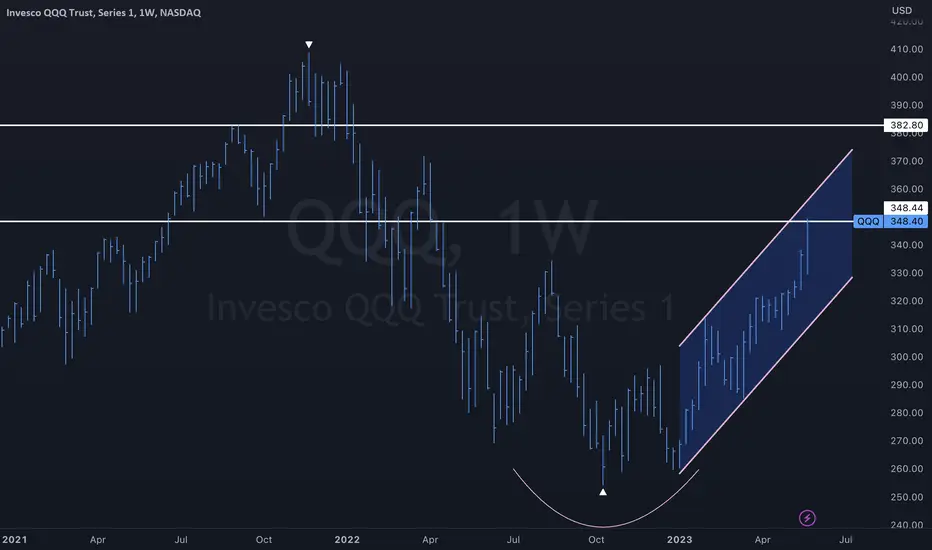
$QQQ Parallel channel uptrend NASDAQ:QQQ parallel uptrend continues into resistance. Holiday hangover next week should be light volume which favors the upside.
$QQEW Inverse head n shoulders NASDAQ:QQEW Inverse head n shoulders ready to break out. it needs to consolidate next week before it can break out. equal weight nasdaq 100

$AMZ Inverse head & shouldersNASDAQ:AMZN Weekly chart Inverse head & shoulders pattern. target horizontal line up above.

