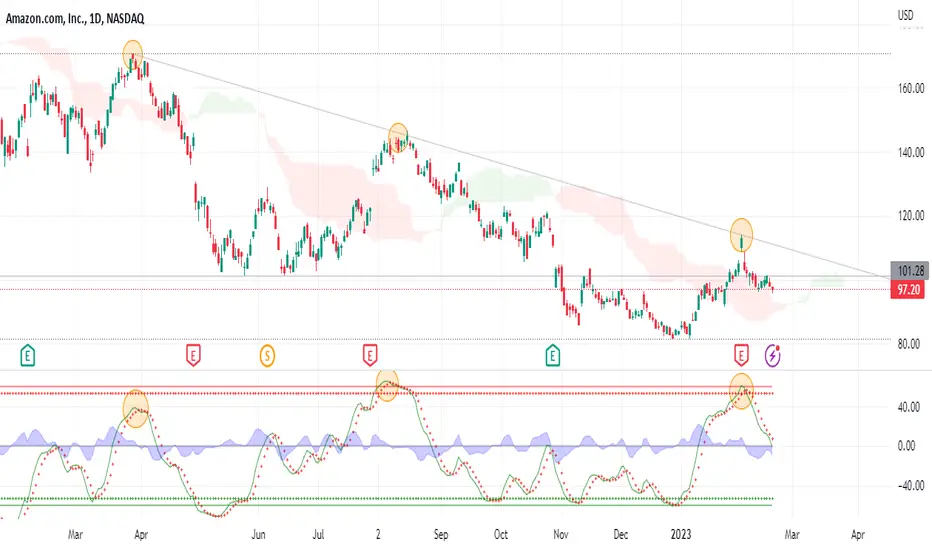
AMZN - Falling Trend [MIDTERM]- AMZN shows weak development in a falling trend channel in the medium long term.
- This signals increasing pessimism among investors and indicates further decline for AMZN.
- However, the price has broken a resistance level in the short term and given a positive signal for the short-term trading range.
- AMZN is approaching's resistance at 100 , which may give a negative reaction.
- However, a break upwards through 103 will be a positive signal.
- Overall assessed as technically negative for the medium long term.
*EP: Enter Price, SL: Support, TP: Take Profit, CL: Cut Loss, TF: Time Frame, RST: Resistance, LT TP: Long Term Target Price
Verify it first and believe later.
WavePoint ❤️
AMZN

AMZN Publish IdeaToday, the market is expected to lower the price at 96.09 to 94.57
The market has made an increase at the highest price, and if the market wants to make an increase, it needs to make 1 decrease in price to expectations.
In wave reading, it is market wave 4

💥 AMAZON AMZN 4H-TIMEFRAME ANALYSIS💥 AMAZON AMZN 4H-TIMEFRAME ANALYSIS
💗Hello ladies and gentlemen
This is my new idea for 💥AMZN
I hope my idea is clear
Support me by like and share thank you
Stay Safe💯💲💲💲
Good luck💰😍

$AMZN: Down trend continuationNew signal here, low risk short setup for the coming 2 weeks.
Best of luck!
Cheers,
Ivan Labrie.

Amazon Can Be Finishing A CorrectionAmazon is still in downtrend, but support can be near, as it can be finishing a potential ending diagonal (wedge) pattern within wave (C) of an (A)-(B)-(C) correction from the highs. We are tracking final stages of wave 5 of (C) that can ideally stop somewhere in the 80 - 70 area. Any earlier rally back to 130 level might be signal that bulls are already back in the game.

AMZNHey traders, here is the analysi.
If you guys like my analysis please hit like👍 and follow.
Thanks.
DISCLAIMER- This is not financial advice.
SMART MONEY CONCEPT

AMZN (Y23.P1.Video1).Macro reviewHi Traders,
My thoughts on AMZ and key levels to watch and trade.
All the best,
S.SAri


AMZN, 10d+/17.35%rising cycle 17.35% more than 10 days.
==================================================================================================================================================================
This data is analyzed by robots. Analyze historical trends based on The Adam Theory of Markets (20 moving averages/60 moving averages/120 moving averages/240 moving averages) and estimate the trend in the next 10 days. The white line is the robot's expected price, and the upper and lower horizontal line stop loss and stop profit prices have no financial basis. The results are for reference only.

Amazon -> Kind Of Left BehindHello Traders,
welcome to this free and educational multi-timeframe technical analysis .
Just recently Amazon stock perfectly retested and also rejected a quite obvious previous weekly support zone which was turned very strong support again.
After this first initial bounce, Amazon stock then created a rejection of a long term downtrend-line and is once again approaching the weekly support area from which I do expect another rejection towards the upside.
On the daily timeframe I am now just waiting for the market to retest the previous support area and if we then have some bullish confirmation on the lower timeframes, it is quite likely that we will see at least a short term rejection towards the upside.
Thank you for watching and I will see you tomorrow!
You can also check out my previous analysis of this asset:

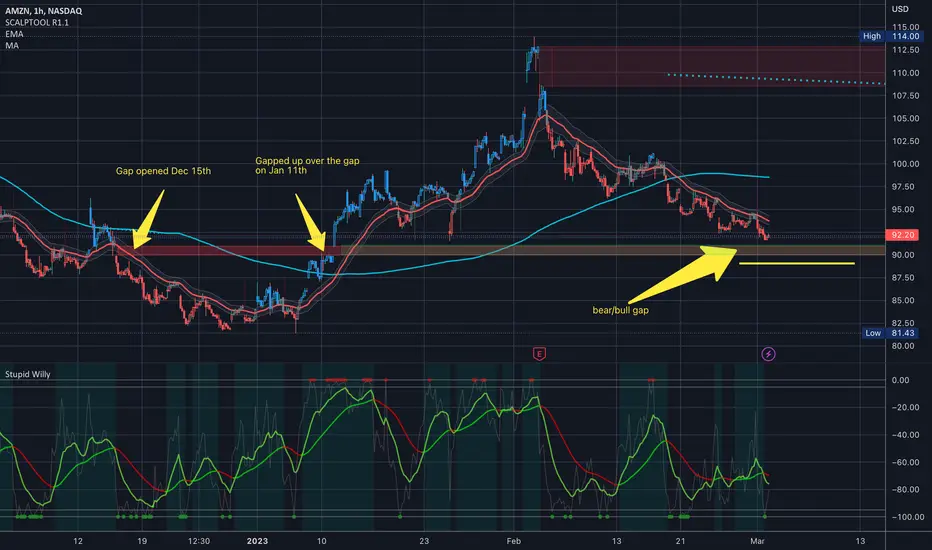
$AMZN Analysis, Key levels, and Targets $AMZN Analysis, Key levels, and Targets
Super neat level here…
On Dec 15 Amazon opened a bear gap… then on Jan 11th, it gapped up over that gap, and now we are back at that level again…. See arrows…
I’m not necessarily bullish on the market… but I did sell puts at 89 today at EOD for next week to open a position…. And that is just below the gap level….
Let’s see what happens… I’m interested to see what happens to that gap from a TA standpoint… could become short term support, or it could become resistance. Wouldn't it be wild if it was gapped under... I almost wish it would because I wouldn't even know what to do, i'd be so excited 🤓
Amazon Call or Puts ? The Saga Continues Today Amazon broken out of a important trend line. Im bearish on the stock due to the dominant down trending pattern. it also has created a ascending Triangle Pattern at level $94.79 being the top and bullish support developed at $92.29. Please share what do you think?
Major support levels Im watching for a bounce
NASDAQ:AMZN NASDAQ:AMZN
$92.29
$91.62
$90.39
$87.02

Amazon Downtrend Call & Put Option PlayI think Amazon is on a down trend. How ever I also think there are goin to me some major levels for bounces. I'm looking forward to purchase a OTM put option to catch the overall trend. and to take call options at major support levels to previous resistance.

Amazon Down Put and Call Option PlayI think Amazon is going to continue down trending to a low level with major bounces in the market. NASDAQ:AMZN

LONG Term AMZN DCARe-entered the market after several months on the sideline waiting for longer term indicators to look positive.
I believe this is a suitable spot to start DCA again into high conviction companies and stocks.
High conviction in the company for the long term✅
Money flow on the monthly in the red ✅
RSI Oversold on the monthly ✅
Trading around significant support (@0.5 AT Fib)✅
Market Cipher on the monthly around the 'buy-zone' ❓*
*Market Cipher not yet indicating buy, however, weekly green indicator with the above indicates the monthly buy-signal is near - hence comfortable to DCA as within my personal risk tolerances)
** NOT TRADING OR FINANCIAL ADVICE **

AMZN (AMAZON BUY FOR LONG TERM)NASDAQ:AMZN
HI , TRADER'S ..As per Price Action Analysis in one day TF
Price is near to make double bottom , Entry of buy after confirmation of double bottom
Target for buy will be upper resistance
❤️ Please, support my work with follow ,share and like, thank you! ❤️

AMZN looks weakAMZN needs a stronger structure IMO
Will watch the over next week More bearish pullback?

$AMZN: Down trend could turn aroundLet's examine the facts real quick: down trend in the daily timeframe hit the target, intraday bars show a bullish reversal into the close after that, weekly trend remains potentially bullish over time, monthly down trend ran out of time. I'd wager that this is the bottom of this correction here, seems like a low risk bet. Bet small, use relatively wide stops and see what it does, energy prices that were a huge headwind have come a long way down...
Best of luck!
Cheers,
Ivan Labrie.

Solid Level for AMZNI have been stalking NASDAQ:AMZN share prices for months now watching as it retraced from the All Time High down to a full 50% Retracement from the All Time Low. This is a pretty epic pullback level that took decades to create.
The 6 month downtrend from 146 > 81 created its own 50% Retracement at 114 as Resistance. February earnings popped to this level and confirmed it. As the January bull run fades AMZN comes back again to test the broader level.
Even as we drill lower to the intraday timeframe we can see the 50% Retracements begin to setup. The volatility around today's FOMC minutes shows respect for the level. This sets up a low risk opportunity to play the decadal Support.

AMZN, quarterlyAmazon issued a weaker-than-expected forecast for 2023Q1. In January, Amazon began layoffs to the tune of 18,000 jobs—a sizable cost cut that will likely pump up net revenue for the next few reports and give shareholders a warm feeling.
After Prime Video’s disastrous performance and insane production costs, the salary reduction is much needed to keep Amazon agile. Expenses have become a primary target for Amazon’s “lean clean” phase, which will balance out the pandemic period’s excessive hiring.
Product sales are lower than expected in 2023, and the stock charts don’t show it yet. Whatever or whoever is fueling the AMZN rise won’t last long without support, but Amazon isn’t cooking anything that will give investors high hopes in the coming months, so don’t be surprised if AMZN has a reversal right after media channels are waving bullish flags.

AMZN (Amazon)- looks bad in a short time, unknown for the restIf in the next three trading dates (21 -23 Feb) does not close above the neck line, I predict AMZN will continue to correct and build up its momentum.

AMZN keeping the downtrendThis is the third time price breaks Ichimoku clod, touch the downtrend line with the WTO at the high that follows a fall until the WTO is at the bottom. Part of the movement is gone but I think there is more path to follow. Stop at the trendline, target at 80.22