SPY PRICE ACTION 10TH APRIL2025Spy further price action is here. I have discussed all the potential buying levels and do not go long at current price as we are into a supply zone.
Feel free to leave a comment
NOTE:WAIT AS WE ARE INTO A SUPPLY
AMZN

OptionsMastery: This is the "h" DayTrading Pattern.This is the "h" pattern. A highly successful daytrading pattern!
🔉Sound on!🔉
📣Make sure to watch fullscreen!📣
Thank you as always for watching my videos. I hope that you learned something very educational! Please feel free to like, share, and comment on this post. Remember only risk what you are willing to lose. Trading is very risky but it can change your life!

AMZN LONG/SHORT SET UP(Amazon) If $160.00 holds we can see $200
if we break below$160.00 we could see $140-$120
LONG TRADE
Entry 1 $175.00
Entry 2 $165.00
Stop loss $155.00
Take profit 1- $195.00
(Close 33%)
Take profit 2- $215.00
(Close 66%)
Take profit 3-$230.00

SPX WEEKLY 7TH APRIL 2025Welcome to SPX weekly. I have deeply discussed the price action here. If you have any doubts, feel free to leave a message or comment below.
NOTE:DO NOT SHORT

Is Stock Market Bouncing Here or Continue Crashing?Stock Market Analysis | NASDAQ:QQQ & AMEX:SPY
Mag 7 Analysis | NASDAQ:TSLA NASDAQ:NVDA AAPL AMZN MSFT GOOGL META

Could bounce from here and may collapse laterPotential to bounce from here for the next couple of months. After bounce, if it comes back to the current level, then it could be a sign of crash. All the best !!

More Downside For AMZN Before CrossroadsMy overall thesis is we are in the very early stages of a multi-year decline ultimately with the S&P 500 below 3500. I am estimating this symbol to be in wave position SuperCycle 2, Cycle A, Primary 1, Intermediate 3 (pink), Minor 3 (yellow), Minute 5(green). I originally had this symbol nearly complete with Primary wave 1, but the continued declines received significant wave 3 of 3 of 3 signals (pink lines in bottom chart band). It is still unclear if we are in my theoretical larger decline or if we are in a simple corrective wave. It will take at least another two months to likely achieve the answer.
Theory 1 is my hypothesis where we are about to finish Minor wave 3 in Intermediate wave 3 in Primary wave 1 in a multi-year market correction. This would see AMZN bottom around 148-156 within two weeks and briefly head up toward 180 before continuing significant downward movement. Currently Intermediate wave 1 lasted 201 trading hours. Based on the breakneck pace of Intermediate wave 3, it may finish well before the 201st hour on 5 May. Extensions based on Minor wave 1's movement could put Minor wave 3's bottom around 162.59.
Theory 2 is that Intermediate waves 1, 2 and 3 (pink) are actually waves A, B, and C (white) in a short-term corrective wave. This would mean this symbol returns to all-time highs around the fall of 2025.
Theory 3 places the stock in the third wave about to finish a wave A down. Wave B up would last a few months before wave C takes the market to a bottom sometime around the end of 2025.
All three theories will observe the same movement over the next few weeks with a low soon and then a bounce up. Theory 2 becomes the likely winner if AMZN breaks above 206.21 within the next 2 months. Theories 1 and 3 will trade the same for quite some time.
I will reevaluate this stock once Minor wave 3 finishes. It should aid in providing a better bottom for Intermediate wave 3 in the next week or two.

QQQ: Tariff ReactionNASDAQ:QQQ As China strikes back with a 34% tariff on U.S. goods starting April 10, the global trade landscape could see some serious turbulence. This follows Trump's tariff moves, and the market's already feeling it: QQQ’s daily chart shows capitulation volume on the table, suggesting a potential bounce— IF tariffs ease.
But until these trade tensions subside, it's likely to be a rocky ride. Tariffs push prices up, inflation lingers, and the Fed finds itself boxed in. The outcome? A market crash, recession, and stagflation—yet, there's still hope for a bounce, depending on how these factors play out.
Manage the levels with us at ChartsCoach.

Amazon (NASDAQ: $AMZN) Drops 8% as Trump Tariffs Shake Markets. Amazon (NASDAQ: NASDAQ:AMZN ) is facing huge downward pressure following President Donald Trump's announcement of sweeping tariffs. The stock dropped 9.26% in early trading, reaching $176.92 as of 11:01 AM EDT.
These tariffs impact over 100 countries, including China, a key supplier for third-party merchants on Amazon’s platform. Rising import costs could push prices higher, affecting consumer spending and Amazon’s profit margins.
Looking at the broader market, it is also struggling from the tariffs. The Magnificent Seven stocks, including Apple, Nvidia, Meta, Tesla, Alphabet, Microsoft, and Amazon, have all seen huge drops.
Amazon’s 8% drop is among the largest, further highlighting its vulnerability to trade disruptions. If these tariffs persist, they could reignite inflation, weigh on economic growth and further impact stock prices. Amazon has faced major market shifts in the past. In 2022, its stock lost over 50% of its value within a few quarters.
The question now is, can the current decline lead to similar losses?
With Amazon trading at $242 in February, some fear it could drop below $120 if the economic outlook worsens.
Adding to concerns, geopolitical risks remain high. The ongoing war in Ukraine, coupled with uncertainty over future U.S policies, creates a volatile environment for stocks. Amazon’s reliance on global supply chains and consumer spending makes it highly sensitive to market shocks.
Technical Analysis
Looking at Amazon technically, there has been a downtrend since early February when it reached an all-time high and a 52-week high of $242. This peak came shortly after the presidential inauguration, but since then, the market conditions have not been favorable. The introduction of new tariffs has fueled bearish momentum, pushing Amazon lower toward key support levels.
Currently, the stock is testing a double support level, an ascending trendline and a horizontal support around $180. If buyers step in at this level, a rebound could occur, targeting the previous $252 all-time high. However, given the economic uncertainty, there is a strong chance the stock may break below this current support.
If the weekly candle closes strongly below the $180 level, the next critical point where the stock might find support is around $144. This area has historically provided strong buying interest and it may serve as a potential bottom if the decline continues.
Looking at momentum indicators, the weekly RSI currently sits at 33, indicating strong bearish momentum. Despite the reading approaching the oversold reading, macroeconomic data shows the downtrend remains dominant and further losses could be ahead.
What's the Outlook? Can Amazon Recover Soon?
The coming weeks will be crucial for Amazon’s stock. With earnings expected between April 28th and May 2nd, market sentiment may shift based on revenue growth and profit margins. However, ongoing trade uncertainties and rising costs remain key risks.
For now, monitor price action around the current market price of $180. A strong bullish move could confirm a short-term recovery. On the other side, a break below this double support level may signal a further drop towards $144 support level.

Buy idea on AMAZON (AMZN)Based On :
- Presidential cycle and quinquennial cycle
- quantitative data
- strong demand zone covered by weekly and 2w as well
- divergence on Poiv (open interest from Nq) and Progo
- Undervalued conditions on weekly timeframe

$AMZN Tradespoon - Long Entry $201.36Tradespoon model generated long signal for Amazon ( NASDAQ:AMZN ). Predicted range: $201.36–$207.48. Trend: +1.10%. NASDAQ:AMZN

Is Stock Market Going to Crash?Stock Market Analysis | NASDAQ:QQQ AMEX:SPY
Mag 7 Price Forecast | NASDAQ:TSLA NASDAQ:NVDA AAPL AMZN META MSFT GOOGL

AMZN breaks bear trendAmazon stock has gapped higher along with several other tech firms as investors rushed back into riskier assets following reports that Trump's upcoming tariffs will be more targeted than initially thought.
AMZN broke its bearish trend line after finding good support lats week at $190 key support level. If the gap now gets filled, then dip buyers might emerge near Friday's closing levels of around $195-$196. This area is now going to be significant.
Anyway, the short-term bias has flipped back to being bullish in light of today's breakout. As long as the stock now remains above the trend line, any short-term dips could be bought.
By Fawad Razaqzada, market analyst with FOREX.com

Stock Market Forecast | TSLA NVDA AAPL AMZN META MSFTStock Market Forecast | NASDAQ:QQQ AMEX:SPY
Mag 7 Forecast | TSLA NASDAQ:NVDA AAPL AMZN META MSFT NASDAQ:GOOG

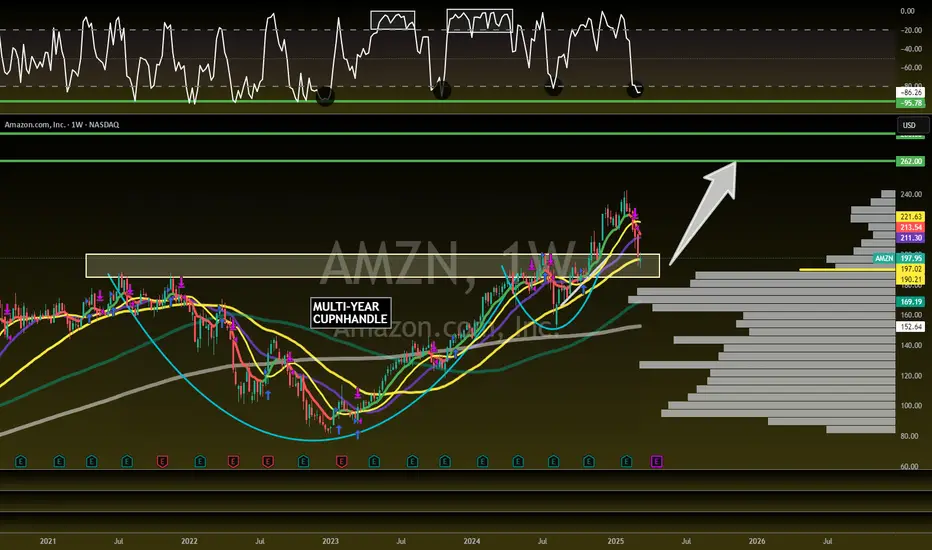
Amazon is the FULL PACKAGE! 62% UpsideNASDAQ:AMZN - H5_W Trade Setup: 🚨
Confirmed CupnHandle Retest =
🎯$262 🎯$280
📏MM: $310
- Multi-Year CupnHandle
- Massive weekly volume shelf
- Green Support Beam on Wr%
- Undervalued MOAT Company
Not financial advice

AMAZON SWING LONG FROM SUPPORT|LONG|
✅AMAZON fell again to retest the support of 190.79$
But it is a strong key level
So I think that there is a high chance
That we will see a bullish rebound and a move up
LONG🚀
✅Like and subscribe to never miss a new idea!✅
Disclosure: I am part of Trade Nation's Influencer program and receive a monthly fee for using their TradingView charts in my analysis.

Amazon is about to DELIVER! 32% UpsideNASDAQ:AMZN
Great Risk/Reward here!
Confirmation of Retest = 🎯$262
- Right at CupnHandle Retest area
- Volume Shelf Support
- 50WMA
- Wr% Green Support Beam
Not financial advice
AMZN Trade PlanLooking to buy AMZN at market price, with additional entries at 187 and 179 for better positioning.
🎯 Profit Target: 210 - 215
Stay disciplined, manage risk, and let the trade develop! 📈📊
⚠️ Disclaimer: This is not financial advice. Always do your own research and trade responsibly! 💡

Is the Stock Market Bottom in? Stock market analysis | NASDAQ:QQQ AMEX:SPY NASDAQ:SMH
Mag 7 Price Forecast | TSLA NASDAQ:NVDA AAPL AMZN META MSFT GOOGL

AMAZON Bullish Bias! Buy!
Hello,Traders!
AMAZON made a bullish
Rebound after the retest
Of the horizontal support
Level of 190.78$ so we are
Locally bullish biased and
We will be expecting a
Further bullish move up
Buy!
Comment and subscribe to help us grow!
Check out other forecasts below too!

AMZN butterfly & $192.The stock trend of Amazon (AMZN) in 2024 showed significant upward movement, with the price reaching a peak of $230 and a low of $145 during the year, driven by strong market performance and investor confidence.
However, In 2025 based on technical analysis, the formation of a Butterfly harmonic pattern suggests a highly probable correction toward the $190 level .
This pattern, often appearing after an extended bullish trend, indicates a potential reversal. Given the current market dynamics, the likelihood of such a drop is considerable.
Investors should closely monitor key support levels and prepare for possible downside risks while making informed decisions.
SEYED.

AMAZON Is it worth buying now?Amazon (AMZN) broke below its 1W MA50 (blue trend-line) last week for the first time since the week of August 05 2024 and opened this week below it. As you can see, the stock has been trading within a 2-year Channel Up and today's candle is as close to a technical Higher Low (bottom) as it can get.
The previous Higher Low was in fact that Aug 05 2024 candle, which despite breaking below the 1W MA50, managed to post a strong intra-week recovery and close above the it. Technically that was the 'Max pain' situation on every 1W bottom candle in those 2 years.
Every Bullish Leg that followed was around +65.24%, so that gives us an end-of-year technical Target of $300.
-------------------------------------------------------------------------------
** Please LIKE 👍, FOLLOW ✅, SHARE 🙌 and COMMENT ✍ if you enjoy this idea! Also share your ideas and charts in the comments section below! This is best way to keep it relevant, support us, keep the content here free and allow the idea to reach as many people as possible. **
-------------------------------------------------------------------------------
💸💸💸💸💸💸
👇 👇 👇 👇 👇 👇

AMAZON at important support. Positive days coming?AMZN looking at good support. We can see positive days if it works.
Many cryptocurrency dominance charts, as well as Nasdaq and other stock charts too, showing the same pattern. Is the reversal starting? Check my other analysis too.
We’ll see.
This is not investment advice. Please do your own research.
Wishing you best.
-YusufDeli
