AMZN 20 Years Long Uptrend - Targets 68/72, Then LowerAMZN Enjoyed a massive bull market for more than 20 years until April 2022 when this massive uptrend failed.
The uptrend ended and the bear market has been fully confirmed.
Now, how much lower can it go?
Mid-term (1-3 months) we are seeing the 72-68 range as the next and main support target.
By June/July next year (2023), it can go as low as 41, depending on how things develop of course.
The last mayor correction lasted about 1.8 years from top to bottom.
This would put the next bottom at around mid 2023.
Namaste.
AMZN

AMZN Potential for Bearish Continuation | 12th December 2022Looking at the H4 chart, my overall bias for AMZN is bearish due to the current price being below the Ichimoku cloud, indicating a bearish market. Look for a sell stop entry at 85.88, where the recent low is. Stop loss will be at 103.78, slightly above where the 23.6% Fibonacci line and recent high is. Take profit will be at 69.43, where the -27.2% Fibonacci expansion line is.
Any opinions, news, research, analyses, prices, other information, or links to third-party sites contained on this website are provided on an "as-is" basis, as general market commentary, and do not constitute investment advice. The market commentary has not been prepared in accordance with legal requirements designed to promote the independence of investment research, and it is therefore not subject to any prohibition on dealing ahead of dissemination. Although this commentary is not produced by an independent source, FXCM takes all sufficient steps to eliminate or prevent any conflicts of interest arising out of the production and dissemination of this communication. The employees of FXCM commit to acting in the clients' best interests and represent their views without misleading, deceiving, or otherwise impairing the clients' ability to make informed investment decisions. For more information about the FXCM's internal organizational and administrative arrangements for the prevention of conflicts, please refer to the Firms' Managing Conflicts Policy. Please ensure that you read and understand our Full Disclaimer and Liability provision concerning the foregoing Information, which can be accessed on the website.

AMZN Can it reverse and go LONGOm a monthly chart from Amazon's beginning to the present.
Amazon was in a sustained uptrend peaking in the summer of 2021.
Since then it has retraced down to the Fib 0.5 level. Price
was more than two standard deviations above the long term
anchored VWAP and is now downtrending into a value area.
The volume profile shows three high volume nodes and price
is currently in the middle node, Finally, the volatility on the
RSI indicator has decreased as had the strength itself.
AMZN is likely setting up for a reversal. Now, is a good time
to buy stock or a long term call option. This is a long idea
for investors not traders.
✅AMAZON LONG FROM SUPPORT🚀
✅AMAZON will be retesting a support level soon
From where I am expecting a bullish reaction
With the price going up but we need
To wait for a reversal pattern to form
Before entering the trade, so that we
Get a higher success probability of the trade
LONG🚀
✅Like and subscribe to never miss a new idea!✅

AMZN: Could it turn BULLISH gain? “Only” if it does THIS!• AMZN lost our key support level, after failing in breaking the 21 ema in the daily chart;
• The volume is still low, a sign of weakness, and in theory, AMZN is seeking the next support at $85;
• Only a miraculous reaction, making it close above the $90.59 again (making this a false breakout), could frustrate this bearish sentiment;
• Either way, this is short-term thinking. If you are looking for a long-term reversal sign, watch the $101 area;
• The $101 is a multiple support/resistance area. Clearly, this is an important key point. Only if AMZN breaks it we might see it seeking higher levels again – maybe filling the last gap around $133;
• For now, let’s focus on the support at $85 and on the short-term resistance at $90. I’ll keep you posted on this.
Remember to follow me to keep in touch with my daily analyses!

AMAZON Rebound Ahead! Buy!
Hello,Traders!
AMAZON is falling down
But the stock is about to retest
The horizontal support from where
We are likely to see a rebound
Towards the target above
Buy!
Like, comment and subscribe to boost your trading!
See other ideas below too!

AMZN Potential for Bullish Rise | 5th December 2022Looking at the H4 chart, my overall bias for AMZN is bearish due to the current price being below the Ichimoku cloud, indicating a bearish market. However, I am looking to play the pullback. So I am looking for a potential buy entry at 92.43, where the 61.8% Fibonacci line is. Stop loss will be at 85.88, where the previous swing low is. Take profit will be at 109.58, where the -27.2% Fibonacci expansion line and 38.2% Fibonacci line is.
Any opinions, news, research, analyses, prices, other information, or links to third-party sites contained on this website are provided on an "as-is" basis, as general market commentary, and do not constitute investment advice. The market commentary has not been prepared in accordance with legal requirements designed to promote the independence of investment research, and it is therefore not subject to any prohibition on dealing ahead of dissemination. Although this commentary is not produced by an independent source, FXCM takes all sufficient steps to eliminate or prevent any conflicts of interest arising out of the production and dissemination of this communication. The employees of FXCM commit to acting in the clients' best interests and represent their views without misleading, deceiving, or otherwise impairing the clients' ability to make informed investment decisions. For more information about the FXCM's internal organizational and administrative arrangements for the prevention of conflicts, please refer to the Firms' Managing Conflicts Policy. Please ensure that you read and understand our Full Disclaimer and Liability provision concerning the foregoing Information, which can be accessed on the website.


AMZN: CONGESTION! How to proceed?• AMZN is in a congestion, as seen in the 1h chart, trading between the black lines as shown above, while the 21 ema is completely flat;
• As long as AMZN remains inside this congestion, hardly we would see something new, however, any breakout could be interesting;
• By losing the support around $90s, AMZN has a target at the gap (red line at $86.82);
• On the other hand, by breaking the resistance around $96s, the next resistance is at $103.78 (previous top);
• Although AMZN seems erratic, these key points might offer us some clues on how to proceed. I’ll keep you updated on this.
Remember to follow me to keep in touch with my analyses!

$AMZN bear flag breakdown to $65-$78?$AMZN has formed a bear flag and it looks like it's about to break down.
If we get the breakdown out of the flag, I think the next target to the downside will be to $65-$78.

AMZN Potential for Bullish Rise | 29th November 2022On the H4 chart, the overall bias for AMZN is bearish . To add confluence to this, price is below the Ichimoku cloud which indicates a bearish market. However, we are looking to play the pullback by placing a buy at 92.43, where the 61.8% Fibonacci line is. Stop loss will be at 85.88, where the previous swing low was. Looking to take profit at 109.58, where the 38.2% Fibonacci line and -27.2% Fibonacci expansion line are located. To add confluence to that take profit area, there is a market gap that looks good to be filled.
Any opinions, news, research, analyses, prices, other information, or links to third-party sites contained on this website are provided on an "as-is" basis, as general market commentary, and do not constitute investment advice. The market commentary has not been prepared in accordance with legal requirements designed to promote the independence of investment research, and it is therefore not subject to any prohibition on dealing ahead of dissemination. Although this commentary is not produced by an independent source, FXCM takes all sufficient steps to eliminate or prevent any conflicts of interest arising out of the production and dissemination of this communication. The employees of FXCM commit to acting in the clients' best interests and represent their views without misleading, deceiving, or otherwise impairing the clients' ability to make informed investment decisions. For more information about the FXCM's internal organizational and administrative arrangements for the prevention of conflicts, please refer to the Firms' Managing Conflicts Policy. Please ensure that you read and understand our Full Disclaimer and Liability provision concerning the foregoing Information, which can be accessed on the website.

BUY amazon stock with high probabilityHello ladies and gentlemen, according to my graphical analysis of amazon stock, there is a high probability of going up in the next few weeks.

False BreakdownLooks like price tried to break to the downside and was stopped with some strong wicks these past few days.
Watching for a gap fill to the upside as it mean reverts back into the moving averages.
Once there, looking for possible short entry at resistances.

AMZN Time To Sellafter the rejection at the Fibonacci rejection zone between 23 and 38 with a triple top reversal pattern we will see a continuation of the downtrend

AMZN FORCAST - on the daily chart : we notice a slight resistant from the buyers that pushes the price up
- on the weekly chart : we notice the resistance is from a strong level that formed few months ago
- my personal opinion : the price will rise after few days from now
- best move : wait for the next week movement to show a strong buying volume as confirmation then go in as buyers

AMZN Potential for Bearish Rise | 25th November 2022On the H4 chart, we have an overall bearish bias for AMZN with price underneath the Ichimoku cloud. We are looking to play a pullback long entry. Looking for a buy at 92.43, where the 61.8% Fibonacci line is. Stop loss will be at 85.88, where the previous low is. Take profit will be at 109.58, where the 38.2% Fibonacci line and -27.2% Fibonacci extension line is.
Any opinions, news, research, analyses, prices, other information, or links to third-party sites contained on this website are provided on an "as-is" basis, as general market commentary, and do not constitute investment advice. The market commentary has not been prepared in accordance with legal requirements designed to promote the independence of investment research, and it is therefore not subject to any prohibition on dealing ahead of dissemination. Although this commentary is not produced by an independent source, FXCM takes all sufficient steps to eliminate or prevent any conflicts of interest arising out of the production and dissemination of this communication. The employees of FXCM commit to acting in the clients' best interests and represent their views without misleading, deceiving, or otherwise impairing the clients' ability to make informed investment decisions. For more information about the FXCM's internal organizational and administrative arrangements for the prevention of conflicts, please refer to the Firms' Managing Conflicts Policy. Please ensure that you read and understand our Full Disclaimer and Liability provision concerning the foregoing Information, which can be accessed on the website

Amazon: A Vision in WhiteAlthough Amazon is currently moving sideways after following a downwards slope, we expect the course to drop down further below the support line at $87.59 to reach the white target zone between $85.73 and $65.73, where wave (IV) in white should hit its low. Afterwards, the course should turn back up and push above the support at $87.59. As soon as the course exceeds this mark, it should wander further North to climb above the resistance line at $104.87 and carry on with the upwards trend. There’s also a 30% chance that Amazon could make it above $104.87 earlier already, thus skipping the white zone.

Amazon to break back above $100?Amazon - 30d expiry - We look to Buy a break of 105.01 (stop at 100.26)
103.78 has been pivotal.
We are trading at oversold extremes.
Prices have reacted from 85.88.
In our opinion this stock is undervalued.
Previous support, now becomes resistance at 105.
A break of resistance at 105 should lead to a more aggressive move higher towards 115.
Our profit targets will be 116.88 and 119.88
Resistance: 95.00 / 101.00 / 105.00
Support: 90.60 / 85.88 / 80.00
Disclaimer – Saxo Bank Group.
Please be reminded – you alone are responsible for your trading – both gains and losses. There is a very high degree of risk involved in trading. The technical analysis , like any and all indicators, strategies, columns, articles and other features accessible on/though this site (including those from Signal Centre) are for informational purposes only and should not be construed as investment advice by you. Such technical analysis are believed to be obtained from sources believed to be reliable, but not warrant their respective completeness or accuracy, or warrant any results from the use of the information. Your use of the technical analysis , as would also your use of any and all mentioned indicators, strategies, columns, articles and all other features, is entirely at your own risk and it is your sole responsibility to evaluate the accuracy, completeness and usefulness (including suitability) of the information. You should assess the risk of any trade with your financial adviser and make your own independent decision(s) regarding any tradable products which may be the subject matter of the technical analysis or any of the said indicators, strategies, columns, articles and all other features.
Please also be reminded that if despite the above, any of the said technical analysis (or any of the said indicators, strategies, columns, articles and other features accessible on/through this site) is found to be advisory or a recommendation; and not merely informational in nature, the same is in any event provided with the intention of being for general circulation and availability only. As such it is not intended to and does not form part of any offer or recommendation directed at you specifically, or have any regard to the investment objectives, financial situation or needs of yourself or any other specific person. Before committing to a trade or investment therefore, please seek advice from a financial or other professional adviser regarding the suitability of the product for you and (where available) read the relevant product offer/description documents, including the risk disclosures. If you do not wish to seek such financial advice, please still exercise your mind and consider carefully whether the product is suitable for you because you alone remain responsible for your trading – both gains and losses.

AMZN: We nailed the TOP! What to expect next?• Since our last analysis on AMZN, we nailed the top on it, thanks to our Multi Time Frame Analysis (MTFA) in the 1h and D charts (link to our previous analysis below this post, as usual);
• Now, AMZN is in a bear trend in both, 1h and D charts. In theory, it is supposed to fill gap at $86.82;
• Only if AMZN does a strong bullish reaction, and breaks the 21 ema (1h) we would see this bearish scenario frustrated;
• If AMZN reacts, and breaks the $101 area seen in the daily chart, it would trigger a mid-term reversal structure, a bullish pivot point;
• Therefore, this trend will be dictated on how it’ll react in the 1h chart, and if it breaks the $101 in the daily chart. I’ll keep you guys updated on this, but for now, let's kee these key point in mind.
Remember to follow me to keep in touch with my analyses!

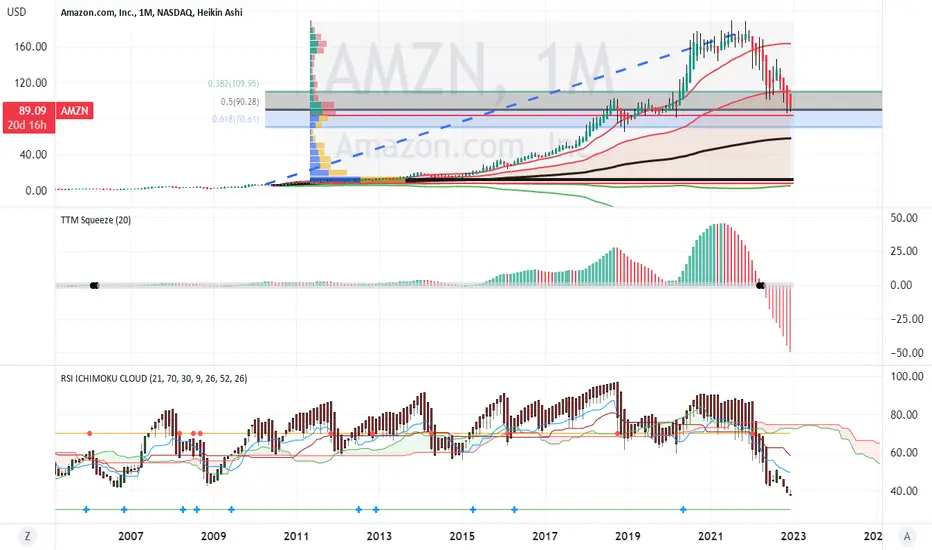
Amazon, Inc. Since 2000 (22 Years - Worrisome To Say The Least)I got scared when I saw this chart... Maybe that is why Jeff Bezos is planning on laying off a lot of people...
Let me show you.
AMZN right now is trading right at strong/long-term support.
This critical support is the consolidation box/range from June 2018 through March 2020. This is marked light blue on the chart.
Now, we have strong bearish signals developing and as you can see when you move your eyes to the left... We have 22 years to correct.
Ok, let's start with the signals:
- We have a bearish cross between EMA10 and EMA50.
- Qstick and RSI strongly bearish.
- 4 Months closing red spells doom.
- The other stocks aren't looking good.
The 0.5 Fib. retracement level for the 20+ year bullish wave has been lost as support. That is $94.47. This is a once in a lifetime event.
The next Fib. support level is the golden ratio at $72.24... That's the main target on the monthly timeframe.
If this level breaks, 0.618 Fib., $40 enters the game.
CHANGE
Amazon (AMZN) needs to break and close above $116 monthly for some bullish air to enter the chart.
Any trading below this level and this chart analysis remains valid.
Thank you for reading.
Remember to always plan ahead; long-term.
Namaste.

Add to Amazon longsAmazon looks set to blow right up here and close all the purple lines (gap fills)) on this daily time frame chart . NY times article today about 10,000 lay offs should drive this higher as with META last week. I expect this to go on and take out ATH's within a few years- but still have to be cautious until bear market is negated. Nevertheless Amazon is a great long term buy and hold here. We will likely see a fake break of the 100 and this will take us up to 110 and more.
N.B. just keeping all the resistance lines (red) on this chart to show potential take profit points for shorter term traders. Green lines are support.

🔴SELL ZONES & DEMAND ZONES🟢Get used to detecting SELL ZONES & DEMAND ZONES.
This is one of the easiest TA and most effective.
This is AMZN 1 hr TF.
Should be pretty self-explanatory.
I draw these zones on multiple time frames, the larger the time frame the stronger the probability of the zone to be true.
So pretty much, you'd want to buy when you're in the buy zone, or close enough.
And vice versa when it comes to selling.

TSLA wedgeDescending wedge on the 3H chart, Trends are your friends...retested that trend line a few times will wait for it to pull through and retest before entering some monthlies
Trade safe and have fun!
Like and follow for more like this!
