Amazon´s downtrendAmazon was marked with a huge growth during the COVID period which makes us focus on the behaviour of the stock within the rectangle of that period. And we notice here that we have a support at 143 and within the rectangle we can notice the oscillation of the price. This also marks a curve format that leads us to the downtrend starting from April 2022.
So, following the trend line above we expect that the price will first rise following the curve in the rectangle then drops either to 124 or 101 which is the limit of the rectangle.
AMZN

AMZN: A breakout from a Congestion Zone! What's next?• AMZN triggered the bullish sign we discussed last week, by breaking the $117 area, and it is behaving just as we expected. As usual, the link to my last analysis is below this post;
• Now that it is not in a congestion anymore, AMZN is free to seek its next resistances. Ideally, it would fill the gap at $136 in the next days – Remember, gaps work as magnets during reversals;
• AMZN is consistently trading above the 21 ema, which is good, but the reversal is still on early stages, and any bearish reaction could frustrate the bullish thesis;
• What kind of reaction could make AMZN reject the bullish thesis? If it loses $117 again it wouldn't be good. If it triggers a bearish reversal structure, it would be worse. So far, there’s no technical bearish reversal structure around, just an important resistance level, as seen in the daily chart below;
• The main problem on AMZN is the 21 ema, as any bearish top sign around this area would give us the impression of a Dead Cat Bounce, just for AMZN to resume the drop all the way down to $112 again, or even to the $102;
• Therefore, the situation is still delicate, and AMZN still has a few challenges before truly reversing this bearish sentiment;
• For now, let’s keep our eyes open around the $117 - $118 area;
I’ll keep you guys updated on this. Remember to follow me for more analysis like this! Keep in touch.

AMZN Set this range drop focus wedge for the long term if we fail to hold this channel and fall out of the accumulation zone in the center. Watching this macro vision. lets see how it plays. Enjoy the simple Art

AMZN: Next targets + Trend analysis!• AMZN is doing some range trading since September 23;
• Its support is at $112.06, while its resistance is at $118.70;
• The momentum is still bearish, and we don’t see any reversal pattern confirmed yet. In this case, we can assume AMZN will lose the support and seek the next target at $102 (the next support level);
• Is there any chance of a reversal? Yes. By breaking the resistance, it’ll trigger a technical mid-term reversal, and the next resistance at $136 would be the next target;
• The open gap near the next resistance will probably help the bullish thesis. Remember, gaps work as magnets during reversals;
• For now, AMZN is neutral, and the volume confirms this, as it stabilized along with the price;
• To whatever side AMZN breaks, I see a good movement in sequence. Let’s pay attention to these key points for now.
I’ll keep you guys updated on this. Remember to follow me for more analysis like this! Keep in touch.

AMZN Potential for Bearish Continuation| 3rd Oct 2022On H4, with the price moving below ichimoku cloud , we have a bearish bias that the price may drop from the sell entry at 112.92, which is in line with the 100% fibonacci projection and 78.6% fibonacci retracement to the take profit at 103.96, where the swing lows and 141.4% fibonacci projection are. Alternatively, the price may rise to the stop loss at 118.11, where the previous swing highs are.

AMZN Potential for Bearish Continuation| 3rd Oct 2022On H4, with the price moving below ichimoku cloud, we have a bearish bias that the price may drop from the sell entry at 112.92, which is in line with the 100% fibonacci projection and 78.6% fibonacci retracement to the take profit at 103.96, where the swing lows and 141.4% fibonacci projection are. Alternatively, the price may rise to the stop loss at 118.11, where the previous swing highs are.

AMZN 90% Retrace from $102 where it started to uptrend.NASDAQ:AMZN
AMZN after the split it fell to $102 where there is strong support. Those levels was tested for 2-3 weeks. If it breaks 102 and breaches the $98.
It can go to 85. For the Bullish case. If we hold 110 - 105 it could consolidate at those levels.

AMZN: This structure could REVERSE the bear trend!• AMZN is in a bear trend, as it is doing nothing but lower highs/lows, and there’s no sign of reversal yet;
• In addition, AMZN is trading below the 21 ema, which is working as a resistance;
• Since it is a bear trend and there’s no confirmation of a reversal, the area near $100 is the next support level;
• However, a possible bullish structure could reject this thesis. If AMZN breaks the previous resistance at $117 (black line), it’ll break the bear trend by doing a higher high/low, and by breaking the 21 ema;
• This reversal would have a target at the last gap ($136 – green line), however, there’s no confirmation that AMZN will trigger this bullish pivot point;
• In the daily chart, we see why the $117 is important. It is not just the previous top in the 1h chart, but the previous top twice, in June and July;
• In addition, AMZN is below the 21 ema in the D chart as well, and this point will probably work as a resistance in the future. Still the gap around $136 would be the ideal target;
• However, in the lack of confirmation, AMZN will just seek the next bottom at $102, therefore, it is important to see some reaction as soon as possible if it wants to avoid this scenario.
Remember to follow me for more analysis like this! Keep in touch.

Amazon in potential head and shoulders.Amazon - 30D expiry - We look to Sell at 124.94 (stop at 130.11)
A bearish Head and Shoulders is forming.
Selling continued from the 50% pullback level of 123.92.
Bespoke resistance is located at 125.00.
Resistance could prove difficult to breakdown.
Daily signals are bearish.
128.99 has been pivotal.
Our profit targets will be 113.22 and 109.22
Resistance: 118.00 / 125.00 / 130.00
Support: 112.00 / 107.00 / 102.00
Daily picture
Disclaimer – Saxo Bank Group. Please be reminded – you alone are responsible for your trading – both gains and losses. There is a very high degree of risk involved in trading. The technical analysis , like any and all indicators, strategies, columns, articles and other features accessible on/though this site (including those from Signal Centre) are for informational purposes only and should not be construed as investment advice by you. Such technical analysis are believed to be obtained from sources believed to be reliable, but not warrant their respective completeness or accuracy, or warrant any results from the use of the information. Your use of the technical analysis , as would also your use of any and all mentioned indicators, strategies, columns, articles and all other features, is entirely at your own risk and it is your sole responsibility to evaluate the accuracy, completeness and usefulness (including suitability) of the information. You should assess the risk of any trade with your financial adviser and make your own independent decision(s) regarding any tradable products which may be the subject matter of the technical analysis or any of the said indicators, strategies, columns, articles and all other features.
Please also be reminded that if despite the above, any of the said technical analysis (or any of the said indicators, strategies, columns, articles and other features accessible on/through this site) is found to be advisory or a recommendation; and not merely informational in nature, the same is in any event provided with the intention of being for general circulation and availability only. As such it is not intended to and does not form part of any offer or recommendation directed at you specifically, or have any regard to the investment objectives, financial situation or needs of yourself or any other specific person. Before committing to a trade or investment therefore, please seek advice from a financial or other professional adviser regarding the suitability of the product for you and (where available) read the relevant product offer/description documents, including the risk disclosures. If you do not wish to seek such financial advice, please still exercise your mind and consider carefully whether the product is suitable for you because you alone remain responsible for your trading – both gains and losses

AMZN - To Test SupportAMZN sell volume is still high and on the downside, it will retest 110 support level before rise to resistance at 132.
Disclaimer
This information only serves as reference information and does not constitute a buy or sell call. Conduct your own research and assessment before deciding to buy or sell any stock.

2X $AMZN TP3 HIT for 18%! (PERFECT SETUP)$AMZN printed when it broke out of the rising wedge with a $25 move! it filled the gap and came back to retest the TP1/Support area, and proceeded to head to TP3. We are playing the next leg down and holding on to the position even more if it breaks TP4 with strong momentum!

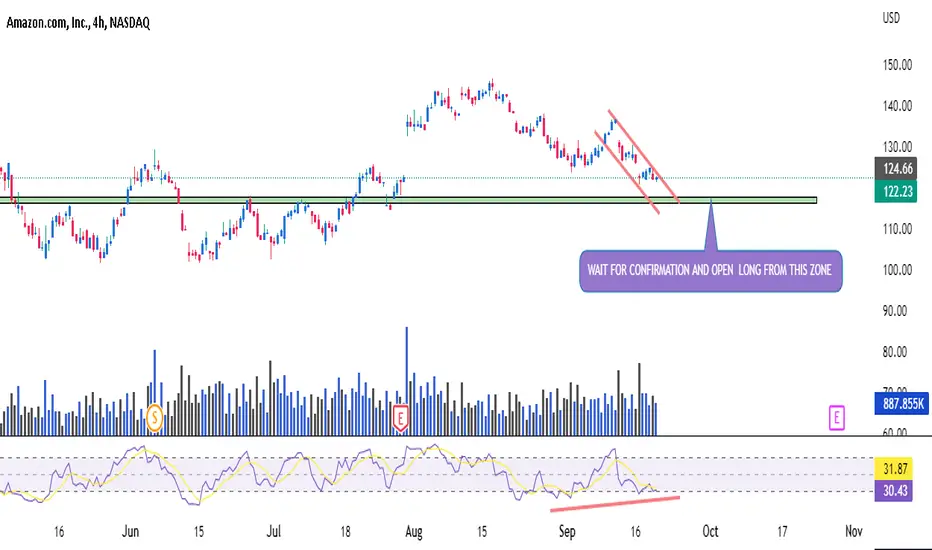
AMZNHELLO GUYS THIS MY IDEA 💡ABOUT AMZN is nice to see strong volume area....
Where is lot of contract accumulated..
I thing that the Seller from this area will be defend this SHORT position..
and when the price come back to this area, strong SELLER will be push down the market again..
DOWNTREND + Support from the past + Strong volume area is my mainly reason for this short trade..
IF you like my work please like share and follow thanks
TURTLE TRADER 🐢

AMZN H16: 40% correction PT BEARS 85 USD short it(SL/TP)(STOCKS)Why get subbed to me on Tradingview?
-TOP author on TradingView
-STOCKS/CRYPTO/FOREX
-2000+ ideas published
-15+ years experience in markets
-Professional chart break downs
-Supply/Demand Zones
-TD9 counts / combo review
-Key S/R levels
-No junk on my charts
-Frequent updates
-Covering FX/crypto/US stocks
-before/after analysis
-24/7 uptime so constant updates
🎁Please hit the like button and
🎁Leave a comment to support our team!
AMZN H16: 40% correction PT BEARS 85 USD short it(SL/TP)(STOCKS)
IMPORTANT NOTE: speculative setup. do your own
due dill. use STOP LOSS. don't overleverage.
🔸 Summary and potential trade setup
::: AMZN H4 chart review and outlook
::: updated/revised outlook
::: SHORT HIGH alerted previously
::: on July 21st currently BEARS
::: making money / congrats
::: no upside in this market
::: FED just did an aggressive HIKE
::: expecting more losses in Q3/Q4 2022
::: BEARS hold until FINAL TP at 85 USD
::: maxed out already
::: Currently DISTRIBUTION already completed
::: we broke down on heavy volume
::: this is NASTY looking chart
::: BAD for the BULLS / stay out
::: FED rate hikes incoming / FED PUT is GONE
::: short sell rips/rallies in the throwback move
::: expecting backtest of the recent Distribution Range
::: recommended strategy: SHORT IT / STAY OUT
::: up to 40% correction still possible from here
::: fair value for AMZN is 85/95 USD
::: DO NOT BUY/HOLD here this is NOT A DIP
::: This is stock market meltdown in progress
::: be careful / don't get ran over by the FED
🔸 Supply/Demand Zones
. N/A
RISK DISCLAIMER:
Trading Crypto, Futures , Forex, CFDs and Stocks involves a risk of loss.
Please consider carefully if such trading is appropriate for you.
Past performance is not indicative of future results.
Always limit your leverage and use tight stop loss.

Beginning of an End (Update on Uber 3)Uber is at the peak of driver's dissatisfaction. Will bribery rescue it once again? No.
It is beside the company's debts and cyber security weakness.
It got no future...

𝗧𝗲𝘀𝗹𝗮 𝗨𝗽𝗱𝗮𝘁𝗲: $TSLA Daily. Bearish Divergence Blue pill or red pill? 💊 First time with bearish divergence on the daily in ~2 years
$QQQ $NQ_F $NDX $AAPL $MSFT $SOX $ES_F $SPY $SPX $TLT $TNX $VIX #Stocks 📉

AMZN Potential for Bullish Momentum | 22nd September 2022On H4, with the price is showing a bullish pennant pattern, if the price rise to the buy entry at 137.29, which breakout the ascending trendline, we would hold a bullish bias that the price may rise to the take profit at 169.09, where the swing high is. Alternatively, the price may drop to the stop loss at 125.39, where the overlap support is.
Any opinions, news, research, analyses, prices, other information, or links to third-party sites contained on this website are provided on an "as-is" basis, as general market commentary, and do not constitute investment advice. The market commentary has not been prepared in accordance with legal requirements designed to promote the independence of investment research, and it is therefore not subject to any prohibition on dealing ahead of dissemination. Although this commentary is not produced by an independent source, FXCM takes all sufficient steps to eliminate or prevent any conflicts of interest arising out of the production and dissemination of this communication. The employees of FXCM commit to acting in the clients' best interests and represent their views without misleading, deceiving, or otherwise impairing the clients' ability to make informed investment decisions. For more information about the FXCM's internal organizational and administrative arrangements for the prevention of conflicts, please refer to the Firms' Managing Conflicts Policy. Please ensure that you read and understand our Full Disclaimer and Liability provision concerning the foregoing Information, which can be accessed on the website.

AMZNHELLO GUYS THIS MY IDEA 💡ABOUT AMZN Thank you
IF you like my work like and follow Thanks
TURTLE TRADER 🐢
AMZN RISING WEDGEAMZN current trading inside of this rising wedge. Short on a break of the formation down to the 120.66 level.
Long on the invalidation of the patter to the top of the gap at 125.51 (white line).
Note All setups require indexes to be moving in the same direction.

𝗡𝗮𝘀𝗱𝗮𝗾 𝗨𝗽𝗱𝗮𝘁𝗲: $QQQ Daily. 🐂 trap + wave 3𝗡𝗮𝘀Got a 🐂 trap above the 200dma to complete B wave. As I've stated, we appear to be in a wave 3 on a few time frames. 300 the pivot
$NQ_F $NDX $AAPL $MSFT $SOX $ES_F $SPY $SPX $TLT $TNX $VIX #Stocks 📉

Bitcoin is following the same pattern as Amazon during 1997-2001Idea from Michael J Kramer.
#bitcoin of 2022 vs. $amzn of 2000 ... #Bitcoin has further to go.

AMZN: Bearish setup!!!Amazon, Inc look very interesting to short in weekly timeframe.
So, I love to trade stocks in big timeframe as the big benefit it's the patience and trade in big timeframe we could to earn a lot money in medium to long term and being disciplined.
So, I'm analyzing that Amazon look bearish in weekly timeframe that we could to get benefit trade in bearish trend. Also if you trade in Daily, still bearish. I like to trade stock and crypto in over Day timeframe and also swing trading are the best strategy to do, for me.
So, I'm bearish in Amazon, as the same stock market and cryptocurrencies.
Good luck!!!
Remember,I have another account to trade stock and crypto market, but I have another account just to trade Forex. What we could to get good benefit for our investment.

AMZN Hrly shortAMZN Hrly short
Shortstop @ 127.19
TP #1 @ 125.78 85% wr
TP #2 @ 123.34 58.21% wr
SL @ Swing high 136.39 2.99% hr
All trades come from a technical program, see past trades for results. More trades like this on Bifrost Trades.

AMZNHELLO GUYS THIS MY IDEA 💡ABOUT GOLD AMZN is nice to see strong volume area....
Where is lot of contract accumulated..
I thing that the Seller from this area will be defend this SHORT position..
and when the price come back to this area, strong SELLER will be push down the market again..
DOWNTREND + Support from the past + Strong volume area is my mainly reason for this short trade..
IF you like my work please like share and follow thanks
TURTLE TRADER 🐢
