AMZN Elliott waveWe are currently going through an ABC correction into the 5 wave next week. I provided the Fibonacci trend base extension levels.
AMZN

Nice 3 day move in QQQsQQQs have had a nice 3 day move clearing its downtrend line. If it consolidates here for a few sessions and holds $300 area, will then look for it to then move towards next target area of $315. Next week will be crucial with big tech earnings (AAPL, GOOGL, META, AMZN etc.) along with the Fed

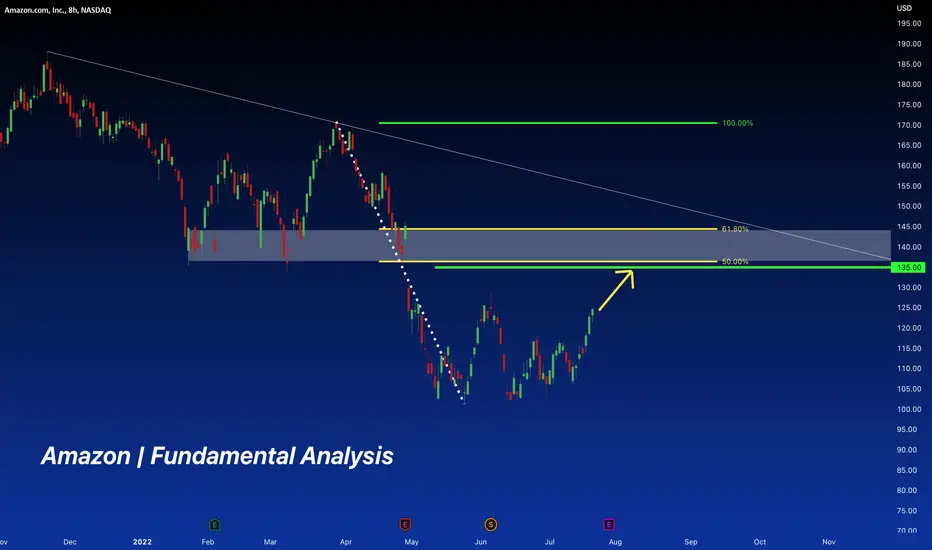
Amazon | Fundamental Analysis | Long Amazon will report its Q2 2022 results after the market closes on Thursday, July 28. An analyst call is scheduled for the same day at 5:30 p.m. ET.
Investors will likely approach the e-commerce and technology giant's report with some caution. Last quarter, the company's earnings fell short of Wall Street's expectations, while revenues were in line with the consensus forecast. While investors were undoubtedly unhappy with the final result, they were likely more concerned about the company's earnings outlook for the second quarter. It was significantly lower than analysts had forecast.
Investors are increasingly concerned about the macroeconomic situation. So far, continued high inflation has not had much of an effect on consumer spending overall. That could change, however, as more and more consumers are becoming concerned that the U.S. economy could slide into recession. If many consumers markedly reduce their discretionary spending, Amazon's e-commerce results would suffer.
Nevertheless, investors should be mindful of the bigger picture, as this company has seemingly countless current and potential long-term growth opportunities.
Here's what to watch out for in Amazon's upcoming report.
While Amazon does not make earnings guidance, it does in terms of operating results. Management expects operating results to range from an operating loss of $1 billion to an operating income of $3 billion. The company had $7.7 billion in operating income in last year's quarter.
The company faces a difficult comparable performance since it had a strong performance last year. One factor adding to the difficulty of comparisons is the postponement of its annual Prime Day event from Q2 last year to Q3 of this year. In addition, currency headwinds likely affected second-quarter earnings, as the U.S. dollar has strengthened against other currencies over the past year.
By comparison, Amazon's Q1 revenue rose 7% year over year (and 9% in constant currency) to $116.4 billion, a result that was in line with Wall Street's expected $116.3 billion and close to the upper end of the company's forecast range of $112 billion to $117 billion. By segment, sales in North America and Amazon Web Services rose 8% and 37%, respectively, while sales in the international segment fell 6%.
Last quarter's net loss was $3.8 billion, or $7.56 per share ($0.38 per share given the 20-for-1 stock split in June). This compared to a net income of $15.79 per share a year ago. That result was well below the consensus forecast of analysts, who had an expected net income of $8.48 per share.
Much of the shortfall was due to a $7.6 billion pre-tax loss from Amazon's investment in the common stock of electric car maker Rivian Automotive, which held an initial public offering (IPO) last November. Had this article not been in place, Amazon would have made a net profit, not a loss. However, it still would not have met Wall Street's expectations.
Amazon stock is likely to rise if management's Q3 outlook differs significantly from Wall Street's expectations.
The company provides a revenue forecast, but not an earnings forecast. However, the operating income forecast usually gives investors a rough idea of what percentage change management expects for the year.
Currently, analysts are predicting that Amazon's Q3 revenue will grow 15% year over year to $127.8 billion and that earnings per share will increase 16% to $0.36. Keep in mind that this quarter will get a boost from Prime Day compared to the Q2 last year.
$AMZN bearish wedge on the 15mMarket has been ripping hard lately, a classic bear market rally. Going back to almost the start of the month a bearish wedge has developed. Holding 105p for November and 122p expiry tomorrow.
GL HF!

SPY Critical positionIf you read my last idea on SPY the recent Bull rally does not come in as a surprise. With the being said it appears the spy is at a critical level, in the trend, what happens today could determine the fate of the spy for the short term and possibly long term. Will the bull rally continue? If we look at the chart the higher price action is being achieved with lower then normal daily volume average, which shows us the state of liquidity in the markets now. My best guess is that higher price action without meaningful volume is unsustainable. Also keep in mind that FOMC meeting next week could also serve as a bear catalyst potentially. Traders be cautions, best of luck to all.
This is not financial advice, this is just my personal idea.

AMZN H4: 30% CORRECTION PT BEARS 90 USD SHORT IT(SL/TP)(STOCKS)Why get subbed to me on Tradingview?
-TOP author on TradingView
-15+ years experience in markets
-Professional chart break downs
-Supply/Demand Zones
-TD9 counts / combo review
-Key S/R levels
-No junk on my charts
-Frequent updates
-Covering FX/crypto/US stocks
-24/7 uptime so constant updates
AMZN H4: 30% CORRECTION PT BEARS 90 USD SHORT IT(SL/TP)(STOCKS)
IMPORTANT NOTE: speculative setup. do your own
due dill. use STOP LOSS. don't overleverage.
🔸 Summary and potential trade setup
::: AMZN H4 chart review and outlook
::: maxed out already
::: Currently DISTRIBUTION already completed
::: we broke down on heavy volume
::: this is NASTY looking chart
::: BAD for the BULLS / stay out
::: FED rate hikes incoming / FED PUT is GONE
::: short sell rips/rallies in the throwback move
::: expecting backtest of the recent Distribution Range
::: recommended strategy: SHORT IT / STAY OUT
::: up to 40% correction still possible from here
::: fair value for AMZN is 85/95 USD
::: DO NOT BUY/HOLD here this is NOT A DIP
::: This is stock market meltdown in progress
::: be careful / don't get ran over by the FED
🔸 Supply/Demand Zones
. N/A
RISK DISCLAIMER:
Trading Crypto, Futures , Forex, CFDs and Stocks involves a risk of loss.
Please consider carefully if such trading is appropriate for you.
Past performance is not indicative of future results.
Always limit your leverage and use tight stop loss.

Amazon Wyckoff SetupInstitutional Selling presents itself as wyckoff in Amazon. There was institutional selling as short profit taking and then institutional buying as there was anticipation for higher prices. However, there must have been bad news--bearish anticipation as we approached July and October, because we failed to commit outside of the range we were in. This brings us to a new idea.
Higher prices does not mean bullish outcomes.
many retail traders, dumb money, poor traders will enter trade positions into the tops of the range ( trust me, there are a few who enter BIG). thus, all along it was a bull trap, the beginning of the end. As a sidenote, for those who use wyckoff, it is absolutely necessary to confirm phases from other phases. This is how your precision is increased. Phase c is the hardest to confirm. with other confirmations though, you are able to improve your accuracy.


SPY WHATS NEXT??!!It appears the spy has found a landing zone, and may now be in the accumulation phase, Using the Wyckoff Accumulation method, I analyzed what may occur over the next few trading weeks. In the short term I believe SPY is bullish and looking to retrace to the .618 Fib resistance ($390) within a few days and eventually retracing the .786 fib ($400). After that Based on the wyckoff method, it may breakdown, given the marco-economics of the entire market being bearish , with alot of fear and uncertainty amid a recession on the horizon (if were not already), and the feds hawkish aim to control inflation , we may have a sell off that could lead below previous lows, as highlighted in the chart.
Strategy 1: buy $400 calls expiration 8-19-22
Sell: First Target price $390 followed by $400
Startegy 2: If SPY reaches $400, Buy PUT 21 days from expiration ideally strike of $390
Alternatively SPY could break over $400 and continue to rally and possibly reverse to the upside despite macro conditions.
DISCLAIMER: I am not a financial advisor, I do not advise anyone to buy or sell anything, these are just my own ideas for my own use, trade at your own risk.

AMAZON Generational Bottom and buy opportunityAmazon (AMZN) has been trading within the MA300 (red trend-line) and MA200 (orange trend-line) on the 1W time-frame for more than 2 months. In multi-year terms, this is the equivalent of a bottom formation within the Bullish Channel that started after the bottom of the Dotcom crash in September 2001.
More specifically, the 1W MA300 hasn't been touched since January 2009 (bottom of the housing crisis) and the last time a (Higher) Low was formed within the 0.236 - 0.382 Fibonacci retracement levels (Fib Channel applied on the pattern) was within October 2014 - January 2015.
With the 1W RSI rebounding after breaking inside its multi-decade Buy Zone (has done so only another 3 times in 21 years) and the 1W LMACD inevitably about to make a Bullish Cross, this seems like a golden multi-year buy opportunity for Amazon. The Higher High target has been the 0.786 Fibonacci level since late 2018.
--------------------------------------------------------------------------------------------------------
Please like, subscribe and share your ideas and charts with the community!
--------------------------------------------------------------------------------------------------------

Amazon primed for 100probably because they cancelled "Night Sky" which was a seriously good series. No, actually it just needs to complete the B wave. Longs should hedge IMO. C should fill the gap near 136, but maybe not.

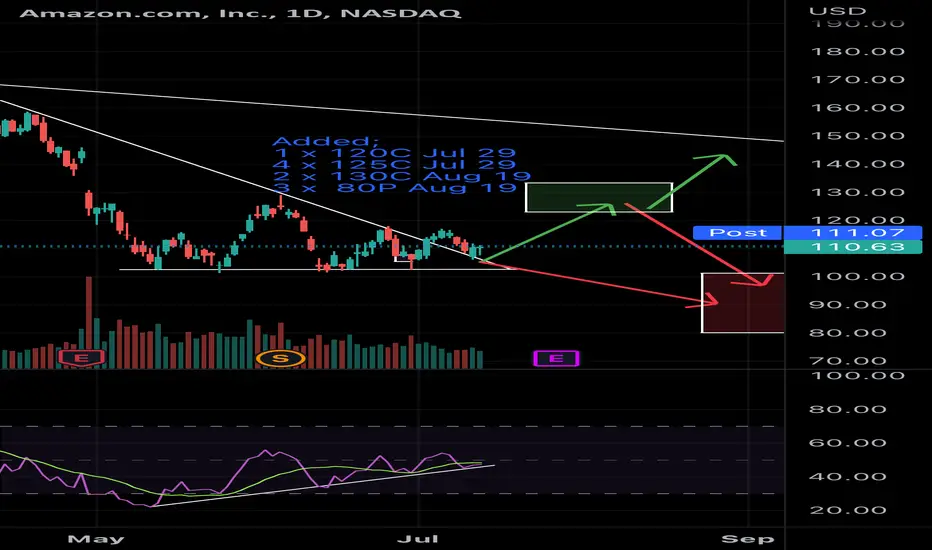
Amazon earnings Hey guys,
I’m really looking forward to amazing earnings!
Little biased here leaning towards the topside although my options spread does include bottom side cover.
I noticed Amazon broke out of the diagonal trend last week which I took some profits on… And retested yesterday with a little bit of a pop.
I’m expecting to see some excitement (next week) before earnings and planning on opening other straddle (earnings week) favouring the downside into early September.
This options spread cost around 9.5 credits and I feel fresh having both ends covered until Aug 19.
AAPL 8HOURS :30% CORRECTION PT BEARS 115USD SHORT IT(SL/TP)Why get subbed to me on Tradingview?
-TOP author on TradingView
-15+ years experience in markets
-Professional chart break downs
-Supply/Demand Zones
-TD9 counts / combo review
-Key S/R levels
-No junk on my charts
-Frequent updates
-Covering FX/crypto/US stocks
-24/7 uptime so constant updates
AAPL 8HOURS :30% CORRECTION PT BEARS 115USD SHORT IT(SL/TP)(STOCKS)
IMPORTANT NOTE: speculative setup. do your own
due dill. use STOP LOSS. don't overleverage.
🔸 Summary and potential trade setup
::: AAAPL 8HOUR chart review and outlook
::: maxed out already
::: Currently DISTRIBUTION STAGE
::: we broke down on heavy volume
::: this is NASTY looking chart
::: key S/R TL support turn resistance now
::: expect selling from overhead / 50% backtest
::: BAD for the BULLS / stay out
::: FED rate hikes incoming / FED PUT is GONE
::: Record June 2022 CPI print >9%
::: expect aggressive FED rate hikes going forward
::: short sell INTO BOUNCE near 155 USD
::: recommended strategy: SHORT IT / STAY OUT
::: up to 30% correction still possible from here
::: fair value for AAPL is 115/120 USD
::: DO NOT BUY/HOLD here this is NOT A DIP
::: This is stock market meltdown in progress
::: be careful / don't get ran over by the FED
::: maybe we can get a BOUNCE/RALLY later
::: September/October 2022 - until then - STAY OUT!
🔸 Supply/Demand Zones
. N/A
RISK DISCLAIMER:
Trading Crypto, Futures , Forex, CFDs and Stocks involves a risk of loss.
Please consider carefully if such trading is appropriate for you.
Past performance is not indicative of future results.
Always limit your leverage and use tight stop loss.

NAS100 [US100] Daily Outlook | July 14Long Term Outlook:
Looking at NAS100 Daily TF, the instrument remains bearish until 12949.00 level is broken. I see a trend-line joining 13500, 12949 and 12175 indicating that price may yet see 11163 area with enough volume .
Short Term Outlook:
a. Market is ranging between 11725.42 and 11644.00 (Range 0) and 1HR break and closure above 11725 zone will make price to test 11937 area (Range 1).
b. On the other hand, the break and closure of 1HR price bar below 11644.00, we may yet see a dip down to 11407.97 (range 3) with partials closure at 11533.51 (range 2)
Let me know what you think on the comment section.
NOTE: I trade NAS100 live from Mon-Fri at 8:45 AM EST/ 4:45 PM GST
Join the winning team!
-Kings

AMZN targets the 92-82 pandemic D.bottom low & Vol Profile zone?AMZN has been making an ABC correction since the 188 ATH. The decline was very fast once it failed
to hold the 150 volume profile zone. It has retraced exactly to 101, the 0.854 FIB of the 82 pandemic low to ATH. There was a little bounce but AMZN basically is just hovering around the 2016 TL while consolidating inside my red box without breaking the downtrend line.
LOOKING BEARISH. I think AMZN will target the pandemic low at 82 to make a double bottom ending hew
ABC correction. 82 is also the 0.618 FIB retracement from 14.20 (2015 low) to ATH. 82 is also the 1.618
Fib Extention of the ABC correction, making it a very strong support.
WARNING: There may still be a 20% downside from latest low at 101 as consumer discretionary will be the
first to suffer during an economic downturn.
Not trading advice

AMZN inside dayInside day on AMZN. This can be traded both ways. Break of fridays range should see good move.
118C or 112P can work for JUL15

AMZN AnalysisPrice is on a downtrend. Seems like a wyckoff accumulation schematic has started with a change in character. However, price has created sell-side liquidity with a bullish POI nearby. I'm expecting a short term bearish move to take the liquidity and tapping into the bullish POI before we see any uptrend.

AMAZON BREAKOUT $AMZNI believe Amazon is ready to break out after being in an Accumulation phase since the beginning of May, The Head and Shoulder Pattern was denied as buyers stepped at the 105-107 price level, and the large volume on June 30 confirms it. My entry Price would be $117, with an exit price of about $120. Alternatively, if price falls Below $112 it would indicate that there is a bigger correction period, and would be a good short opportunity it could easily drop below $100.
I am not a financial advisor, and this is just my personal view.

$AMZN momentum cooling off.$AMZN has been trending up after hitting is lowest of this year since the split and bouncing back up, taking advantage of the market rally. making AMZN a buy for some momentum traders. with the new economic data coming in this week. i expect the market to cool off its rally after its five day bullish streak.
The average move of AMZN per day is about $2.00-3.00 depending on market conditions and news.
here my price target for $AMZN for monday 07/11/22.
============================================================
For calls; buy above $116.00 and sell at 117.04 or above
For puts, buy below 114.69 and sell at 13.69 or below
============================================================
Welcome to this free technical analysis . ( mostly momentum play )
I am going to explain where I think this stock might possibly go the next day or week play and where I would look for trading opportunities
for day trades or scalp play.
If you have any questions or suggestions on which stocks I should analyze, please leave a comment below.
If you enjoyed this analysis, I would appreciate it if you smashed that LIKE button and maybe consider following my channel.

Tech Reversal In Play: Allow Price Action To PlayoutThe market complexion has changed greatly from "there is no chance of a recession" to "well, maybe there could be a recession" as the economic data continues to deteriorate. Continuing Jobless Claims in the United States increased to 1.375M in the week ending June 25 of 2022 from 1.324M in the previous week. The number of Americans filing new claims for unemployment benefits rose by 4K to 235K in the week that ended July 2nd, compared to market expectations of 230K, suggesting labor market conditions could be moderating.
But, I think it is just getting started as many companies are laying off and cancelling employment offers. These activities take time to get into the system and "The Counting Rule" is... they must be actively looking in-order to be counted. So, don't hold your breadth. And keep in mind the Fed will remain hiking rates, while the ECB will eventually need to jump on this wagon.
Speaking of the ECB.
The United States is acting as-if The Federal Reserve Raising Interest Rates solves everything. Government Debt in the United States increased to 30,499,619 Trillion in May from 30,374,155 Trillion in April of 2022.
The US Debt to GDP increased to 137% from 128%. They act as-if there is nothing for the public to worry about; however, many issues have not begun to trickle into the US, as far as we're concerned.
🥶Winter is going to be a huge test for the US and so will the household debt crisis -- not yet discussed in media as companies are trying to figure out how to keep consumers spending (e.g. buy now; pay later).
But, raising rates does not stop the government from spending, nor does it stop the government from issuing more debt. We also have other factors in play such as the Federal Reserve Balance Sheet, M2 Money Supply, and WH Executive Orders at play here.
HOWEVER.... The point of this post is the "very tight" interconnection between the US and UK.
Remember it is a global market and just like the global market crash of 1929 we are more connected today than ever before.
👉 The US and UK are at EXTREME levels of government debt and both facing economic collapse scenarios.
😳 If the UK goes down - don't think for a minute that the US cannot go along with it. You have seen my recent post about the US Liquidity Swaps, right? If not, scroll down the news feed and you'll see it.
Nevertheless, through my external analysis of the markets (with annotated charts) there remains a very-strong conviction that the recent lows of the financial markets will be tested and broken. This also takes into account the Federal Reserve Balance Sheet and the fact the Government Debt continues to expand against the GDP.
Downside targets for the SPX and NDX
NDX = T1 9,538; T2 8,200 (current price is at 12,109.05)
SPX T1 3,040; T2 = 2,750 (current price is at 3,902)
I GET IT... Many will not be supportive of the above, nor have many been on my Public Posts within TradingView; however, the same people bashing never seem to return when the outcomes play out. I am not here to say, "see, I told you so" or anything of that nature - as I'm providing my thesis into all the posts I provide with thorough assessments into the global markets and not based on raw emotions.
I really hope this post (and others) have been informative, helpful, or at least worthy enough for your review. I "value your time" and am humbled that you took the time to read, comment, etc. on any of my posts.
Thank you again.
Bill Davis - Technical Trader

AMZN strong support $100 range 55PESeems to be running out of steam, AMZN has strong longer term support at $100-101 range, but look out below if/ when this breaks


AMZN Bearish pattern on 1D chartHey everybody welcome back
Today we’re looking at AMZN on the daily chart and it’s forming a very nice head and shoulders pattern.
I actually got in some puts at the top of the right shoulder and took profits already. I opened a new put position just before the bell.
You can see price was rejected at key levels same as the left shoulder. We’ll see if support will hold at the neckline.
If you look into the smaller time frames you can see the down channel of the right shoulder. Price is hitting the resistance of that down channel and has formed a triangle pattern.
My target is at the neckline and whether it holds or breaks support will determine our next position.
Thanks for tuning in.
Let me know how you feel about this and share your ideas
*This is not advice
