AMZN oversold close to long term supportLooking for an entry point to buy AMZN for an oversold bounce.
AMZN

Buy Amazon and holdAnother amazing buy opportunity in tech. Amazon put in an extreme MACDH diverergence yesterday on the daily charts at major support around $2000.
Wow this is such a great long term buy and hold here. We can take profits at any of the red resistance lines shown above if we want to trade short term time frames but this $2000 level looks really solid. DXY has been falling off as predicted and now Amazon looks primed for a big run up.
As I have said before in my recent posts, I believe inflation has peaked and the fed will not get more hawkish than it already has this is a great shot at this being the bottom in Amazon. Either way lots of profits to be had on the run up to resistance levels

$spx $amzn bull trap of the decade setup?made a vid for a friend, thought I'd make public to get feedback (on the analysis, the vid's my first so take it easy! :)
both amazon and the market as a whole are due for a leg lower but one that could occur in a stand-out fashion, befitting the historic significance of this moment from multiple perspectives.

AMZN $2500 Price Target by Mid-OctoberFollowing the same trend and momentum patterns of the SPY and QQQ ideas I posted earlier today. I see another consolidation phase after a sharp initial continuation of this incline. The stock split should help generate retail momentum additionally. Not trading advice.

𝗡𝗮𝘀𝗱𝗮𝗾 𝗨𝗽𝗱𝗮𝘁𝗲: $QQQ Daily. Bounce time?Got a full 5-wave move to the downside as forecasted. Now it looks like we may be turning for a bounce (similar to March)
$NQ_F $NDX $SOX $ES_F $SPY $SPX $TLT $TNX $GLD $DXY $VIX #Trading #Stocks 📉

AMAZON BUY NOWAccording to my chart analysis , AMAZON Show strong signal to buy , buy max as you can .

AMZN: A $ 500 REVERSAL ahead? Let's see.Hello traders and investors! Let’s see how AMZN is doing today!
Like many other stocks, AMZN is trying to reverse. After finding a bottom around the $ 2,048 (blue line), AMZN bounced and it dropped again to this line, making this a possible Double Bottom chart pattern. This is a powerful reversal pattern, and usually it works very well, when triggered.
In this case, AMZN must break the $ 2,316 (red line) in order to trigger the reversal pattern. The red line is the last resistance, and it is quite close to the 21 ema, which is another technical resistance that AMZN must break, otherwise, the bear trend will just persist.
If AMZN triggers a reversal, we have two possible targets to work with, in the mid-term. First would be the $ 2,707 area, which was a previous support level, and it could be a resistance in the future, according to the Principle of Polarity. Second, and my favorite one, is the gap at $ 2,806, which I do believe will be filled, eventually.
In the weekly chart, we see that the possible Double Bottom chart pattern in the daily chart couldn’t have a better timing. AMZN just hit a very curious technical support level, which is the February 2020 top level, before the crash.
In addition to this, AMZN is reacting nicely. So far, we see two Hammers candlestick patterns, with long shadows under the candlestick’s bodies, indicating some strength in this area.
For now, let’s wait for a clear reversal, as AMZN could fly roughly $ 500 (or 20%) if we do trigger the reversal we want. I’ll keep you guys updated on this, so remember to follow me to keep in touch with my daily analyses!

Amazon CloudAmazon (AMZN) just reached the cloud. The last time this happened was in November 2008. Could be a rare buying opportunity. Does anyone see things differently?
Not financial advice.

Beginning of an End.Have you ever asked yourself why Musk is migrating to Twitter? Tesla is gone...
A year from now and it will be trading below $200.
The channel broke today and it needs a SHARP pull-back in next 3 days to survive, will that happen? No...

AMZN: ON THE DIVING BOARD.AMZN is currently sitting on a major historical support between 2020 and 2080.
I believe it has never been so oversold. It does't mean it cannot go lower.
So, will it dive? One thing is for sure, tech and growth are not in favour.
You have 3 options here:
1. You think the support holds. Go long. The coming stock split could boost the price.
2. You believe the market keeps on selling. Short it if it breaks the support.
3. Wait for lower levels (1683, 1593, 1346) to go long.
Pick your winner.
Trade safe!

AMZN Amazon valuation is still high! If you haven`t sold Amazon.com, Inc. (AMZN) at $2891, when you saw the slowest growth since 2001:
Then you should know that the 51.89 Price per Earnings ratio is still high compared for example to BABA, Alibaba, who has the same business model, but a P/E of 23.39 - which is still high, btw. Should be around 18 in my opinion.
So my price target for AMZN is $1900.
Looking forward to read your opinion about it.

AMZN - The Jungle Ugly in the extreme.
EPS missed the mark and the punishment is extraordinary after
the Q4 Short Squeeze - we're seeing price well below 3400...
used to SELL SELL SELL.
Ouch, effing ouch.
Depression, yes, Rexcession entry? crazy talk by design.
It's a Depression and has been for some time.
Consumption, Savings Real Incomes... yeah screwed beyond.
Retracement?
Hmmm... Good Luck.
Only the FED can save this overpriced Paper.
___________________________________________________
#x Sub Sales Multi, good luck, 20% growth is gone for a LONG
LONG time.
EL/LA Tiempo reveals Rivian's gains are captured 2021 Q4.
$8 Billion write down... some gains.
Ouch.
Expense Side - Ouch.
Net Sales North America - Ouch.
The decline in Internation Sales... Only $# Billion from a marginally profitable
Business at best.
Ouch again.
Losing Money, AWS still the story, it's ain't expanding.
For now, they have a Plenty O' Cash... for now.
CASH FLOW Neggy ... again Ouch.

AMAZON/BITCOINI noticed the similarities in price action between Bitcoin in 2021 and Amazon in the last five years.
If the BTC price action plays out on the AMZN chart--and honestly, why should it?--then we can expect it consolidate around 1300 - 1400.

Amazon 75 Day Target - $2380Amazon is looking poised to trend towards the $2380 level. We could see a jump back to the ceiling of this down-channel, implying around an 8% rise over 75 days. Amazon's ATR has been at an all-time high since 2020, and the stock needs some time to consolidate; however, an 8% move from pre-COVID support levels over 50 days is not entirely unrealistic. Expecting a slow climb to this level and then to test from there. Following upside, levels seem to be $2700 based on volume profile.


Elon Bubble.This is how much TESLA actually worths.
Market correction continues until the late this year (until TESLA returns to its pre-bubble value).
Red TESLA makes entire the market bloodbath.
ByeBye richest guy!

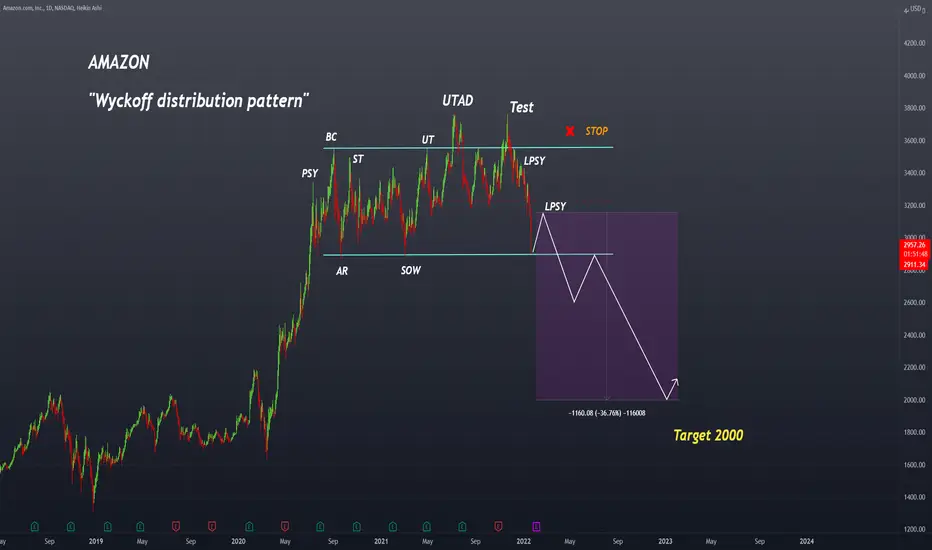
AMAZON "Wyckoff distribution pattern"Amazon is going to crash, like the entire stock market as a whole!
GUESS WHAT HAPPENS WHEN THE FED TIGHTENS CREDITAMZN, The poster child for Discretionary Spending is already showing cracks in it's armor!
But what will happen when the FED gets rolling?
Stay tuned...

$AMZN Analysis, Key Levels, & Targets… $AMZN Analysis, Key Levels, & Targets…
Building support at the long trend line

Beginning of an End.(Continued)Musk knows better than anybody else what's gonna happen for TESLA, run away when the CEO is walking away.
Next week <= $500.
Ps: when gas price goes up, people tend to buy EV. but affordable EVs not a $70K car. TESLA's competitors are winners of status quo.

BTC 34-35k Rally, Crash AfterIm speculating that Bitcoin will make a short rally into the 34-35k zone. Once it hits this zone I believe we will see the bears takeover, this wedge setup that is being created backs up my idea. Along with BTC rising to 34-35k, we will see a short increase in SPY, QQQ, AMZN, TSLA, and other major companies. After this short increase I honestly think the market will crash... stocks and crypto. I will be heavily shorting SPY, BTC, and US30 once the market rises towards the zones I have set. BTC: $34k, SPY: $415, QQQ: $315, AMZN: $2700, TSLA: $820. US30: $34k. With inflation increasing and home prices rising, I see a market crash coming... who doesn't lol.

$AMZN might have stroke Gold!NASDAQ:AMZN
$AMZN has been in the news a lot this days. Bezo's going at it with President Biden... First Union and court case awarded to ex-employee. Misuse of customer data... the list goes on.
Are you considering buying into the $AMZN stock split?
Are you concerned about the impact of all these news on the stock?
I'll say one thing and one thing only; Technology.
Technology; bots, AI, robots, and many more are all the things Amazon going for it. It has been able to reduce the cost of its workforce dramatically while growing into other industries. Yes, Inflation will cost a temporarily reduction in customer purchases as seen in the recent earnings; this will be a temporary impact. The supply chain issues, although ongoing, will be resolved as manufacturers realign their suppliers.
Technical analysis:
Daily Chart
EMA (Exponential Moving Average): The EMAs are inverterd 200/100/50/20 EMA which usually means bad news but wait a minute! What happened on Friday? May 13th? Price action is finally above the 200EMA. Is this a dead cat bounce? Are we seeing a reversal of trends?
TTM Squeeze: Squeezing upwards. Momentum to the upside!
Fib Levels: Parabolic movement to the downside; Wish I shorted the position April 20th during the "Death Cross". Given the very volatile markets, leverage trading is not advised but the current position is too tempting not to go long. More importantly; the price action aimed at the blue all hell goes down support line and crossing back up. Have we seen the bottom and stroke gold?
RSI: Went as low as 18.54 on May 12th (Thursday) and popping back up aggressively. Looks like we are oversold and it's time to make some short-term recovery.
Candle Stick: Summary of last 5 candles equate to a bullish pattern. Dragonfly Doji right above the 200 EMA...
Pattern: Rising wedge pattern (This is a reversal trend pattern)
News: With the upcoming split, this might just be a good time to own $AMZN if you don't already have one. (Not financial advice).

Amazon - Time to Buy or to Expect Deeper Correction? A trillion dollar giant Amazon has been upsetting investors with poor earning reports since July 2021 and its market price has already dropped by nearly 40%.
But is the price fair now to buy the dip or should we expect deeper and longer correction?
Fundamental indicators:
Revenue and Profits - consistent growth for the past 10 years, however, it is slowing down since 2021
Profit margin - just 7%, considerably lower than the rest of FANGMAN
P/E - still overwhelmingly overpriced with 54x ratio
Liabilities - no problems with debt
Technical Analysis (Elliott Waves):
Since IPO and the first deep correction in 2001 the share price has been accelerating and developing in a series of first waves
The first considerable correction of wave 4 can be observed between September 2018 and March 2020 in the shape of a Running Flat
And since the historic high $37773 culminating in wave 3 there has been next corrective wave 4 developing
Using the Fibonacci retracement levels from the high, the potential price zone where the correction may find support is between $1880 - $2240, representing 0.786 and 0.618 levels respectively
Considering that the previous wave 4 has lasted for 560 days, the one we are observing now is most likely to last even longer, at least until August 2023
And given that the correction is quite deep it is also likely that correction will be in the shape of triangle, of course other corrective wave patterns are also possible
Given all the above points the price range $1880-$2240 might be good for some purchases. However, considering the risks of recession and lengthy correction in the market - is it worth investing in Amazon ?
What do you think about the prospects for Amazon ?
Please share your thoughts in the comments and like this idea if you would like to see more stocks analysed using Elliott Waves.
Thanks
