AMZN buying opportunity?notable divergence. closed strong above 1 yr VWAP and retracement level making a doji .
Amznlong

AMZN - UPDATE - if anyone is interested :)i can see this going down
i am going to watch closely and see
what happens. will update you guys also
like, comment and follow :)

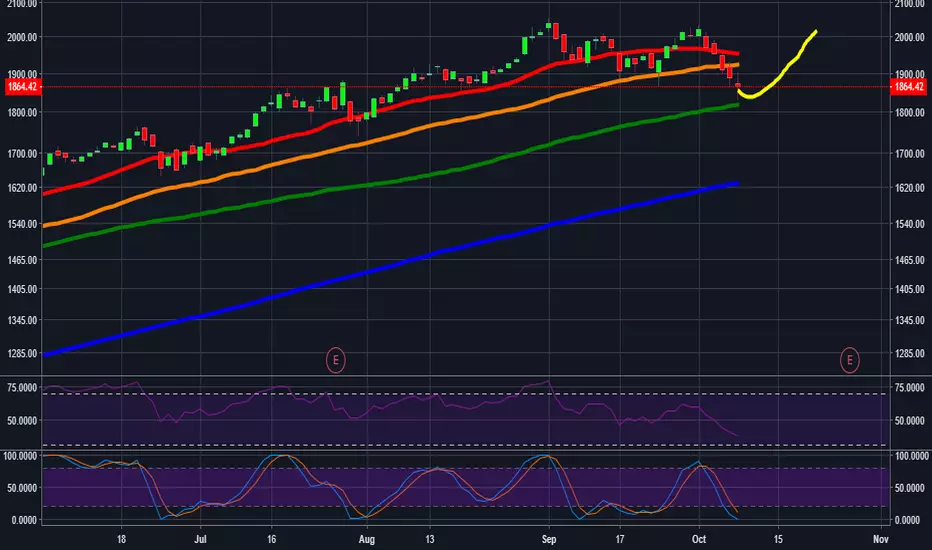
Technology should rebound 16%+ from recent lowsThe technology sector should rebound at least 16% from recent lows before April 2019. This rotation in the US equities markets is a very healthy process and my predictive modeling is suggesting that this IS NOT A TOP. We still have a ways to go before I will be calling a top in this market.
The Technology sector is where real share growth has been focused over the past 3+ years and I don't expect that to change. Amazon and others will continue to drive share price appreciation as Q3 earnings are announced and Q4 earnings will likely continue to outperform. Yes, a shift of capital from over valued assets, like AMD and others, may cause some pricing pressures - especially if Cryptos collapse as I'm expecting. Yet, this shift of capital will not abandon technology completely. This recent downside price move is really a tremendous buying opportunity for skilled investors.
Don't let the Elliot Wave charts fool you. Everyone was calling the February top a WAVE 5 TOP. Look what happened. Get ready for another leg higher by early 2019.

Amazon (AMZN) Good to shortI have been short Amazon since 1870 and am currently in good profit.
Amazon has been overvalued for a long long time. If people do not regain confidence in the stock it will drop much more.

Bearish reversal imminent for Amazon?Looking at the RSI levels the Amazon price could be due for a bearish reversal very soon so wait for confirmation.
Like this idea if you agree.
Elliott Wave Analysis: Amazon Showing Impulse RallyHello Traders,
In this Elliott Wave Analysis, we will have a look at Amazon.
Short-term it is suggesting that the cycle from 6/25/2018 low ($1646.31) is rallying higher in an impulse structure. This suggests that the internal sub-division of each leg higher is unfolding as 5 waves structure of lesser degree i.e black wave ((i)), ((iii)) & ((v)), whereas wave ((ii)) & ((iv)) has subdivision of 3 corrective waves.
Up from $1646.31 low, a rally higher to $1725 high completed black wave ((i)) in 5 waves leading diagonal structure. Down from there, the 3 waves pullback to $1684.30 low ended black wave ((ii)) as zigzag structure. Above from there, the stock made another 5 waves advance which ended black wave ((iii)) at $1841.95 peak. Below from there, the pullback to $1791 low ended black wave ((iv)) in lesser degree 3 swings. Up from there black wave ((v)) remains in progress which is expected to unfold in another 5 waves structure.
Target for black wave ((v)) comes at $1868.58-$1887.15 ( black wave ((v))=((i)) ) area for the completion of cycle from 6/25/2018 low in red wave 1 or wave A. Afterwards, the stock is expected to do a pullback in red wave 2 or wave B in 3, 7 or 11 swings before further upside is seen provided the pivot from $1646.27 low stays intact. We don’t like selling it.

AMZN LONG OPPORTUNITYI don't look much into FA but the last news of AMAZON getting into Pharma could give the stock a good leg up!! What's the saying, buy the rumors / sell the news?!? Keep your eyes on that eye, I haven't place any orders yet. Still wait a bit and see when market open (might be too late). Also TA ain't bad, check the chart.
Trade Safe!!

AMZN BUY SHORT TERM OPPORTUNITYIN THE STORM OF THESE DAYS AMZN STILL BE ONE OF THE BEST STOCK IN THE MARKETS.
SHORT TERM BUY OPPORTUNITY IF THE LEVEL 1350 REJECT THE FALL OF THE LAST DAYS.
STOP LOSS UNDER 1347, TAKE PROFIT 1418.

AMZN GET READY TO LONGBroke through Resistance level of 1472.5800 at 21-Feb-13:30
Supported by Upward sloping Moving Average

Going long on AMZN with a pullbackVery bullish on AMZN right now. However, not buying right now with the SPY and QQQ pulling back, which should continue, and AMZN being at an ATH.
Would like to see AMZN trade back to the 20 day EMA for a bounce. If that doesn't work, the support around $1,295-$1,300 before going long for a swing trade and/or investment.
If she does break higher, I will look to enter for a day trade and/or shorter swing trade off the hourly chart :D.

AMZN - LongI think we move up. I love seeing this curve before going long because it tells me a solid base has been built and Smart Money been buying.

AMZN to $1200+ in 2018Here is a chart for AMZN. It could see $1200+ in 2018.
Comment if you have any ideas or feedback.
This one has a massive amount of upside!


AMZN @ 1h @ big GAP (between 790 & 815) should be defend, bullsTake care
& analyzed it again
- it`s always your decision ...
(for a bigger picture zoom the chart)
Best regards :)
Aaron

AMZN @ 1h @ upside trend threatened! GAP Outbreak this week?Take care
& analyzed it again
- it`s always your decision ...
(for a bigger picture zoom the chart)
Best regards :)
Aaron

AMZN @ daily @ will gap be confirmed this week ?Take care
& analyzed it again
- it`s always your decision ...
(for a bigger picture zoom the chart)
Best regards
Aaron

AMZN @ 1h @ w-formation & trendline confirmed, next week also ?Take care
& analyzed it again
- it`s always your decision ...
(for a bigger picture zoom the chart)
Best regards
Aaron

Amzn long20dma crossing 50dma soon. Triangle most likely to break upside. Expecting retail sector to bounce back again.

still long AMZN @ 15 min @ trading capability this 52nd week `16Take care
& analyzed it again
- it`s always your decission ...
(for a bigger picture zoom the chart)
This is only a trading capability - no recommendation !!!
Next week i`ll confirm or change my opinion about this SetUp :)
Buying/Selling or even only watching is always your own responsibility ...
Best regards
Aaron

AMZN @ 1h @ will we find us around yearly sma by 704.84 ?Take care
& analyzed it again
- it`s always your decision ...
(for a bigger picture zoom the chart)
Best regards
Aaron

AMZN @ daily @ after W TrendReversal broked, will 200 MA holds ?Take care
& analyzed it again
- it`s always your decission ...
(for a bigger picture zoom the chart)
Best regards
Aaron

long AMZN @ 15 min @ trading capability for this 51st week`16This is only a trading capability - no recommendation !!!
Next week i`ll confirm or change my opinion about this SetUp :)
Buying/Selling or even only watching is always your own responsibility ...
Best regards
Aaron

AMZN @ Daily @ Crucial Days until Christmas (year end 2016)AMZN lost -16,83% from it`s all-time by 847.21 (2016/10/16) until 710.10 (2016/11/14)
Meanwhile the 2nd main upside trend broked also - with a GAP! And this GAP is also the 1st target to get back on a bullish track. I am slightly optimistic, but i want a visual evidence - want to see the shares even to trade between 789.49 & 815.43. Buying before is also an oppurtunity, `cause the downside trend, which even breaked the 2nd main upside trend was left behind while last wednesday trading day ...
How ever, maybe i am too kosher !?
But i want to see the share even trading out of the downside trend - even between the GAP, if it has to be ?!
And from thi points of view, all in all, i am still pretty neutral - and would like go long much higher over next week, if even the broked downside trend holds ...
Possible short-term target for bears are, in my opinion :
736.70 2nd leg of the w-wave
710.00 1st leg of the w-wave
Possible short-term target for bulls are, in my opinion :
792.40 lower middle high of the w-wave & end of the extended downside trendline
843.09 start of the extended downside trendline
For mid-term trendfollower traders the all-time high (847.21) could be a support line to get long - even like the alll-time high from last year by 696.44 (2016/12/29) for bears to get mid-term short once again ...
Take care
& analyzed it again
- it`s always your decission ...
(for a bigger picture zoom the chart)
Best regards
Aaron
