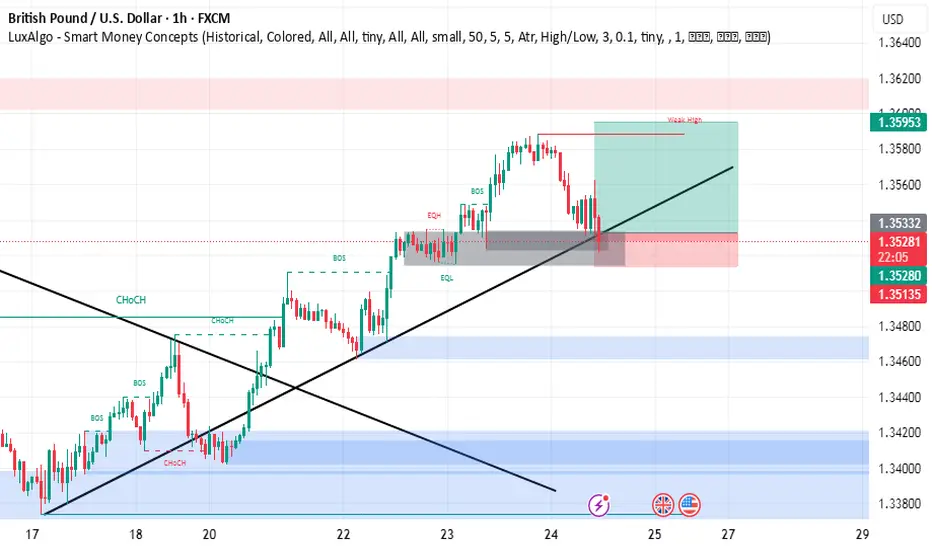
GBPUSD buy setupsimply
this is 6 deals after 5 CONSECUTIVE WINNING traders
we have demand
uptrend
the price can't make lower low
and make more candle in the area with more rejection
so the price will go up
be careful on your risk money management
BEST WISHES
Analiz
US Small Companies Index ‘Russell 2000’ in Critical Trend!US Small Companies Index ‘Russell 2000’ in Critical Trend!
Let's take a look from a Fundamental and Technical perspective;
In 2020, the middle band (main trend line) of the logarithmic rising channel was broken and the upward movement had continued since then. Today, however, the same critical support level is being tested again.
If it cannot hold at this level, a long-term trend break may occur. This would significantly increase the risk perception in Russell 2000 companies.
What is Russell 2000?
It does not include large technology giants such as Nasdaq or S&P 500, but small and medium-sized companies that hold the real pulse of the US economy.
These companies are more fragile and more vulnerable to economic fluctuations.
The spread of anti-Trump protests shows that small businesses are starting to be affected both physically and economically.
The prospect of no interest rate cut by the Federal Reserve (FED) is crushing these companies under high borrowing costs.
The contraction in consumer spending can directly hit the profits of these companies because they are dependent on the domestic market.
Possible Scenarios for This Week:
🔴 If the protests deepen and the market panics:
If a break below $180 comes, the $170 support level is tested.
With panic sales, the $150 - $160 region, which is the lower band of the channel, may come to the agenda.
🟢If the environment calms down and economic data signals a recovery:
Strong purchases come from the middle trend line.
$200 - $210 band can be targeted.
In short, support is now being tested, if it breaks, the risk of serious decline is on the table.

BNX/USDTHello friends
Given the price growth and the arrival of buyers, now that the price has corrected, you can enter the transaction with risk and capital management.
*Trade safely with us*

egld setup"🌟 Welcome to Golden Candle! 🌟
We're a team of 📈 passionate traders 📉 who love sharing our 🔍 technical analysis insights 🔎 with the TradingView community. 🌎
Our goal is to provide 💡 valuable perspectives 💡 on market trends and patterns, but 🚫 please note that our analyses are not intended as buy or sell recommendations. 🚫
Instead, they reflect our own 💭 personal attitudes and thoughts. 💭
Follow along and 📚 learn 📚 from our analyses! 📊💡"

"USDT Dominance Analysis: Potential Reversal from Key Support"On the 4-hour chart, USDT Dominance recently tested the key support box around 3.73% - 3.75%, which has acted as a strong demand zone in the past. After a bounce from this level, USDT.D has risen by approximately 17% over the past few sessions, signaling a potential shift in market sentiment.
Key Observations:
Support Zone: The 3.73% - 3.75% range continues to serve as a significant level where buyers step in, pushing the dominance higher.
Current Resistance: Watch out for the 4.40% - 4.50% range, as it could act as a short-term resistance zone.
What It Means for the Market:
A rising USDT dominance typically indicates increasing market caution, as traders move funds into stablecoins.
If USDT.D continues upward, we might see further corrections or consolidation in major crypto assets like BTC and ETH.
Conversely, a rejection near resistance could signal a return of bullish momentum in the broader crypto market.
Outlook: Monitor the resistance zone closely for potential reversal signals. A breakout above could indicate continued risk-off behavior, while a rejection may encourage a move back toward the support zone.

BTC BITCOIN READ CAPTIONEven a small hold of Bitcoin today can open doors to unexpected opportunities in the future. The market moves fast, and what seems minor now could turn into a significant gain over time. Don't underestimate the power of patience and foresight in the crypto world.

bitcoin act!I think Bitcoin will fall to the support level of 71510 and reach its critical range. The support line of 71510 is very important. If it is broken, the price of Bitcoin will easily fall to 51000. If it does not, the price will rise again from this support line. In my opinion, it is suitable to take a short position to 71510 right now.

GOLD IS STILL SIDEWAYThe price is still sideways and there are no clear signs of a break out. If the price breaks out to the 2610 area, we will look for a Buy point.


XAUUSD GOLD 1HR CHARTXAUUSD The outlook remains bullish, holding on to the same target as yesterday. Our analysis continues to support the expectation of upward momentum, reinforcing the importance of patience and precision in trading. Stay committed to the plan and allow the market to align with our projections.

CADCHFWe expect it to rise now to the current target. If the four-hour candle closes below the area, the analysis will end

Fundamental Market Analysis for September 25, 2024 GBPUSDGBPUSD:
GBP/USD continued to rally the Pound for the second day in a row, breaking above 1.3400 and hitting new 30-month highs after the US Dollar weakened significantly on Tuesday.
Wednesday will be quiet for the Pound in terms of data, although traders will be keeping an eye on statements from Bank of England Monetary Policy Committee (MPC) member Megan Green. MPC member Green will be speaking at the North East England Chamber of Commerce.
The U.S. portion of Wednesday's economic data list is also underweight for the midweek market session. August's monthly new home sales figure is unlikely to have much momentum one way or the other, followed by a speech from Federal Reserve Board of Governors (Fed) member Adrian Kugler, who will speak at Harvard's Kennedy School in Cambridge.
Consumer confidence deteriorated across the board on Tuesday, with consumer expectations for 12-month inflation accelerating to 5.2 per cent. Consumers also reported a general weakening in their six-month outlook for household financial conditions, and consumer assessments of overall business conditions turned negative.
The pullback in consumer confidence results triggered renewed trading in the rates markets in favour of a subsequent sharp rate cut in November. According to the CME's FedWatch tool, rates markets are pricing in nearly 60% probability of a second 50 bps rate cut. 7 November and only a 40% probability of a more reasonable subsequent 25bp rate cut. Earlier in the week, traders were estimating roughly equal odds of a 50bp or 25bp rate cut.
Trading recommendation: Trade predominantly with Buy orders from the current price level

SLP - LONGWe see holding: the coin continues to grow slowly despite the pressure of the entire market going down. For me, this is a very good signal, and I expect the coin to rise. I've indicated the targets on the chart, and the stop is set outside the triangle.

AEFES/TRY potential bull flagTECHNICAL ANALYSIS
Bull flag might be forming in the 4 hour chart.
Volume has ben decreasing since entering the pattern.
MACD on the 1 hour chart might turn positive soon.
RSI on the 1 hour chart has a bullish divergence and a triangle pattern.
I expect a move in the next couple of days probably before 31 July.
AEFES is probably in an accumulation phase before going upwards again.
Target price is 385TRY if a breakout happens.
Traders need to be careful because the daily MACD is still in negative territories.
Watch out for potential breakouts from the pattern.
FUNDEMENTALS AND NEWS
AEFES will share its Q2 balance sheet on 8th of august. It is expected to be positive.
AEFES has factories in Russia. Ukraine and Russia might agree to a peace soon.
My view: POSITIVE
Disclaimer: This isn't financial advice.

bitcoinBitcoin has reached near a support level at $60,000. Both BTC and ETH are now in a support area.
If they bounce back from here and reclaim the 100-day EMA, it will be a bullish sign. Otherwise, we might see a deeper correction.

Btcusdt ...technical analysis At time 30, the btc meets the Ichimiko support zone and is also in an ascending channel, it can go higher up to 46, 47, I see Bitcoin rising.

EURUSD: Continue with the sell There was only a slight decrease in the last session, so no significant changes have appeared on EURUSD. Currently, we still have short positions according to previous reversal signals around the 1.10 resistance area, please continue. holding the position, the short-term target is still around the lower border of the rising channel, we will only abandon this strategy when the peak of 1.10 is completely broken.

XAUUSD
Hello friends
I think
At the limit of 2044, the price will find a significant decrease in momentum and will probably continue to move in the form of a price range for several candles and finally move towards lower targets.

GBPUSD ANALYES IN 1H Hello Traders
We have a strong OB , with moving average(201) approaching, this indicates a strong area for me to buy
So our entry will be at 1.21700 and we will take profits at 1.2280

USD CHF H4 SELL We are correcting the price and we expect to react to these two ranges to continue selling


CAD JPY H4 SELL The price is higher in the hourly resistance range, a trend reversal or at least a correction is expected

XAUUSD H4 status-RenkoThis renko chart shows an interesting perspective I think. Strong resistance is noted
