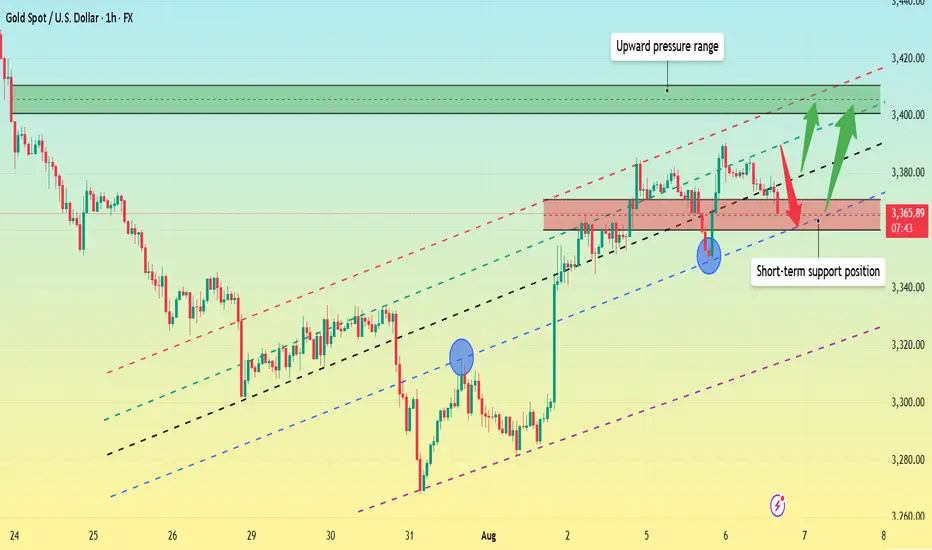
Gold is under pressure. Can the upward trend continue?On Thursday, gold rose rapidly in the European session, reaching around 3397, but failed to successfully break through the 3400 integer mark; it currently fell back slightly and fluctuated around 3375. Judging from the 4-hour chart, the price is currently running close to the middle track of the Bollinger band; since the market opened this week, the gold price has continued to run above the middle track of the Bollinger band. Despite the slight decline, it has remained within the upward trend channel and has continuously set new highs.
The current upward pressure position remains at 3390-3400, and the key support level is around 3370, which is also the crossover position of the current MA5, 10, and 20 moving averages. The RSI indicator remains above its midline, indicating that bullish momentum remains.
Quaid believes that as long as the price remains above 3370 in the US session, any pullback will be a sign of accumulating upward momentum. Gold still has the trend of hitting the 3400 integer mark.
Trading strategy:
Go long near 3370, stop loss at 3360, profit range 3380-3390-3400.
Short near 3400, stop loss at 3410, profit range 3375-3365-3355.
Analyse

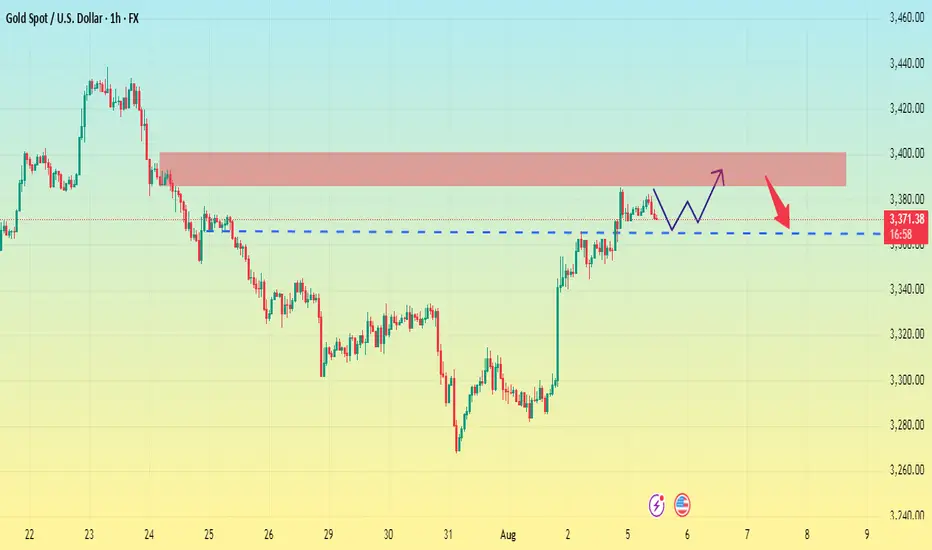
Gold Holds Firm. Continues to Set New Highs?After four consecutive days of gains, gold continued its volatile upward trend on Thursday, reaching a new high for August. This performance suggests a relatively strong, volatile upward trend in the short term. The moving average system is currently extending upward, providing some support for the rise.
In the short term, focus on the support strength near 3380 on the MA5 moving average, which is a key indicator of the short-term trend. If this support level is broken, continue to monitor support near 3370 and 3365. 3370 marked the low point of Thursday's rapid decline in the European session, while 3365 marked the lowest point reached on Thursday.
It is worth noting that gold has maintained an overall volatile upward trend this week, with prices continuously reaching new highs. Therefore, as long as the price remains above yesterday's low, Quaid believes the market will continue to fluctuate upward. On the upside, we need to pay attention to the resistance near 3400-3410. The price has tried to break through many times, but has failed to stabilize above the integer mark of 3400. If it fails to break through strongly, the price will most likely make a correction and try to break through again after accumulating upward momentum.
Trading Strategy:
Short around 3405, stop loss at 3415, profit range 3380-3365
Long around 3365, stop loss at 3355, profit range 3380-3400

Gold (XAU/USD) 4H Institutional Analysis — August 6, 2025As of August 6, 2025 (12:23 UTC), Gold (XAU/USD) is trading around 3,367.60, according to Kitco’s live spot price feed. After a sustained bullish recovery from the 3,320–3,330 demand zone, gold finds itself at a structural inflection point. Institutional footprints across the board — from order blocks to liquidity maps — are signaling one dominant message: the bulls are setting the stage.
In today’s breakdown, we deliver a high-conviction execution plan using a fusion of Smart Money Concepts (SMC), ICT methodology, and 4H structural dynamics — isolating only the strongest Primary Buy and Sell zones, along with their fallback counterparts. At the center of this framework is our Golden Zone, the most institutionally-aligned, high-probability area of the day.
🔍 Market Structure & Directional Bias
The 4-hour chart has shown a clear Change of Character (CHoCH) to the upside after a bullish Break of Structure (BOS) above the 3,355 level. This signals a phase shift from consolidation into accumulation and potential expansion, likely aiming toward the 3,400 psychological magnet and beyond.
The presence of volume imbalances, fair value gaps, and unmitigated order blocks across multiple structural layers further supports a bullish directional bias. Liquidity has been swept below previous equal lows (EQL), creating an environment ripe for institutional accumulation.
Directional Bias: Transitional → Bullish
🎯 Primary Execution Zones
✅ Primary Buy Zone (Golden Zone) — 3,355 to 3,360
This zone represents the highest-quality long opportunity on the chart today. Sitting in the discount array (below 50% of recent swing), the zone is built on a fresh Rally-Base-Rally (RBR) demand structure formed after a decisive CHoCH.
The 3,355–3,360 range aligns with a valid unmitigated Order Block, an embedded Fair Value Gap, and an OTE retracement between 0.705–0.79 Fib levels. Beneath this zone lies a sweepable liquidity pocket just under 3,350, further increasing the magnetism of the area.
Entry: 3,355–3,360
Stop Loss: Below 3,350 (liquidity invalidation)
Take Profits:
TP1: 3,395–3,400 (1.272 extension)
TP2: 3,420 (1.618 extension)
Confluences: RBR Demand, OB, FVG, OTE, Volume Imbalance, EQL Sweep, Discount Array, Structural Support
Kill Zone Timing: London-NY Overlap
✅ Golden Zone of the Day
✅ Primary Sell Zone — 3,395 to 3,400
While the broader bias is bullish, gold remains capped by a strong Drop-Base-Drop (DBD) supply zone around 3,400 — also the 1.272 fib extension from prior bullish legs. A pocket of equal highs (EQH) just above 3,405 serves as a liquidity magnet and stop-loss hunting zone — making this supply level extremely attractive for short-term reversion plays.
Entry: 3,395–3,400
Stop Loss: Above 3,405
Take Profits:
TP1: 3,360
TP2: 3,350
Confluences: DBD Supply, OB, FVG, OTE Retrace, EQH Sweep, Premium Array, Structural Resistance
⚠️ Secondary Execution Zones (If Primary Fails)
🟢 Fallback Buy Zone — 3,325 to 3,330
If the market manipulates lower and invalidates the primary buy zone with a deep liquidity sweep, this deeper zone offers a second chance. It contains a secondary demand block, a valid FVG, and lies cleanly within a deep discount retracement.
SL: Below 3,320
TPs: 3,360 and 3,380
🔴 Fallback Sell Zone — 3,445 to 3,450
If gold breaks cleanly above 3,405, likely invalidating the primary sell idea, the next institutional level of interest is 3,445–3,450 — sitting on a higher timeframe premium OB and major liquidity shelf.
SL: Above 3,455
TPs: 3,395 and 3,370
🌐 Institutional Consensus: Bullish Convergence
Institutional analysts across major platforms confirm a bullish bias, with targets hovering around the 3,400–3,420 area:
Reuters reports that gold is near a one-week high, supported by weaker U.S. data and increased rate-cut bets.
MarketPulse highlights the “return of the bulls” amid sustained momentum and light CPI expectations.
Citi has raised its medium-term gold target to $3,500, citing negative U.S. macro headwinds.
TradersUnion confirms support at 3,320 and resistance at 3,400 — mirroring our execution levels.
There is no significant divergence in sentiment or structure, validating today's trade zones with confidence.
📌 Final Thoughts
In a liquidity-driven market, price is engineered — not discovered. Today, that engineering points to one thing: 3,355–3,360 is the Golden Zone — the strongest execution area, supported by eight institutional confluences, favorable structure, and widespread sentiment confirmation.
Gold has re-entered its institutional kill-box. The next move? Likely engineered to deliver smart money profits while trapping the uninformed. Don’t chase price. Let it come to your zone. Execute with discipline.

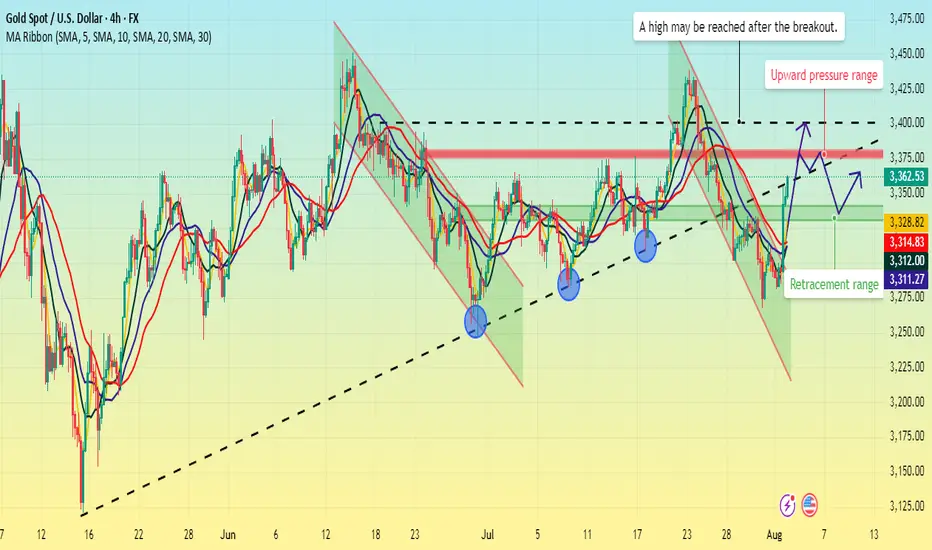
Gold retreats. Is it gathering upward momentum?
The 4-hour chart shows a clear market trend. On Tuesday, gold reached a high near 3390, and it's now firmly above the 4-hour trendline. The retracement reached a low near 3350, essentially completing the correction. Therefore, today's upward trend is likely to continue, aiming for new highs. The current resistance level is around 3400-3410.
From the 1-hour chart, key support lies between 3370-3360. Quaid believes that today's price must not fall below 3360. If it falls back below 3360, it's likely to retest the low of 3350.
However, as long as it remains above support, gold will remain in an upward trend. Upward resistance lies around 3400-3410.
Trading strategy:
Go long near 3360, stop loss at 3345, profit range 3380-3400.
Short near 3390, stop loss at 3410, profit range 3380-3370-3360.
Gold continues its upward trend. A strong week ahead?Gold's technical outlook on the daily chart maintains a bullish structure, with prices trading within the upper middle Bollinger Bands. The 7-day and 10-day moving averages have formed a golden cross, and the RSI indicator is trading above its mid-axis.
The short-term 1-hour chart shows prices trading within the upper middle Bollinger Bands, with the moving averages forming a golden cross and the RSI indicator pointing upwards. Quaid believes that the trading strategy for Wednesday remains unchanged, with the main focus on low-level long positions during pullbacks, supplemented by high-level short positions.
Gold initially fell before rising on Tuesday, breaking through the intraday high and touching the 3390 level. It closed with a doji with upper and lower shadows. The current bullish trend remains intact, with the moving averages in a bullish formation. However, the 4-hour chart is approaching the acceleration line, creating downward pressure. This suggests a short-term bullish risk zone, and it is advisable to avoid buying at high levels. The hourly chart showed a sideways trend, closing below the upper line. While it hasn't broken below the moving average, the indicator has turned. Therefore, based on the overall market trend today, Quaid believes there's a high probability of further upward movement after a correction.
Trading Strategy:
Long at 3355-3360, stop loss at 3345, profit range 3380-3400;
Short at 3390-3395, stop loss at 3405, profit range 3360-3350;
Key Points:
First Support Level: 3370, Second Support Level: 3360, Third Support Level: 3350
First Resistance Level: 3390, Second Resistance Level: 3400, Third Resistance Level: 3410

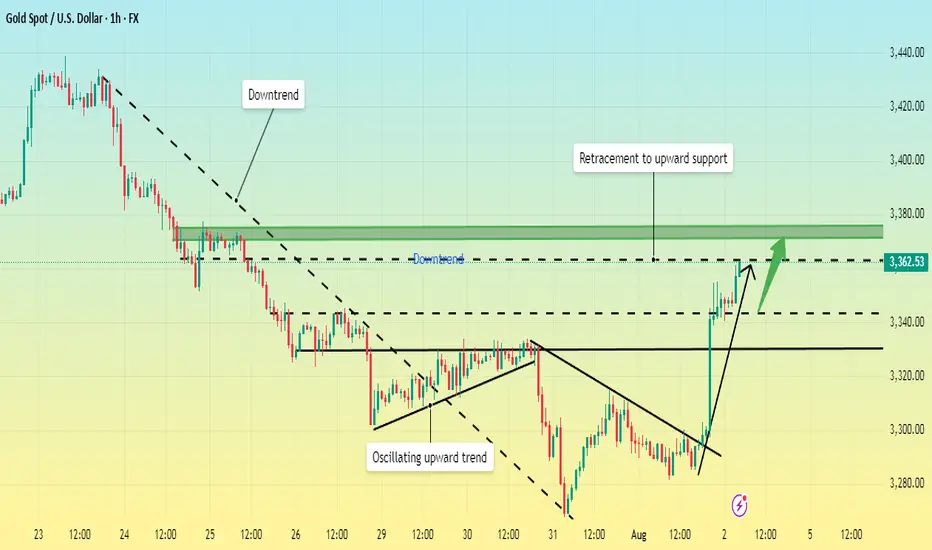
Gold has bottomed out and rebounded. Where will the high point bGold has currently hit a low near 3350, rebounding from the bottom and now rising to around 3390.
Looking at the 1-hour chart:
The most critical upward level is currently around 3390. If the price breaks through this level and stabilizes above it, the late July high of 3430 could be revisited. Conversely, if it remains below 3390, the overall range will remain between 3350 and 3390.
Secondly, looking at the 4-hour chart, we can see that the trend line resistance level is also currently around 3390. If the price stabilizes above 3390, the upper 4-hour chart could directly reach the 3400-3410 range. If the price holds above 3410 again, the next target would be around 3450.

Gold prices have retreated slightly. Is there an opportunity to From the daily chart:
Gold prices haven't held above 3380, so the primary resistance level remains around 3385.
Currently, the daily moving average support is far from the high, with support below 3340-3360. While the daily trend remains bullish, the risk of a pullback and subsequent upward movement cannot be ruled out.
From the 1-hour chart, Quaid believes the price cannot fall below 3365. 3365 marked the opening high on Monday. Common sense suggests that if gold remains above 3365, it may remain at a high level for a short-term consolidation.
Thus, today's focus is on the key level of 3365. If the price doesn't fall below this level, consider going long at this level, waiting for a profit after another rally to the resistance range, and then shorting within the key resistance range.
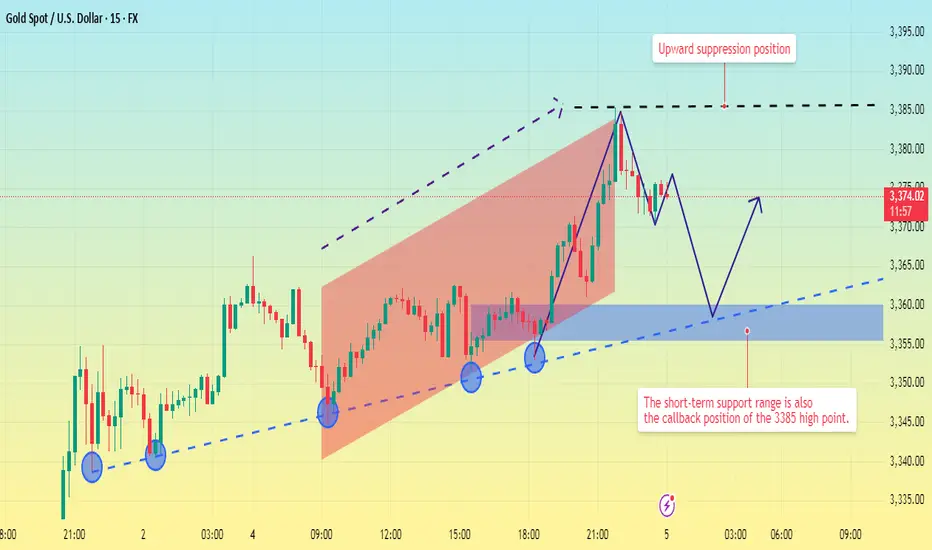
Upward movement suppressed. Price pullback?Gold prices have now perfectly reached the short-selling target range predicted by Quaid.
The current 4-hour chart clearly shows that gold's current resistance level remains around 3385.
Looking at the shorter 15-minute chart, gold has been slowly rising within an upward channel today. The resistance level of 3385 has not been effectively broken, and there is a high probability of a further pullback to test the 15-minute trendline.
Currently, 15-minute trendline support remains around 3355-3360. Focus on this support range in the short term, as it also represents a profit-taking opportunity after shorting at the 3385 high. This level can also be considered a watershed between bulls and bears. If the price pulls back to this level and does not continue to decline, there is a high probability of another upward move at this level.
However, if it falls below the 3350 trendline, the market will enter a downward trend.
Good luck to everyone in the new week.
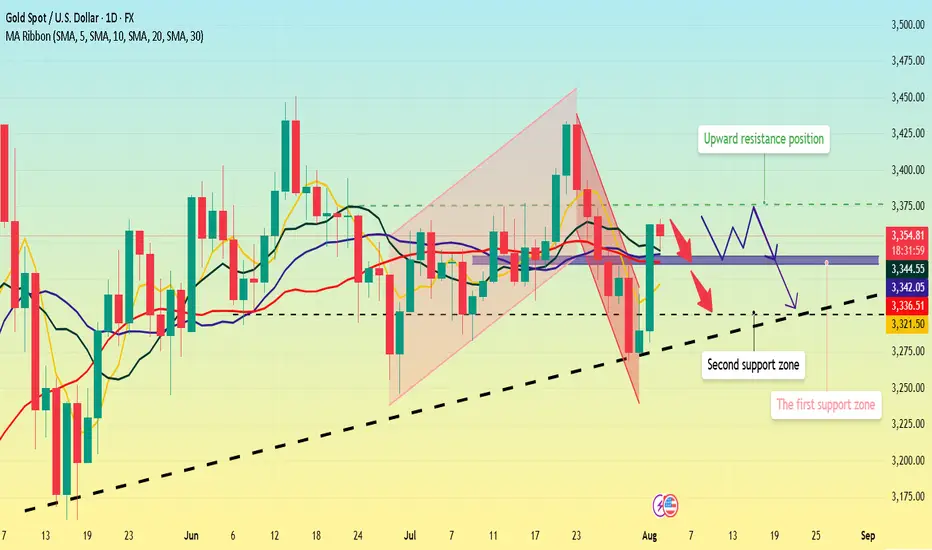
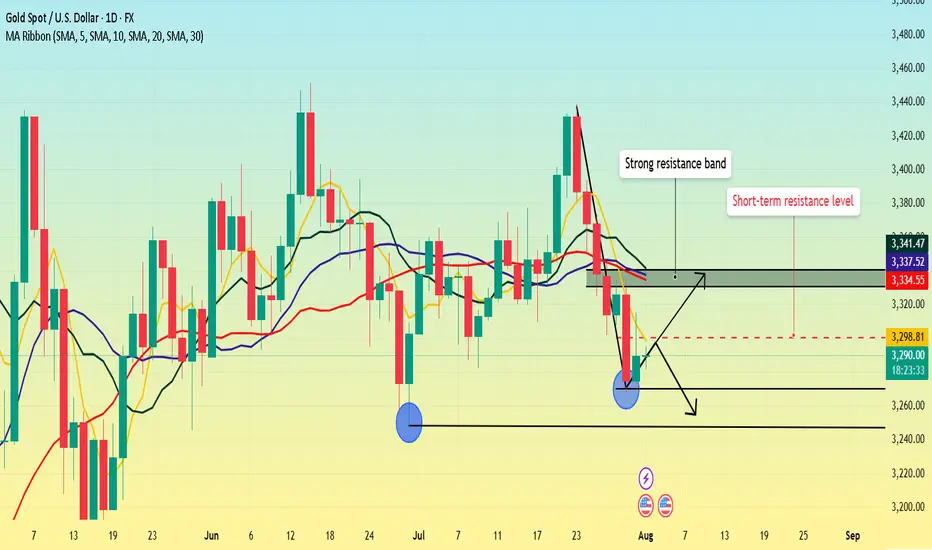
Gold prices are fluctuating. Is a correction coming?Gold surged last Friday, directly breaking through multiple moving average resistance levels. This trend is quite strong. Currently, the 5-day moving average has turned upward, indicating short-term upward momentum; however, the 10-day moving average remains slightly downward, indicating some divergence in the short- and medium-term trends. The 20- and 30-day moving averages have flattened. Overall, the short-term moving averages are less reliable, making it difficult to clearly predict the precise short-term trend based on them.
Since mid-May, gold has been fluctuating widely at high levels. Within this trend pattern, continued monitoring of fluctuations within this broad range is warranted. Until a major trend breakout occurs, the overall approach should be to maintain a volatile outlook and avoid prematurely declaring a unilateral trend.
The upper resistance level is around 3375, which has been repeatedly suppressed during previous price fluctuations. Focus on support in the 3340-3335 area below. This marks the low point after last Friday's sharp rise. The market has stabilized in this area and continued its upward trend. If the decline is significant, the 3300 round-number resistance level will need to be monitored.
Trading strategy:
For aggressive trading, short around 3375 with a stop-loss at 3385 and a profit range of 3345-3335.
Interest rate cuts intensify. Will gold break out?No noteworthy news events occurred this weekend. So, we'll have to wait and see how the market interprets gold's trajectory at the start of next week.
From the 4-hour chart, the first thing we can confirm is that the 3363 level is unlikely to be the high point of this pullback. Because Friday's non-farm payroll report re-priced expectations for a rate cut, Friday's figures were merely a reaction from the US market. Furthermore, after hitting 3355, the price retreated slightly to 3340 before embarking on a second wave of gains.
The Asian and European markets were closed at the time, so when Monday opens, the Asian and European markets will likely also interpret expectations for a rate cut and the impact of the non-farm payroll data on the market.
Therefore, gold is likely to continue its upward trend next Monday. Currently, the first resistance level is around 3375-3380. It's uncertain whether this resistance can be overcome, but if it breaks through and stabilizes above 3380, it's likely to continue to move towards 3400.
On the other hand, if 3375-3380 holds strong resistance, a retest of Friday's retracement lows of 3330-3340 is possible.
Thus, avoid blindly shorting at the opening of next week. If the market retraces back to around 3330, then a long position is possible. If the market opens directly testing the upward pressure level, then do not chase the long position, as there is a possibility of a pullback at the pressure level.
Will prices stage a comeback? Continue their upward trend?Information Summary:
Market participants currently expect the Federal Reserve to cut interest rates twice before the end of the year, starting in September. Earlier this week, the Fed maintained interest rates at 4.25%-4.50%. Powell stated that it was too early to determine whether a September rate cut would occur, citing the need to monitor inflation and employment data.
Market Analysis:
Looking at the 4-hour and 1-hour charts, gold's Bollinger Bands are showing signs of opening upward after Friday's sharp rise. However, it's important to note that a surge-like top opening typically lacks sustainability, and the Bollinger Bands will close again after returning to technical levels. Currently, prices are trading above the upper band, which is not conducive to a direct rise.
The 1-hour chart shows a blunting of the moving averages, and the upper Bollinger Band is about to close. Overall, while gold is strong, it's not appropriate to be overly bullish. Focus on shorting opportunities next Monday, and then consider a bullish outlook after a price correction.
In the short term, focus on resistance in the 3375-3385 range above, and support in the 3345-3335 range below, followed by support near 3315.
Trading Strategy:
Short around 3365-3375, stop loss at 3385, profit range 3345-3335-3315;
Go long on a pullback to 3335-3340, stop loss at 3325, profit range 3350-3360;

Has a bull market started? In-depth analysis.Friday's non-farm payroll report was unexpectedly disappointing, sending gold soaring.
Data released by the U.S. Department of Labor on Friday showed that non-farm payrolls added only 73,000 jobs in July, far below market expectations of 100,000. The weak employment report quickly shifted market sentiment regarding the Federal Reserve's policy path. Market expectations for a September rate cut have soared to 75%, with another cut expected before the end of the year.
This shift has provided strong support for gold prices. Amidst persistent inflationary pressures and disappointing employment data, a Fed rate cut would be a substantial boon for gold.
Friday's data triggered a sharp rise in gold prices on the daily chart, reversing a week-long decline. This is the first sign of a pattern that breaks a weak downward trend. Following consecutive declines, the daily chart began to rise, directly reversing a week's losses. This pattern is likely to continue next week, forming a bullish pattern, with a potential second leg higher. Therefore, next week will be crucial for bullish sentiment, with key focus on whether it can break through the highs and the continuity of the bullish trend.
The bullish trend is likely to continue next week. It's also important to note that Friday's pullback to around 3340 marked an inflection point, a watershed between bulls and bears and a secondary bullish level. Since Friday's close was near resistance, it's important to watch whether the market will surge directly next week or retreat before rising again. If the rally isn't sustained in the early Asian session, a correction is likely to occur, accumulating upward momentum.
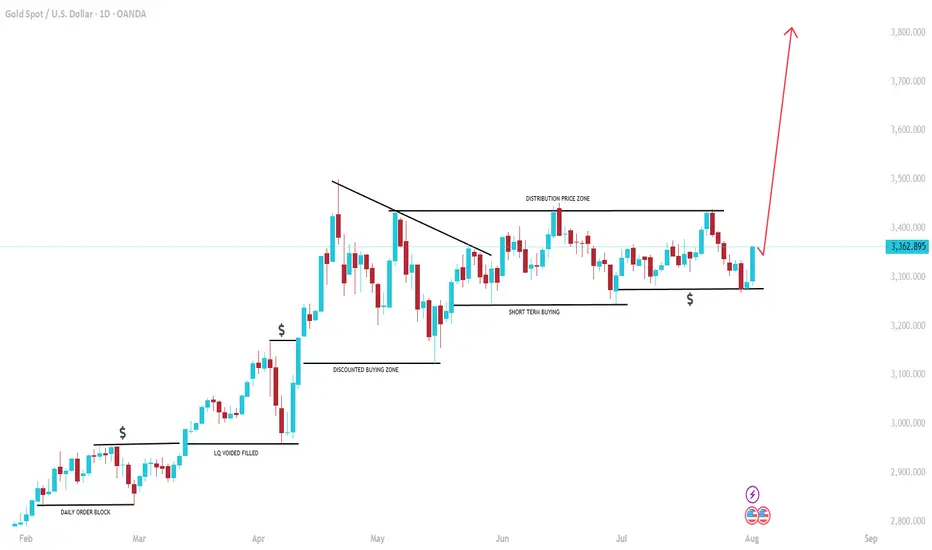
GOLD: $4000 on the way! Bulls has the controlGold is on the way hitting a record high since the global tension rising we can see gold creating another record high. Please note that it is a swing trades and may take weeks and months to hit the target or it may not even reach the target itself. This is prediction only so do your own due diligence.
Is the uptrend complete? Will there be a pullback?On the last trading day of this week, gold prices soared, rising nearly $56, driven by the non-farm payroll data. The rally began at 3300 and peaked near 3356. The price has now retreated slightly, fluctuating around 3345.
The current uptrend has repeatedly tested the resistance level near 3355 but has failed to break through. The RSI indicator hovered around 76.8, indicating a gradual flattening of the upward trend. The 3355 high is likely the end of this uptrend.
As this is the last day of a major data week, Quaid believes the current uptrend is complete. Consider a light short position around 3350-3355. The current low has yet to be confirmed, and the pullback is likely to end around 3335.
However, we cannot rule out the possibility that the price will remain within the upward channel with slight fluctuations on the last trading day of the week.

Impact of the Non-Farm Payrolls? Latest Analysis.Information Summary:
Most traders are turning their attention to the crucial US labor market report, which is being closely watched as the market actively searches for new clues regarding the timing of the next interest rate cut this year.
The July non-farm payrolls report will be released at 8:30 AM US time. US non-farm payrolls increased by 110,000 in July, seasonally adjusted, lower than the 147,000 increase in June. The US unemployment rate is expected to rise from 4.1% to 4.2% in July.
If the non-farm payrolls figure falls below 100,000 and the unemployment rate rises, it could signal a weakening job market, undermining the Fed's rekindled hawkish outlook and dampening the dollar's upward momentum. In this scenario, gold prices could re-cross the 3,400 mark. However, if the non-farm payrolls unexpectedly exceed 150,000, it could support the dollar's continued rise and hurt gold. Strong US employment data could rule out two rate cuts from the Fed this year.
Market Analysis:
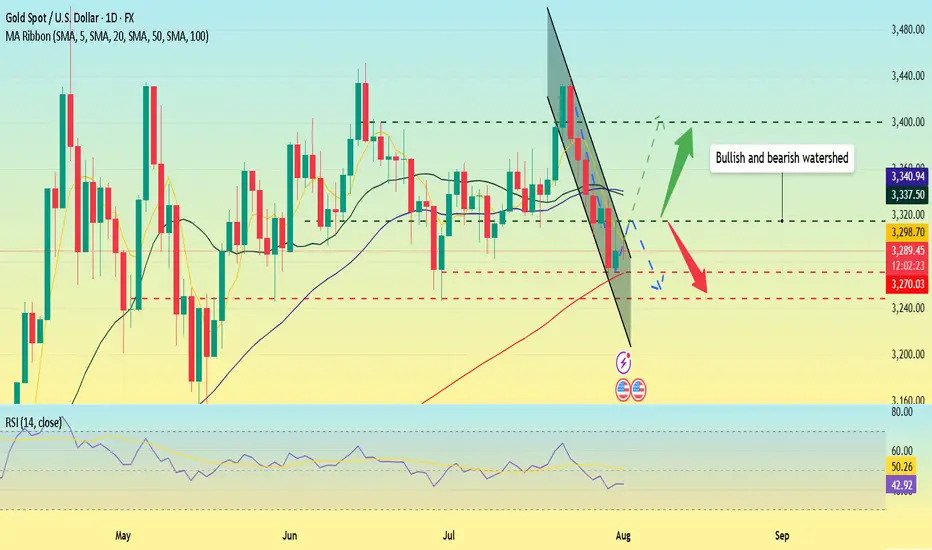
Quaid believes that the current moving average crossover is trending downward, and downward momentum is still in play. The RSI remains at 42.7, hovering below the midline, indicating that gold's downward trend remains intact. The 20-day moving average fell below the 50-day moving average on Wednesday, confirming the bearish momentum.
Therefore, if gold closes below the key support level of the 100-day moving average at $3,270 on a weekly basis, a new downtrend could begin, potentially leading to a drop towards the June 30 low of $3,248.
Quaid believes that the current bull-bear watershed needs to focus on around 3315, which is the previous intensive trading area and is also the first resistance position for short-term upward movement.
On the last trading day of Super Data Week, Quaid hopes that everyone has gained something and has a happy weekend; I wish you all good luck.
Non-farm payrolls are coming. Will it trigger the market?On Thursday, the US dollar index briefly rallied after the Federal Reserve's favorite inflation indicator unexpectedly rebounded, crossing the 100 mark for the first time in two months. This marked the sixth consecutive trading day of gains and the first monthly gain since 2025.
Spot gold rebounded as risk aversion lingered amid uncertainty surrounding Trump's tariff deadline, reaching a high of around $3,315, but its intraday gains narrowed after the release of the PCE data.
The dollar has already firmly established itself above the 100 mark on the daily chart, so the next target is likely to be between 101.5 and 102.0. Currently, support levels on the daily chart are visible at 99.5 and 99.0.
The gold market is currently consolidating in the 3315-3275 range. However, if the dollar rises again, Quaid believes gold prices could fall below 3275.
On the daily chart, if it falls below 3275, the price would likely be around 3250. If 3250 falls below, the market could test 3200. However, the possibility of a consolidation between 3315 and 3275 remains undisputed.
Before the release of the non-farm payroll data, scalping within this consolidation range is advisable. However, the risk is relatively high, so please take profits in time.

Non-farm payrolls are coming. What's the gold trend?Gold fell sharply on Wednesday, but Thursday's market didn't continue the downward trend as some investors expected. Instead, it showed a trend of rising and then falling.
From the daily perspective, we first need to focus on the resistance level near 3300 where the 5-day moving average is located. This position is not only a short-term technical resistance, but also reflects the market's psychological expectations to a certain extent. If prices can successfully break through this level and stabilize above it, it will indicate that bullish momentum is strengthening, potentially boosting market sentiment. At this point, the next resistance area to watch is the 3330-3340 range. This area converges the 10-day, 20-day and 30-day moving averages, forming a strong resistance band.
As for the support below, the primary focus is Wednesday's low of 3268. However, if this level is lost and the price continues to fall, the next support area will be around 3245, which is the previous low.
Trading strategy:
Short around 3300, stop loss at 3310, profit range 3280-3260.
The US dollar is strong. Be wary of gold.The US dollar index rose, now above 100, before retreating slightly and fluctuating slightly, reaching 100 for the first time in two months. After a sharp drop to around 3270 on Wednesday, gold rebounded sharply today. With the US dollar breaking through 100 and the USD/JPY pair breaking through 150, gold is now struggling to maintain its position.
Thus, Quaid believes it's not appropriate to be overly bullish on gold for now. A significant decline is likely.
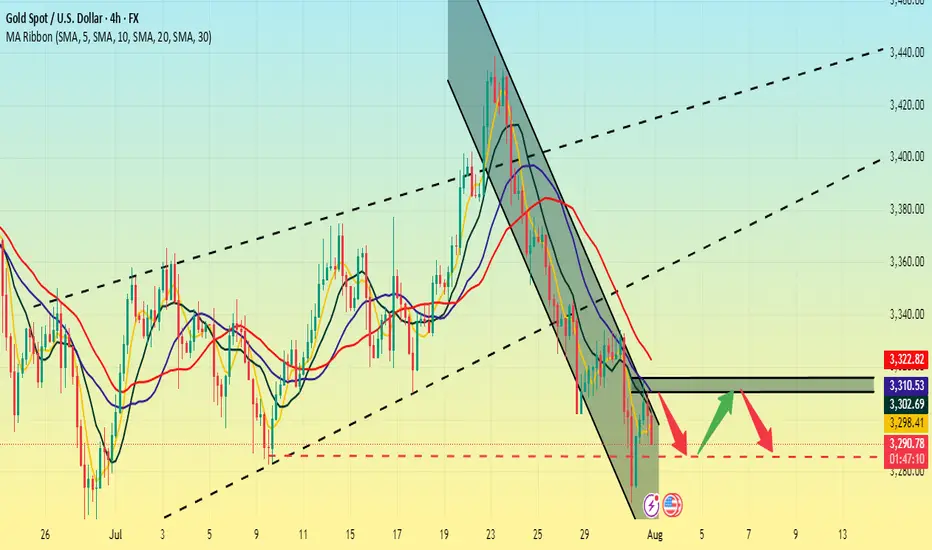
The 4-hour chart shows that the upper moving average resistance is currently around 3310-3315. If it breaks through 3315, it could potentially move towards 3325.
Conversely, if it fails to break through 3315 today, it could continue to consolidate in the 3315-3285 range. Waiting for new data to guide its trend.
AVAXUSDT Trend Analysis | Will Volume Confirm the Next Big Move?AVAXUSDT Trend Analysis | Will Volume Confirm the Next Big Move?
🔍 Let’s break down the AVAX/USDT setup, examining its technical structure and mapping out key opportunities as it gears up for a decisive move.
⏳ Daily Overview
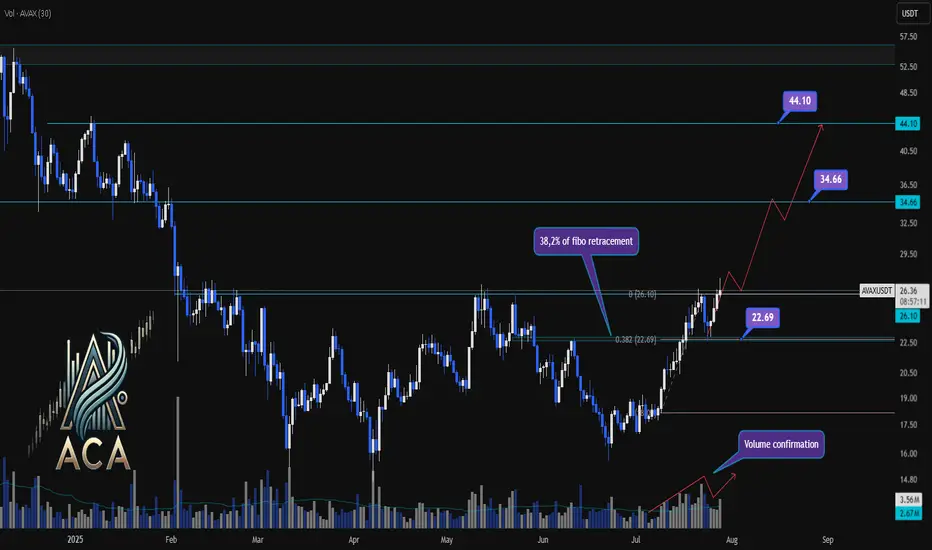
AVAXUSDT has been exhibiting a bullish structure, recently reacting to the 0.382 Fibonacci retracement level (around 22.69USDT) where price paused for a correction. This correction was technically healthy, as it occurred with declining volume, while upward impulses were marked by notable volume surges—signaling strong bullish participation and confirming accumulation phases.
🔺 Bullish Scenario:
The next area to watch is the resistance at 26.10USDT, which has acted as a major barrier in recent trading sessions. A decisive daily close above this level—preferably supported by a clear uptick in volume—would confirm breakout momentum and set the stage for further advances.
Upon confirmation, the chart points to medium- and long-term targets at 34.66USDT and eventually 44.10USDT. These levels are derived from key Fibonacci extensions and historic price reactions, offering logical take-profit zones for trend-following strategies.
📊 Key Highlights:
- 0.382 Fibonacci level (22.69USDT) acted as a reaction zone and healthy correction point.
- Volume profile validates trend: increased buying volume during upswings, decreased volume on dips.
- 26.10USDT is the next crucial resistance for confirmation.
- Breakout (with volume) opens path to 34.66USDT and 44.10USDT targets.
- Failure to clear 26.10USDT could result in consolidation or another retest lower.
🚨 Conclusion:
All eyes are on the 26.10USDT resistance. Wait for a clear daily close and volume confirmation before considering entries. A breakout above this level could propel AVAXUSDT towards higher Fibonacci targets, while a rejection may prompt another retest of prior supports or consolidation.
Stay sharp and plan your trades with discipline!
Gold remains unchanged. Still weak.Last Friday, gold rebounded around 3373, but the bullish momentum was insufficient, and then it bottomed out and fell sharply. The price fell below the short-term rising trend line support. At present, the MA5-10 daily moving average is in a high dead cross short arrangement. On this basis, Quaid believes that gold can still be bearish now. At present, the Asian market continues to fluctuate downward in the early trading. Today, we will focus on the support of 3310-3300.
The short-term price is currently maintained at around 3335, which can be regarded as the watershed between long and short today. If the European session stabilizes above the MA50 moving average, the trend will change to a certain extent. Now we still look at the bottom near 3300.
Operation strategy:
Short near 3340, stop loss 3350, profit range 3310-3300.

Gold is weak. It may break through next week.This week, gold rose and fell, rising for two consecutive days on Monday and Tuesday, and falling for three consecutive days from Wednesday to Friday. The weekly line finally closed with a small real body negative line with a long upper shadow.
Gold's trend this week was due to the strengthening of the US dollar and the progress in US-EU trade negotiations, which hit the safe-haven demand, leading to a decline in gold prices.
Next week, focus on multiple time points that may trigger market trends, including the Federal Reserve's decision, non-agricultural data, the August 1 tariff deadline, and the economic and trade talks between Chinese representatives in Sweden and the United States. These events may set the tone for the market in the second half of the year and need to be paid attention to.
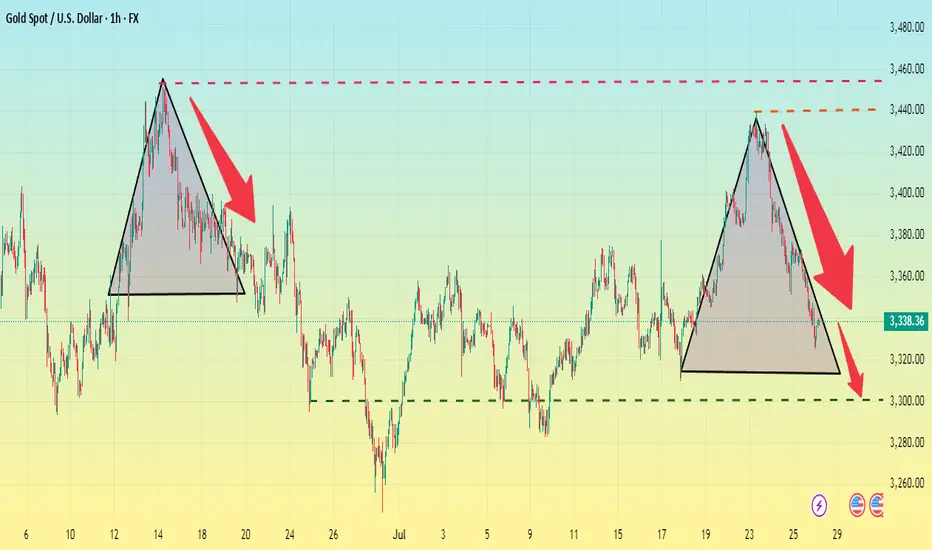
At the beginning of this week, we focused on the triangular convergence pattern formed by the high and low points since 3500 points. On Tuesday, gold broke through the pattern upward, but failed to stand firm on Wednesday. Instead, it fell to form a false breakthrough, and on Friday it fell to the lower edge of the triangular convergence range. However, from the perspective of the international futures market, the overall situation is still in the triangular convergence pattern and has not achieved an effective upward breakthrough. Based on this, we need to continue to keep a close eye on the changes in the triangle convergence pattern next week. The direction of its next breakthrough will have an important impact on the short-term trend.
Operation strategy:
Short near 3350, stop loss 3360, profit range 3320-3315. If the price continues to fall, you can hold a small position, and the area near 3300 is likely to be touched.
Gold is weak. Will it explode next week?Gold prices failed to stabilize above $3,400 after a bullish breakout this week. The technical outlook highlights the recent indecision of gold bulls.
In the first two trading days of this week, spot gold prices rose by 2.4%, but the cumulative decline in the last three trading days of this week reached nearly 3%. The sharp fluctuations this week were due to the positive progress in Trump's trade negotiations, and the rebound in market risk appetite, which hit the safe-haven demand for gold.
Looking at next week, the economic calendar will provide several high-impact data releases. The Federal Reserve will announce its monetary policy decision after the policy meeting on July 29-30; the US Bureau of Labor Statistics will release the July employment report; and some important news such as the US-China trade negotiations may trigger the next major move for gold.
From a technical perspective, the current market short-term technical outlook highlights the hesitation of gold buyers. The daily chart shows that the RSI is still slightly below 50, and gold prices have difficulty staying away from the 20-day and 50-day MAs after breaking through these two levels earlier this week.
On the upside, 3450 constitutes the first resistance for gold prices. If it breaks through this resistance, gold prices will most likely hit the 3400 integer mark again.
On the downside, if gold prices remain below 3340, technical sellers may still be interested. In this case, 3310 can serve as the first support level, followed by the second support level near 3285.
A new week is about to begin, and I wish all traders good luck.
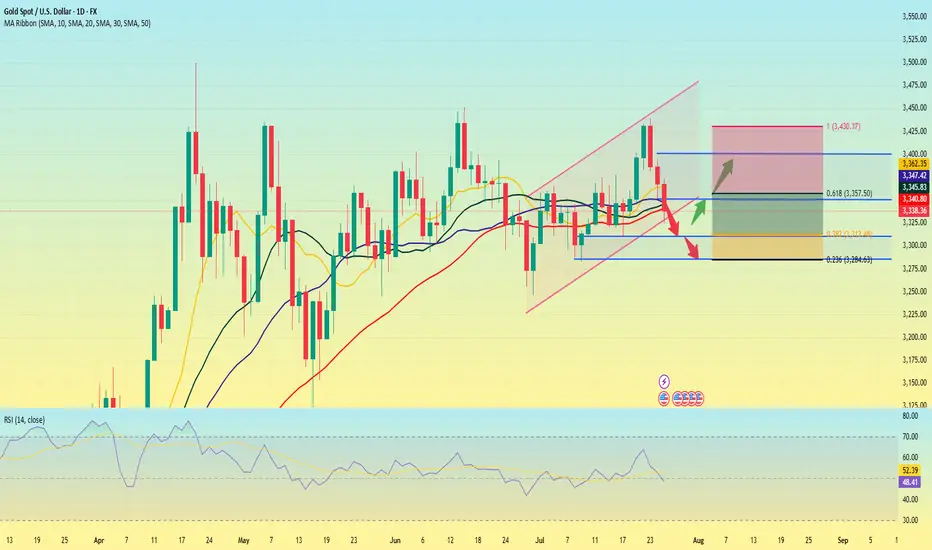
XAUUSD FORECASTThis is what we currently see on
GOLD.
We have 3500.103 key level as our current high zone and 3122.168 key level as our low zone. And Gold is been attempting to break 3435.00 key level resulting in selling, but been creating lower highs failing to break the created lows. Currently we a trading above the 3337.070 key level which is a critical key level, as it will determine the next coming movement.
Update will be given
