Analyse


EUR/USD Chart Analysis - Bearish Breakdown Towards Target📉 Pattern & Market Structure:
The chart shows an ascending channel that was previously supporting price action. However, the price has broken below the lower trendline, confirming a bearish breakdown.
The recent price action suggests a shift from bullish momentum to bearish sentiment.
📉 Price Action & Target:
A breakdown from the channel suggests further downside movement.
The price is currently around 1.07556, with a potential target of 1.05089 based on the measured move from the broken channel.
This target aligns with a key support level.
📌 Trading Plan:
Bears may look for sell opportunities below 1.07602.
Confirmation of further downside can be seen if the price stays below previous support-turned-resistance levels.
Bulls might wait for a potential reversal near the target zone.
⚠️ Risk Management:
Watch for pullbacks or retests of the broken support before entering a short position.
A break back above 1.08765 could invalidate the bearish setup.


Trading opportunity for AMP AMPUSDTBased on technical factors there is a Buy position in :
📊 AMPUSDT
🔵 Buy Now or by Breakout
🪫Stop loss 0.003700
🔋Target 0.006000
📏 R/R 3,5
💸RISK : 1%
We hope it is profitable for you ❤️
Please support our activity with your likes👍 and comments📝

3/25 Gold Signal: 3009-3023 short, 2996-2982 longThe gold price rose above 3012. The long orders entered near 3004-2996 before the closing are currently profitable. From the trend pattern, there is still room for rebound, but it will take some time. During this process, the price may fluctuate. For friends who have already made profits, it is not worthwhile to bear the risk of profit taking, so this order can be closed first. Of course, if you don’t mind this risk, you can continue to hold it. I expect the rebound resistance to be around 3018.
In terms of the current big trend, the better long opportunities may be more inclined to the 2996-2982 area, because this is the starting point of the previous rise, and it can be regarded as a strong support platform. Usually in this case, the probability and amplitude of the rebound will be higher. Of course, if there is a reverse impact from news, asymmetric fluctuations are also possible.
Today’s main focus is the integer support of 3000. If it falls below, consider the support of the large range of 2996-2982, and the second is the resistance of the range of 3015-3023 during the current rebound.
The overall trading plan is that if the price falls below 3000, long positions will be opened in batches in the 2998-2986 range. If the rebound cannot break through 3023, short positions will be traded in batches in the 3009-3021 range.
I will update the specific transaction details in real time, so you can check them in time. If you have any questions, please leave a message at any time.

Gold: Trading signals during the European sessionGold is now making its first attempt at resistance. In this process, we can use the black trend line below and the purple trend line as reference support.
If the price does not actually fall below the test, there is a high probability that it will reach the 3037-3044 area. Therefore, during the European trading period, the 3037-3044 area can be used as an opportunity to enter the short position.
At the same time, pay attention to the long opportunities brought by the support area. For conservative trading, the area near 3025 can be used as an entry time.

XAUUSD - Bearish Quasimodo Pattern Triggered Gold (XAU/USD) has formed a classic Quasimodo pattern on the 1H timeframe, signaling a potential bearish reversal after a strong uptrend.
🔍 Pattern Breakdown:
The structure resembles a Head & Shoulders, with a more complex formation known as the Quasimodo Pattern.
We see a clear Left Shoulder, Head, and Right Shoulder, followed by a breakdown below the neckline.
A successful retest of the neckline as resistance confirms the bearish momentum.
🎯 Target Zone:
Based on the height of the pattern, the projected target lies in the 2960–2970 region, aligning with a previous demand zone.
The expected drop is approximately -2.10%, matching the prior rally before the reversal pattern.
📌 Key Levels:
Breakdown Level: ~3030
Current Price: ~3024
Target: ~2960–2970
⚠️ Watch for:
Bearish follow-through after the retest.
Potential reaction in the highlighted target zone (yellow box).
This setup provides a great opportunity for short sellers if momentum continues to the downside. Risk management is key as always!

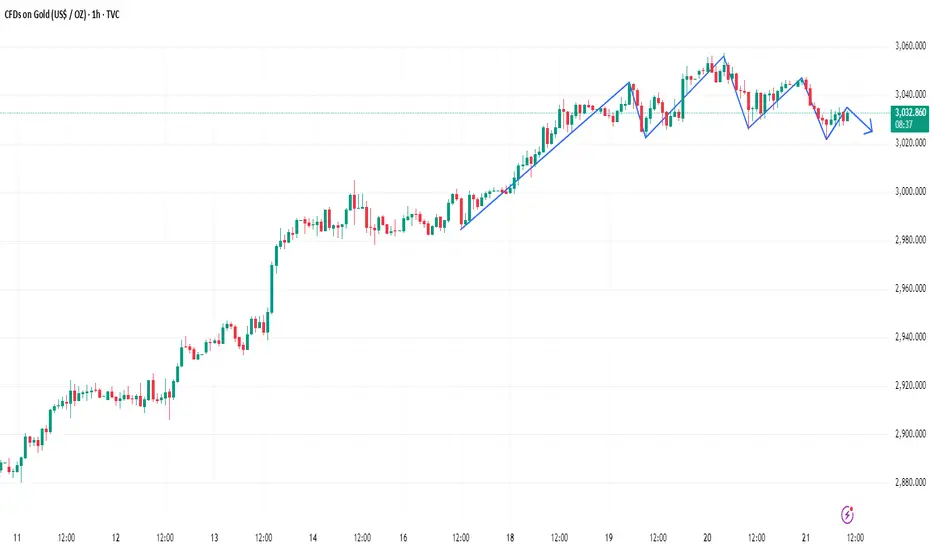
Can gold be shorted directly?The 1-hour moving average of gold has begun to turn slightly downward, and the strength of gold bulls has been suppressed. The 1-hour gold has now formed a head and shoulders pattern. If the strength of gold's rebound is limited, then the room for further decline of gold will increase.
Trading idea: short gold around 3032, stop loss 3042, target 3022
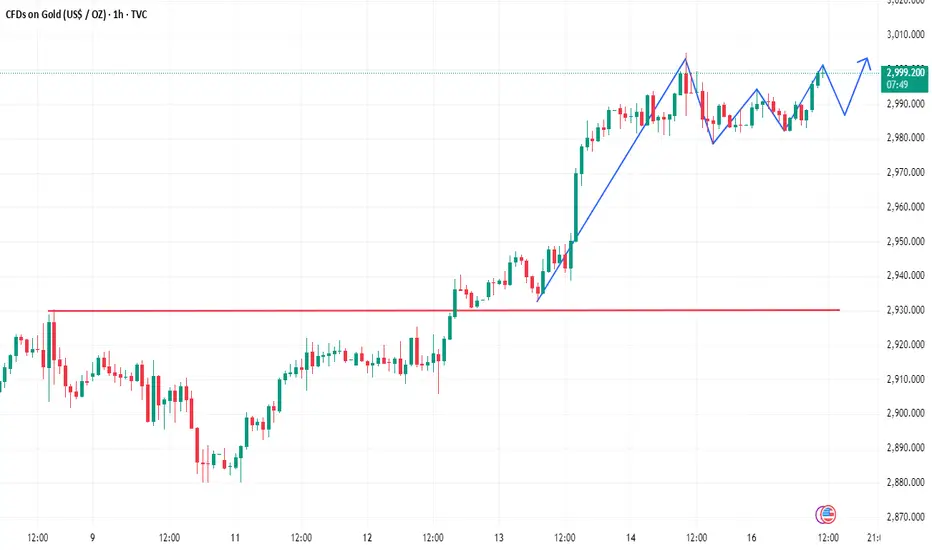
Can gold continue to go long?
The 1-hour moving average of gold continues to spread upward, and the strength of gold bulls is still relatively strong. Gold's moving average support has now moved up to around 2983, and today's low for gold is around 2982, so gold still forms a strong support around here. I think gold can be shorted first, and then it can continue to go long if gold falls back around 2985
XAUUSD:Trading Strategy for Next WeekAfter a significant rally, it is reasonable for the gold price to experience a short-term pullback and adjustment. In the short term, the bullish trend of gold has not been reversed.
diverging upwards in a bullish manner, indicating that the bullish momentum of gold remains intact. Unless the moving averages start to turn downwards next week, the bullish momentum of gold may be affected.
The support level of the gold moving averages has now shifted up to around $2,968. Next week, one can continue to go long on gold at dips above $2,968. Continue to pay attention to the resistance near the high of around $3,005.
Suggestions for gold trading operations next week:
buy@2970-2975
SL:2963
TP:2998
I always firmly believe that profit is the sole criterion for measuring strength. I will share accurate trading signals every day. Follow my lead and wealth will surely come rolling in. Click on my profile for your guide.

XAU/USD "The Gold vs U.S Dollar" Metal Market Heist Plan🌟Hi! Hola! Ola! Bonjour! Hallo! Marhaba!🌟
Dear Money Makers & Robbers, 🤑💰🐱👤🐱🏍
Based on 🔥Thief Trading style technical and fundamental analysis🔥, here is our master plan to heist the XAU/USD "The Gold vs U.S Dollar" Metal market. Please adhere to the strategy I've outlined in the chart, which emphasizes long entry and short entry. 🏆💸Book Profits, Be wealthy and safe trade.💪🏆🎉
Entry 📈 :
"The loot's within reach! Wait for the breakout, then grab your share - whether you're a Bullish thief or a Bearish bandit!"
Buy entry above 2960.00
Sell Entry below 2925.00
However, I recommended to place buy stop for bullish side and sell stop for bearish side.
Stop Loss 🛑:
-Thief SL placed at 2920.00 for Bullish Trade
-Thief SL placed at 2955.00 for Bearish Trade
Using the 30min period, the recent / swing low or high level.
SL is based on your risk of the trade, lot size and how many multiple orders you have to take.
Target 🎯:
-Bullish Robbers TP 3030.00 (or) Escape Before the Target
-Bearish Robbers TP 2880.00 (or) Escape Before the Target
📰🗞️Fundamental, Macro Economics, COT data, Sentimental Outlook:
XAU/USD "The Gold vs U.S Dollar" Metal market is currently experiencing a Neutral trend (there is a higher chance for Bullishness)., driven by several key factors.
⭐Fundamental Analysis
The current price of XAU/USD is 2940.00, indicating a strong bullish trend. The gold market is driven by various fundamental factors, including:
Inflation concerns: Rising inflation expectations and a potential decline in the US dollar may boost gold prices.
Interest rate policies: The US Federal Reserve's interest rate decisions may impact gold prices.
Global economic uncertainty: Ongoing trade tensions, Brexit uncertainty, and geopolitical risks may drive safe-haven demand for gold.
⭐Macro Economics
The global economic outlook is uncertain, with:
Recession concerns: Weak economic data and trade tensions have raised concerns about a potential global recession.
Central bank rate hikes: The US Federal Reserve and other central banks may continue to raise interest rates, impacting currency markets.
Inflation expectations: Rising inflation expectations may boost gold prices.
⭐COT Data
Commercial Traders: Net short 143,000 contracts (a decrease of 11,000 contracts from the previous week)
Non-Commercial Traders: Net long 104,000 contracts (an increase of 8,000 contracts from the previous week)
Non-Reportable Positions: Net long 39,000 contracts (an increase of 3,000 contracts from the previous week)
Open Interest: 544,000 contracts (a decrease of 10,000 contracts from the previous week)
⭐Market Sentimental Analysis
Market sentiment for XAU/USD is:
Bullish: 62% of investors expect gold prices to rise, driven by inflation concerns and global economic uncertainty.
Bearish: 21% of investors expect gold prices to fall, driven by potential US dollar strength and interest rate hikes.
Neutral: 17% of investors remain neutral, awaiting further market developments.
⭐Intermarket Analysis
The XAU/USD pair is highly correlated with:
USD Index: A weaker US dollar may boost gold prices.
10-Year Treasury Yield: Lower yields may increase demand for gold.
S&P 500: A decline in the S&P 500 may drive safe-haven demand for gold.
⭐News and Events
Upcoming events that may impact the XAU/USD pair include:
US Federal Reserve Interest Rate Decision: March 15, 2025
US GDP Growth Rate: March 25, 2025
US Inflation Rate: March 29, 2025
⭐Seasonality
Gold prices tend to be:
Stronger during the winter months: Due to increased demand for jewelry and coins.
Weaker during the summer months: Due to decreased demand for jewelry and coins.
⭐Positioning Analysis
Traders are advised to:
Consider long-term investments: As gold prices are expected to rise due to inflation concerns and global economic uncertainty.
Monitor market volatility: As interest rate hikes and US dollar strength may impact gold prices.
Diversify portfolios: By investing in other assets, such as currencies, stocks, or bonds.
⭐Next Trend Move
The XAU/USD pair may experience a:
Bullish move: Driven by inflation concerns and the US Federal Reserve's potential interest rate hikes.
Bearish move: If the US dollar strengthens or global economic uncertainty increases.
⭐Overall Summary Outlook
The XAU/USD pair is expected to experience volatility due to:
Global economic uncertainty: Ongoing trade tensions, Brexit uncertainty, and geopolitical risks.
Inflation concerns: Rising inflation expectations and a potential decline in the US dollar.
Central bank rate hikes: The US Federal Reserve and other central banks may continue to raise interest rates.
⚠️Trading Alert : News Releases and Position Management 📰 🗞️ 🚫🚏
As a reminder, news releases can have a significant impact on market prices and volatility. To minimize potential losses and protect your running positions,
we recommend the following:
Avoid taking new trades during news releases
Use trailing stop-loss orders to protect your running positions and lock in profits
💖Supporting our robbery plan will enable us to effortlessly make and steal money 💰💵 Tell your friends, Colleagues and family to follow, like, and share. Boost the strength of our robbery team. Every day in this market make money with ease by using the Thief Trading Style.🏆💪🤝❤️🎉🚀
I'll see you soon with another heist plan, so stay tuned 🤑🐱👤🤗🤩

XAUUSD, Expecting sell from 2913.3XAUUSD, I am Expecting sell from 2913.3 with lowertime frame confirmation of 1 minute with the targets of 2900 & 2885.
good luck

Xauusd analysis This chart represents the price movement of Gold (XAU/USD) on a 1-hour timeframe, with key technical levels and a potential price movement scenario.
Analysis:
1. Resistance Level:
The chart highlights a resistance level around the 2,929 price zone, marked by a purple horizontal line.
The price has struggled to break above this level multiple times, indicating strong selling pressure.
2. Support Level:
A support level is identified near 2,895, shown with a white horizontal line.
The price has bounced off this level in previous instances, suggesting strong buying interest.
3. Potential Price Movement:
The projection suggests that the price may first attempt to break above the resistance level.
If it fails to sustain above resistance, it could lead to a reversal and a decline toward the support zone.
If the support level holds, a rebound may occur.
Conclusion:
This setup indicates a range-bound market, where traders might look for sell opportunities near resistance and buy opportunities at support until a breakout occurs in either direction. A decisive breakout above resistance or below support would determine the next trend direction.

The US index is at support level for again pull backThe US index is at support level; just mark the news of Dollars today and wait for confirmations on the H4 level to take the good trades.
Keep in mind!!!!!
If the US index gains some strength from the said level (103.84–103.10) and starts bullish, then the major pairs like EURUSD, GBPUSD, and XAUUSD start falling.

Gold📌 **Sell:**
✔ In short-term timeframes (M1, M5, M15), both MACD and Stochastic indicate overbought conditions and a potential downward correction.
✔ The M30 timeframe is still in an uptrend, but a pullback to the downside is possible.
🎯 **Conclusion:**
Success rate for selling: ✅ **70%** (more reliable than buying in the short term).
📌 **Strategy:** Short-term selling with a tight stop-loss and a corrective target towards lower support levels.
📌 **Buy:**
✔ In H1 and H4 timeframes, signs of a trend reversal are emerging, but MACD has not yet given a solid confirmation.
✔ If MACD turns bullish on H1 and Stochastic exits oversold territory, buying will be a safer option.
🎯 **Conclusion:**
Success rate for buying: ✅ **55%** (higher risk, requiring more confirmation).
📌 **Strategy:** Wait for MACD confirmation on H1, then enter a buy position upon resistance breakout.
🚀 **Final Recommendation:**
🔹 Enter short-term sell positions in lower timeframes with a tight stop-loss and proper risk management.
🔹 Wait for a confirmed buy signal on H1 and H4, as MACD has not yet turned fully bullish.
🚀 **Short-term selling (scalping) is more probable**, but additional confirmation is needed for a buy position.
### **Suggested Targets Based on Timeframes & MACD + Stochastic Analysis**
🔴 📉 **Sell Targets:**
Considering overbought conditions in lower timeframes and a potential downward correction, the best sell targets based on different timeframes are:
✅ 📌 **First Target:** 2850 (Short-term support in M5 & M15)
✅ 📌 **Second Target:** 2842 (Key support in M30)
✅ 📌 **Third Target:** 2830 - 2825 (Strong support in H1, aligning with the moving average)
🛑 **Stop Loss for Sell Positions:**
🔹 **2862** (Breakout of the current resistance in M15 & M30)
🔹 **2868** (If the price reaches this level, the trend may reverse)
---
🟢 📈 **Buy Targets:**
A **full confirmation from MACD in H1 and H4** is required for a buy setup. However, if the price rebounds from the **2830 support zone**, the following targets are expected:
✅ 📌 **First Target:** 2865 (Initial resistance in H1)
✅ 📌 **Second Target:** 2880 - 2890 (Strong resistance zone in H4)
✅ 📌 **Third Target:** 2915 (Long-term target if resistance levels are broken)
🛑 **Stop Loss for Buy Positions:**
🔹 **2825** (If this level is broken, the downtrend is likely to continue)
🚀 **Suggested Strategy:**
📌 **Short-term sell (scalping) from 2857**, targeting **2850 and 2842**, with a **stop loss at 2862**.
📌 **Buy if confirmed at 2830 - 2825**, targeting **2865 and 2880**, with a **stop loss at 2825**.
🔍 **Important:** Before entering positions, confirm with **trading volume and candlestick patterns in higher timeframes**. 🚀


BE ALERT AUDJPY IN SUPPORT ZONE.Audjpy in support zone of Daily Timeframe if Any Daily Candle Give Us Confirm To Prices Go Up Market Will Go Their Rest Lequidity Areas To Hunt Or Fill The FVGs Of Sell Side.
Tip! Trading, like any high-performance endeavor, requires skill, focus, and discipline. Those who are in it for the money alone aren’t likely to focus on the process of being a good trader.

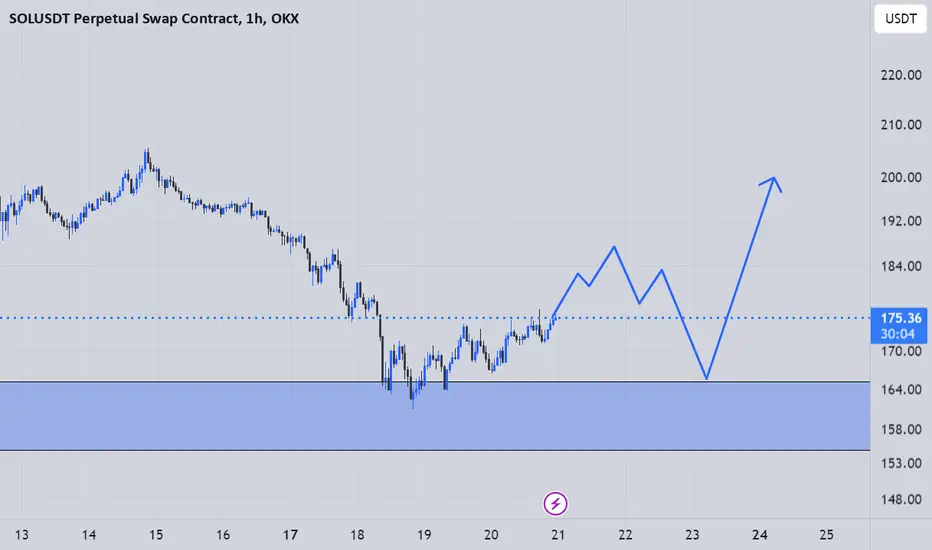
solusdt long setup solana"🌟 Welcome to Golden Candle! 🌟
We're a team of 📈 passionate traders 📉 who love sharing our 🔍 technical analysis insights 🔎 with the TradingView community. 🌎
Our goal is to provide 💡 valuable perspectives 💡 on market trends and patterns, but 🚫 please note that our analyses are not intended as buy or sell recommendations. 🚫
Instead, they reflect our own 💭 personal attitudes and thoughts. 💭
Follow along and 📚 learn 📚 from our analyses! 📊💡"
AUDNZDWe detect a strong demand zone now if the price come back and show as confirmation we take it long to the next supply zone
LR

BTC/USD M15 - buy zonesin this chart you can see the 2 levels I've marked out. these levels are based on LQ and FVG. according to me these levels are the best area for buying.

XAUUSD is still on bullish rally In our previous commantary we mentioned have 2930 on mark.
As we have closed our buy orders at 2928 and
our entry was 2908.
What possible scenario do we have?
At moment selling is limited, we are expecting a little correction at 2930-28 ,where we have possible buying options till 2950 first 2963 in extension.
On the other hand, if 2930 invalidated then our buying will be invalid and we'll wait for the structural support at 2920.
Below 2920 we have 2880 on mark.

Closing my buy orders at 2928(200 Pips)
XAUUSD Closing my buy orders at 200 pips profit.
As discussed throughout my Today's commentary.
I have engaged buying order at 2908 and my optimal Target was 2945 in extension as I closed my first attempt at 2928 (200 pips profit)which is very impressive
Also, I have closed my re-Buy order ($2918 to 2928) on a fine 100 pips .
Tomorrow we'll agin buy after the correction
