NASDAQ 4hour : fibo61 12500 is upper targetif you have sell 100% close and pick buy dont forget end of year +rally can start
personaly i belive nasdaq will go to 15000 area in long term so advice 90% looking for buy and be careful from sell and put SL
goodluck
Analyse

dax 4hour scenario : dax reach fibo61 daily ,now must go down we have 3 gap on phisical cash DAX INDEX ,personaly i think red scenario will happend THEN as i predict in low, before dax will see 14800-15000 area
AC indicator show new +up trend will start if if if last low 14500 not break ,,,,if 14500 break signal will switch to sell
ALERT: END OF YEAR +RALLY CAN START
good luck

gold daily : fibo50 : 1840 is in mind of pro traders we have 2 important fibo in left , personaly i belive gold will reach fibo61 1900
break last candel,friday high is powerful buy signal ,so if you dont have buy ,you can put low size buystop on last high 1761
AC indicator give buy signal,if last low not break we will see +up trend in coming days
big banks net open buy increase in last 2 week
so 90% looking for buy and when gold go up ,dont pick reverse sell it can go upper without pullback and dont allow you exit from sell , never forget gold love buy and go up wild
good luck

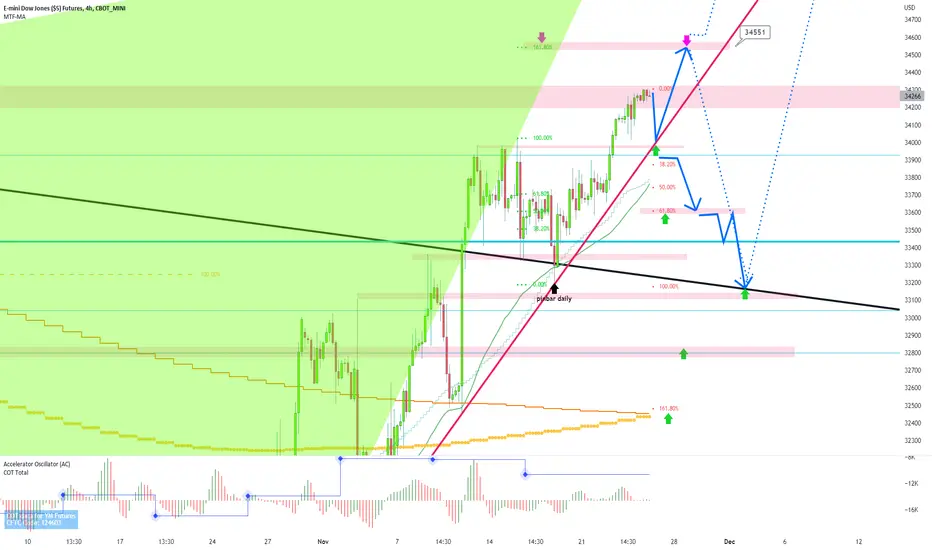
dowjones 4hour : all scenario on dow 1-70% go down and touch support and go up to fibo161
2-30% go down break support and go downer
above green arrow after pinbar come on 1hour or 4hour or daily chart we must buy Sl: pinbar low and hold to new high ok?
if you have old sell,you must close all or hedge them in fibo50 33760-33770...dont forget dow,index, dax sp500 and gold love buy and uptrend so sell on them is very very dangerous..check weekly chart exactly
note: as predict 10 days ago in low dow can go to 35000 even 3600 so be careful from sell and 90% looking for buy
ALERT: END OF YEAR UP TREND RALLY ON INDEX LIKE DAX NASDAQ SP500 AND DOW CAN START
good luck
crude oil : doble bottom pattern, going to 86.00oil if dont break low,has poweful buy now ,so we advice buy it now but put SL in low,,,if low break downtrend can start
note: trade oil need minimum 5 year practice on demo , it is very complex and trendy market
good luck

nasdaq 1hour : fibo161 show nasdaq target is 12500if you cant pick buy in low,above green arrow you can pick buy after pinbar come on 1h-4h-daily chart ok?
my buys still is open from 11550 and want hold them minimum to 12500,,,can take 7-8 day....in 12500 we have fibo61 daily too
if you have old sell you must close all or hedge them above green arrow ,daily chart tecknical say nasdaq can go to 13000,,, end of year rally
good luck

gold 1hour : frist upper target is fibo61 : 1765pinbar and daily AC indicator give us good buy signal , now AC daily is green and this mean +up trend will start ,if low not break
fibo161 show us 2nd target 1822 so dont close your buy soon
if you have sell,you must close or hedge them now
under red arrow after pinbar comes we can pick sell but very low size and with sl on pinbar high
upper big trendline in 1788 is very important,break it is door for 1900-1920 area ,,,i think this trendline will break
wish you win

GOLD update 2 : buy pinbar comes,looking for buy i pick buy again,,,let see gold futures daily chart candels and AC indicator , it is clear buy
gold after little zigzag will start wave of uptrend to 1840 area
if you have sell, close all and pick buy
dont close your buy soon like new traders ok? try hold it 7-8 day minimum to 1800 , i will inform you where close buy, daily chart technical say gold can see 1900 area
see you in 1800 area lol

gold 4 hour : are you ready for buy gold?2 place i will buy gold 1731 and 1722 with SL1714 then will hold them 7-8 day
technical say gold 1st target is 1840 and then 2st target is near 1900 ,fibo61 daily so dont close your buy soon, after 10.00 point move SL to open price and let it go 7-8 day
bad scenario :if news come and gold break 1715 can go down to 1682, i will buy again there
when gold start go up dont pick reverse sell understand? reverse sell on gold is very dangrous , only under red arrow we can pick very low size sell after sell pinbar come with sl on pinbar high
good luck , if posation win please send me 10$ CHEER from my profile i can buy tradingview subescribtion,becouse i am in iran and for sanctions icant buy myself , thanks
www.tradingview.com

eurusd daily : dont pick sell ,looking for buy in 1.010 and holdin 1-3 day eurusd can go down but we are in start of up trend , dont sell and wait above green arrow pick low size buy and hold it 20-30 day minimum to 1.0000
personaly i belive eurusd main trend will go up ,,, upper long term target is fibo61 :1.12222 so strongly advice dont pick sell, looking for buy in deep and hold to new high
wish you win

gold daily : gold upper target is 1900 area break high is very powerful buy signal for gold
technical say gold can see 1730 support then start new wild uptrend to 1900.. but fibo161 show gold main longterm upper target in 2300 area for 2023 for this still 90% looking for buy in deep and be careful from sell on gold
good luck

dollar index daily: it has buy but main trend is down to102under red arrow we advice sell and hold it 10-15 day
if dollar index break 109 support it can start uptrend to122
above 102.300 and green arrow we advice buy and hold it
goodluck

DOWJONES 4hour : be careful from sell , upper target is 360002 scenario on dow possible
1- if it can break high door will open to 36000
2-in bad scenario with bad news it can go down to fibo50 then start wave2 of uptrend WE MUST BUY IT ABOVE GREEN ARROW AFTER PINBAR APPEAR IN 1HOUR,4HOUR,DAILY CHART and hold it 7-8 day to 36000 area
if you have old sell, close them soon as soon or hedge them with higher size: 1.5*total sell size
ALERT : NEW YEAR WILD RALLY CAN START SO DONT PICK SELL ,LOOKING FOR BUY dont forget like gold DOW love buy and upside trend
good luck

Gold pumpI will be waiting for xau to break the downwards trend line on a lowertime frame before jumping into the buy which should run up to 1856.739. The pump should be a big one

NASDAQ daily : technical say EMA200 daily 12500 is targetwe strongly advice looking for buy and hold it 7-8 day minimum to EMA200 daily ,orange big line
we can see big banks start buy nasdaq COT data
if nasdaq break red trendline .door will open for 14444 fibo61, then 15000 area
if bad news come and pinbar low break , nasdaq can go down and we must buy it above green arrow and hold them to 12500
if you have old sell you must put sl or hedge buystop on last high 12111, break 12111 high is powerful buy signal for many traders
wish you win

DAX 1hour : 2 scenario possible , we have open gap in downfor buy wait for 14270 area and buy on gap and hold it 3-4 day
if you have old sell, you must close all or hedge them in gap
upper target is 14555 then 14800
keep monitor AC indicator on 4hourchart, it is full green now ,if high not break it has sell signal
strongly advice 90% looking for buy in deep above 14000
good luck

NASDAQ 4hour :nasdaq upper target is 12500 areanasdaq evening mini crash was stupid against dow,dax led by twitter
but we still belive nasdaq will go up
if low break ,it can go down to fibo61 then start wave of up trend
to see butterfly pattern on daily chart please zoomout chart
wish you win

NASDAQ 4hour : 12400 is upper target all pro trader eye on fibo161 12400
scenario possible : break low and go little down to near green arrow then start up wave 2 or break 11800 trendline and go upper in next 5-6 day
advice: strongly advice 90% looking for buy and dont close it soon ,if big news not come nasdaq will see 13000 area soon
good luck

EURUSD daily : trend will be up to 1.09000eurusd try touch fibo50 near 1.09000
for coming days eurusd little can go down but trend will +up and technical say it can go to fibo61 1.120000
so above green arrow on chart,after pinbar come on higher timeframe 1h-4h-daily chart dont fear pick buy and hold it 30-40 day to fibo50 near 1.09000
strongly advice dont pick sell and looking for buy in deep
wish you win

gold 4hour: do you remember i draw this butterfly in low 1622 ?now technical say we have powerful sell why?
AC indicator daily turn red ,if high not break meqan downtrend will start soon
big trend line touch in high
butterfly pattern sell signal
for pick buy dont hurryup ok? wait 1730 area and pinbar on 1h-4h-daily chart , sl in pinbar low like always
if you have old sells,you must close all in 1730
i predict gold downtrend end and we are in 1s wave of up trend , gold can go to 1920 then 2300 dollar in 2023 so be careful from pick sell
wish you win stand in very low size ,,, in trade levrage above 1-20 and big size =margin call soon or late
best size i use for trade gold and index is per 10.000 dollar balance max 0.1 lot

gold 4hour: are you ready for sell under 3 red arrow?dont hurryup wait sell pinbar come in 1hour or 4hour or daily chart then pick sell with SL on pinbar high
dont close them soon.... after 10.00 point move SL to open price and let it go 2-3 day
www.tradingview.com
wish you win

nasdaq 4hour : buystop on high is good idea...12500 is targetif big news not come , nasdaq upper target is fibo 61 12500 so be careful from sell
if you have old sell you must close all above 11525 and after pinbar come pick buy and hold 7-8 day
wish you win

DOW 4hour : year end rally can start, dow can go up to 36000strongly advice dont pick sell, looking for buy signal and buy pinbar for hold to new high
if you have old sell you must close all near 33000
good luck
