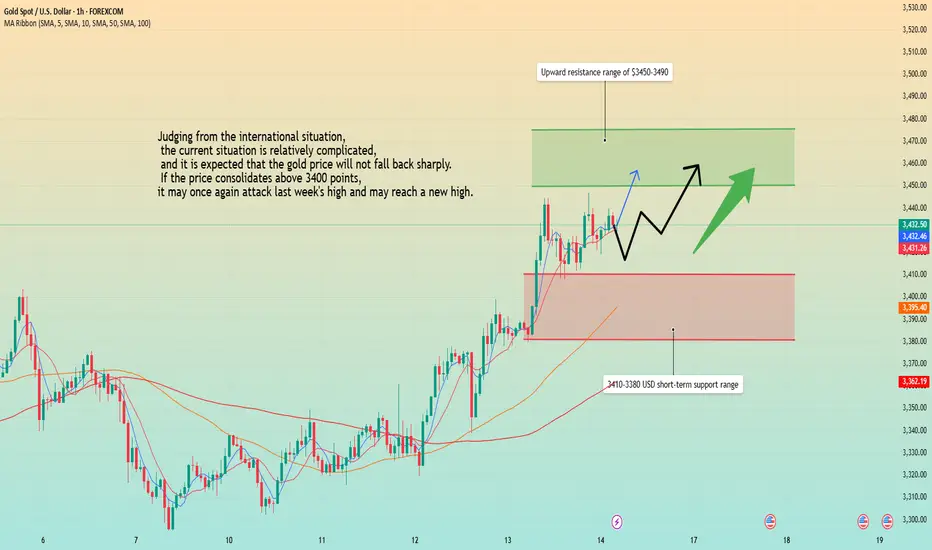
The international situation is bad. Gold fell back.Information summary:
Latest news: Israeli fighter jets "flew freely" over Tehran, and Iran lost air supremacy over the entire west. Israel's goal turned to a wider range of Iranian military and infrastructure.
Iran's counterattack, Tel Aviv, Haifa and other Israeli cities are being attacked by Iranian missiles. Both sides are currently suffering heavy losses.
But the price of gold fell back at this time; I think the biggest reason is that this week, the global "super central bank week" is about to hit, the market will usher in a very critical Federal Reserve interest rate decision, and central banks such as Japan, Switzerland and the United Kingdom will also hold monetary policy meetings one after another, and investors are on high alert. Under the influence of multiple conditions, the price of gold has a technical correction.
Technical analysis:
From a technical point of view, the impact of the conflict in the Middle East did not directly push up prices, but instead rushed up and fell back, which shows that the market has great pressure on the upward trend. Therefore, for the upward trend, it is necessary to be relatively conservative.
From the position point of view, the support below is around 3410.
From a trading perspective, most traders are waiting for the release of some data, which will change the overall trend of gold. However, according to the latest analysis of 14 Wall Street analysts, 10 analysts expect prices to continue to rise.
So I guess that this time the gold price pullback is accumulating energy for upward movement. At present, the price has started to rise after falling back to around 3410. The point of this pullback rebound is expected to stop around 3440, and then start to fluctuate at a high level.
If the price breaks through 3440 strongly and stabilizes above this position, the price may hit the upward pressure level of 3455 again.
Analyse

Analysis of gold trend on June 16!
📣Gold information:
Gold prices (XAU/USD) climbed to $3,445 in early Asian trading on Monday, the highest level in more than a month, as rising tensions in the Middle East and expectations of a rate cut by the Federal Reserve boosted demand for safe-haven assets.
Investors remain focused on geopolitical risks despite stronger-than-expected U.S. economic data on Friday. The University of Michigan's consumer confidence index jumped to 60.5 in June, well above market expectations of 53.5 and 52.2 in May. However, the market largely shrugged off the data. Instead, attention turned to the escalating conflict in the Middle East, with Israel's recent attack on Iran fueling concerns about instability in the wider region. In response, Iranian authorities warned that they would "respond firmly to any adventurism," which boosted gold's appeal amid global uncertainty.
⭐️Technical review and analysis: For the current short-term operation of gold, it is recommended to rebound high and go long, with the upward resistance level of 3450-3500 and the downward support level of 3385-3335.
⭐️Set gold price:
🔥Sell gold area: 3465-3475 SL 3485
TP1: $3450
TP2: $3430
🔥Buy gold area: $3390-$3388 SL $3383
TP1: $3400
TP2: $3422

Gold Spot / U.S. Dollar - 1 Hour FX Chartthe 1-hour price movement of Gold Spot (XAUUSD) against the U.S. Dollar, with the current price at 3,418.02, reflecting a decrease of 15.96 (-0.46%). The chart includes a candlestick pattern showing recent trends, with a highlighted upward movement and key price levels marked at 3,405.38, 3,392.15, 3,360.00, and 3,320.00. The time frame spans from 6 AM to 1 PM on June 16, 2025.

Gold Spot / U.S. Dollar (XAUUSD) - 30m ChartA 30-minute candlestick chart showing the price movement of Gold Spot against the U.S. Dollar (XAUUSD). The current price is $3,433.88, reflecting a +$48.32 (+1.43%) increase. The chart highlights a recent upward trend with a shaded resistance zone around $3,460.06 and a support level near $3,400.06, as of 10:52 AM PKT on June 15, 2025.

Geopolitical conflict re-emerges, price points to 3500?Information summary:
The powder keg of the Middle East situation exploded. A new round of fierce fighting between Israel and Iran has pushed the global financial market into a risk-averse storm. In just one day, gold soared. In the early Asian session on Monday, the price of gold was unstoppable, hitting a nearly seven-week high of $3451/ounce. Under the dark clouds of geopolitical conflict, gold bulls are in full swing, and the $3500 mark seems to be within reach.
In addition, the market will face two major tests this week: the monthly rate of US retail sales and the highly anticipated Federal Reserve interest rate decision.
Technical analysis:
At the daily level, the MA10, MA7, and MA5 moving averages are diverging upward, the RSI indicator turns upward, and the gold price is running steadily in the upper and middle track area of the Bollinger band. In the four-hour cycle, the moving average forms a golden cross arrangement and the opening continues to expand. The price continues to rise along the MA10 daily moving average, and the Bollinger band also maintains an upward opening shape.
The current market is dominated by geopolitical risks in the Middle East, and the gold price is consolidating at a high level. If the situation does not change, the gold price will most likely remain above $3,400 today, and it is even very likely to refresh the historical high of $3,500 today and tomorrow. Therefore, before the trend changes, the long strategy is still the best choice.
Operation strategy;
Buy near 3420, stop loss 3410, target 3460-3470.

Risk aversion escalates, prices continue to rise?Information summary:
On the last trading day of last week, gold rose again under the stimulation of risk aversion. The gold market is shrouded in risk aversion in the Middle East. In the short term, the trend of gold is still supported by risk aversion and may continue to rise. At present, the relationship between Israel and Iran has not been eased; there is the latest news: Iran may retaliate against the air strikes it suffered this time. This will provide momentum for the rise of gold.
Market analysis:
Gold 1 hour shows that the moving average forms a golden cross and diverges upward, and the bullish trend of gold is still there. After the rise of gold risk aversion, gold has adjusted sideways in the short term, but it is still oscillating strongly at a high level; it is still in the process of rising. The short-term fluctuation of gold is the adjustment in the process of rising, and it will continue to rise at any time. After the gold bulls broke through 3400, they have been stabilizing above this position, so the strategy for next week is still to buy on dips.
However, it should be noted that if the international situation suddenly changes, the price may not fall back, but directly rush to a new high.
In addition, if the international situation eases and falls below 3400, we must adjust the operation strategy in time to avoid losses.
Important positions:
Resistance levels: 3450, 3475, 3490
Support levels: 3410, 3400, 3380
Operation strategy:
Buy near 3410, stop loss at 3400, win range above 3450 points.
There are still 7 hours left before the Asian market opens. I hope my analysis can help all traders gain something in the gold market.
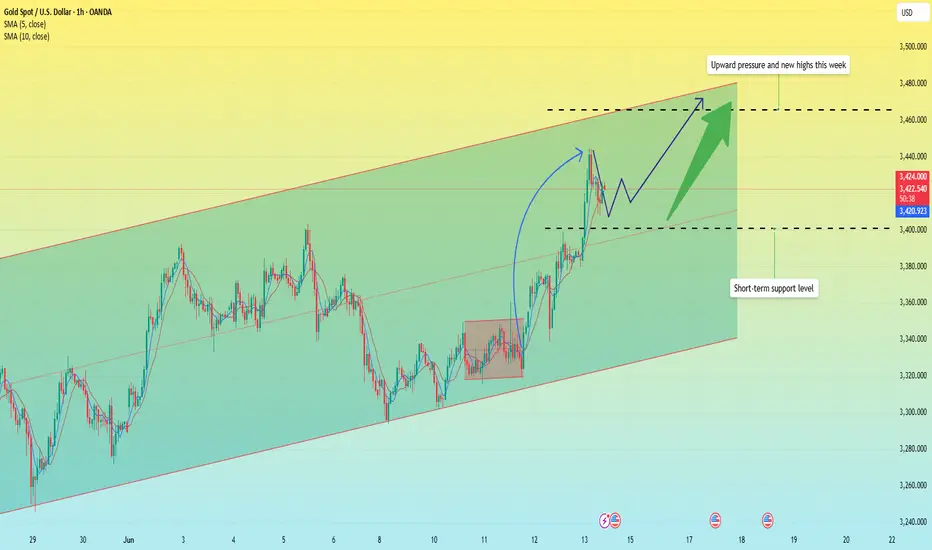
Adjustment over? Uptrend coming?Information summary:
A new round of air strikes by Israel against Iran on Friday has significantly escalated the conflict in the Middle East. Investors have quickly poured into traditional safe-haven assets such as gold, U.S. Treasuries and the Japanese yen. The market's current first choice for hedging geopolitical risks is gold, not the U.S. dollar. The U.S. dollar index rebounded slightly this week, but it has not become the main target of safe-haven fund flows, and gold has dominated the flow of safe-haven funds.
Although risk aversion has become the main theme of the gold market this week, the Fed's policy trends are still the core variable affecting the long-term direction of gold prices. In this week's FOMC meeting, the Fed kept interest rates unchanged and hinted that it may only cut interest rates once this year. But Powell also pointed out that future policies will still depend on data, leaving speculation about reversals.
Market traders generally believe that if the future inflation data falls more than expected or the job market slows down, the Fed's stance may turn dovish again, and gold prices may therefore gain new upward momentum.
Trend analysis for next week:
The weekly bullish trend extends, and there is still a lot of room for growth. After a round of decline last week, the weekly line closed this week again in a very strong position, and the daily rising trend channel resumed its operation. From the market alone, the gold price trend has been stabilizing above the middle track, and the bulls continued to line up at the opening of Monday. From the indicators, the middle track has been extending upward. Since May, the price has continued to create highs in the rising channel and has a tendency to challenge the historical high position of 3500, indicating that there is still room for upward movement in the short term.
From the 1-hour chart, the price rose to 3447 and then made a short-term correction to 3420, and the correction has been sufficient. 3420-3415 forms the most important support area. If this position is touched, it is an opportunity for long trading; but the price may not fall back to the support line and rise directly. Before breaking the important neckline, no short strategy will be adopted at the beginning of next week. We can patiently wait for the opportunity to go long after the correction.
Operation strategy:
Buy at 3415-3420, stop loss at 3410, profit range at 3450-3455.

The situation escalates, and gold rises again.Information summary:
Israel issued a statement: The attack on Iran has been completed. All Israeli Air Force pilots and crew members who participated in the attack on Iran returned to the base unscathed.
Iran issued a statement: The attack could not have happened without the coordination and permission of the United States. The United States is responsible for the consequences of the Israeli air strikes.
The unpredictable international situation has caused the price of gold to continue to rise after retreating.
New forecast:
After a strong rebound in the 3338 shock area and forming a high point, it is currently in a clear upward channel. The recent breakthrough of the 3398.4 area indicates that the trend will continue and point to the resistance line near 3465. At present, the price is testing the trend line that broke above, which may become a springboard for the next round of rise.
Buy trigger point: rebound from near 3405, with strong trading volume.
Risk attention:
The possibility of triggering a false breakout trap near 3440.
If gold loses the 3380-point trend line, its momentum may stagnate.
Broader macro data could overtake technical support near resistance levels.
Israel attacks Iran, gold soars
⭐️Gold information:
Israel attacks Iran's capital Tehran! Gold and crude oil soar rapidly!
The Middle East bully attacks Iran, and the risk aversion sentiment affects the early trading of gold at 3380. 30 US dollars
⭐️Personal comments:
Due to the escalation of geopolitical tensions in the Middle East, market risk sentiment has slightly rebounded, and investors are more inclined to buy traditional safe-haven assets-gold
Moving towards 3480
⭐️Set gold price:
🔥Sell gold area: 3478-3480 SL 3485
TP1: $3462
TP2: $3450
TP3: $3435
🔥Buy gold area: $3375-$3377 SL $3370
TP1: $3389
TP2: $3400
TP3: $3412

Accurately capture golden trading opportunitiesBased on the current trend, it is recommended to focus on low-long operations, but be wary of the market repeating the pattern of the previous few days of high-rush, wash-out and fall. From the perspective of key points, 3360 has been converted from a previous resistance level to a support level. At the same time, the hourly line forms an important support near 3358. If there is a stabilization signal at this position, it can be regarded as a good opportunity to go long. However, if the market falls below the 3356 line, it is not ruled out that the price will further fall to around 3345. This position is the key long-short watershed during the day. Once it is lost, the short-selling force may increase; in extreme cases, if there is a deep wash-out, the gold price may even pull back to 3325. For the upper resistance, pay attention to 3395-3405 first. If it can break strongly, it can further look to 3414.
Based on the above analysis, the trading strategy is as follows:
If gold falls back to the area near 3345-3355 and does not break, you can consider arranging long orders;
When the price rises to the area near 3395-3405 and does not break, you can try to arrange short orders.
When operating, be sure to strictly set stop losses and control risks.
Today's market trend is completely in line with the predicted rhythm, with a clear shock structure and flexible response around key points. With precise layout based on two-way thinking, we can achieve a double kill of long and short positions and a steady harvest. If your current gold operation is not ideal, and we hope to help you avoid detours in your investment, please feel free to communicate with us!

XAUUSD:Go long
After completing long orders around 3358-3380, the current thinking is still long. The pressure transition has been completed near 3376, which can be regarded as support for now. Go long according to this level.
Trading Strategy:
BUY@3375-79
TP:3390-3400
↓↓↓ More detailed strategies and trading will be notified here ↗↗↗
↓↓↓ Keep updated, come to "get" ↗↗↗

Gold rose as expected, how to operate after the bulls hit 3400
📌 Gold News
Spot gold prices rose sharply. Analysts pointed out that the US CPI was lower than expected across the board, which hit the US dollar and US bond yields. In addition, tensions in the Middle East escalated, which triggered safe-haven buying of gold
📊Comment Analysis
Middle East issues, and information about high tariffs on countries without trade agreements. Gold prices have rebounded, but there is no long-term stability.
💰Strategy Package
🔥Sell Gold Zone: 3428-3430 SL 3435
TP1: $3410
TP2: $3395
TP3: $3387
🔥Buy Gold Zone: $3345-$3343 SL $3338
TP1: $3365
TP2: $3377
TP3: $3390
⭐️ Note: Labaron hopes that traders can properly manage their funds
- Choose the number of lots that matches your funds

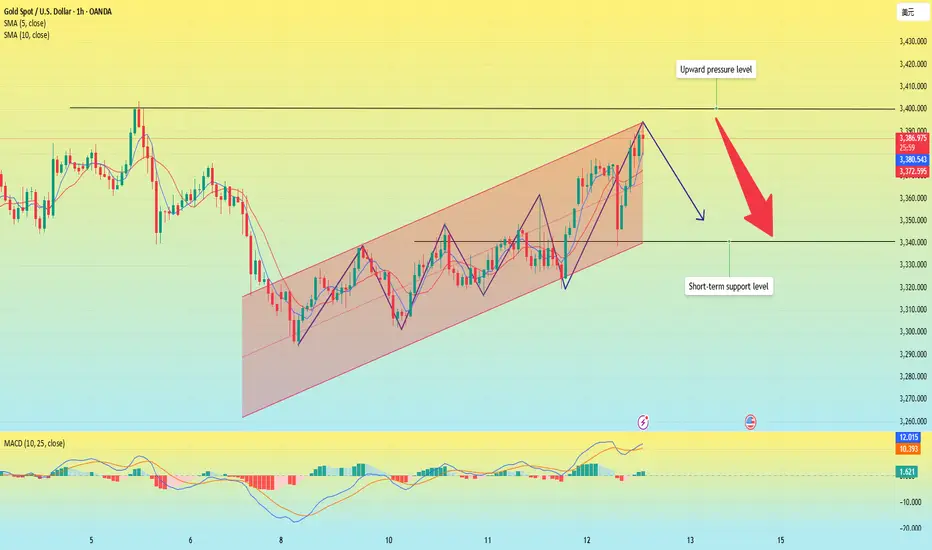
Gold is rising, beware of a pullback.Since last Friday, the daily line has shown an alternating trend of yin and yang. In the three trading days this week, the lows and highs have been rising continuously, which shows that the short-term trend is strong. Today's intraday trend also illustrates this point. At present, gold has risen directly to the 3388 line, directly refreshing the intraday high again.
From the hourly chart, we must be careful of the possibility of gold diving. From the previous rules, each rise is about 45 US dollars. This time it also started from 3340-3345, and the increase was close to 45 US dollars. Moreover, each time the rise is completed, the dive callback is 35 US dollars. Therefore, once it starts to fall from 3385-3390, it is very likely to reach 3350-3355.
In terms of short-term resistance, pay attention to the 3400 pressure level above; the support level is around 3340. the support level pays attention to the vicinity of 3340.
Operation strategy:
Short at 3385, stop loss at 3395, and profit range is 3360-3350.
Go with the flow and seize the gold trading opportunityGold rose and fell yesterday due to the influence of CPI data, and fluctuated violently during the session. There were obvious signs of a wash. In the evening, it rose again driven by the news, closed positive on the daily line, continued its strong upward trend at the opening and set a new high, showing an obvious bullish pattern. The overall structure maintains the bullish idea of low-long and trend-following.
From the 4H cycle, gold rose continuously after stepping back and stabilizing the middle track. The moving average system showed a bullish arrangement, and the Bollinger band opened and expanded, further confirming the continuation of the strong pattern. However, the current price is still running within the triangle convergence range, and has not yet effectively broken. It is not advisable to blindly chase more in the short term.
In terms of operation, it is recommended to take the step back and do more. Pay attention to the short-term support below the 3360-3358 range, and focus on the 3350-3340 range. You can rely on the support to arrange long orders in batches. Pay attention to the 3389 and 3400 areas on the upper short-term pressure. If the high is weak, you can try short-selling in combination with the actual trend.
Operation suggestion: It is recommended to buy gold near 3340-3350, and the target is 3366 and 3382. If it is strong, it is recommended to buy gold at the support of 3358-3360!
All recent trading strategies and ideas have been realized, and the point predictions are accurate. If your current gold operation is not ideal, we hope to help you avoid detours in your investment. Welcome to communicate with us!

XAUUSD Breakout Brewing -- Squeeze Setup in Play📆 June 12, 2025 | ⏱ 4H Chart Analysis
Gold (XAUUSD) is pressing against a key trendline resistance while holding a clean, ascending trendline from early March — forming a classic triangle squeeze.
🔍 Technical Breakdown:
The long-term bullish trendline has been respected three times, with each touch followed by strong buying interest (see orange circles).
Current price action is compressing between this trendline and descending resistance, tightening toward a potential breakout zone.
Two likely outcomes on the table:
🔺 Bullish Scenario: A confirmed breakout above $3,385 could fuel a rally toward $3,500–$3,520, especially if momentum accelerates.
🔻 Bearish Scenario: Breakdown below $3,260 risks deeper correction toward the $3,000 psychological level, aligning with prior demand zones.
📊 Indicators Insight:
EMA(15) & EMA(60) have flattened → signaling potential volatility expansion ahead.
Volume is building slightly, adding weight to a coming move.
=================================================================
⚖️ Trade Idea (Not Financial Advice)
🟢 Buy on breakout above 3,385, Target: 3,500+
🔴 Sell on breakdown below 3,260, Target: 3,000
📌 Wait for confirmation and avoid chasing within the squeeze range.
💬 What's your take — will gold break through or bounce back?
📌 Follow for consistent multi-timeframe setups across Gold, Silver, and FX majors — 2–3 times weekly.
#XAUUSD #Gold #TechnicalAnalysis #BreakoutSetup #Forex #EMA #SqueezePlay #TrianglePattern #tradingview #MJTrading

Gold surged, what will be the trend today?Information summary:
On Wednesday, the US dollar index plunged during the session as the CPI data that was lower than expected boosted the market's expectations of interest rate cuts. As of now, the lowest point is near 98.2.
After the release of the CPI data, gold rose in the short term and touched the 3360 US dollar mark, and then quickly gave up the gains and retreated to around 3320. However, it rose again due to the sharp escalation of the situation in the Middle East. As of now, the highest is around 3380.
Market analysis:
From the current 4-hour chart:
Yesterday's 3360 pressure level has been broken, and the Asian market has successfully stood above this position in the early trading. Then the suppression position of 3360 has turned into a support level. Therefore, the position we should pay close attention to next should be 3360-3350. If the price falls back to around 3350, it is possible to enter the market and do more. If the price rises again, it is very likely to break through 3400. Once it breaks through 3400, it will most likely reach around 3420.
Secondly, from the hourly chart, there are some signs of head and shoulders bottom. It would be perfect if it can fall back and then go up again. But gold cannot fall below 3345 again. If it falls below 3345 again, it cannot be long.
Operation strategy:
Go long when the price falls back to around 3350, stop loss at 3340, profit range 3375-3400.

Gold rebound is still a short-selling opportunityFirst of all, let's take a look at why the market is still not reversing after a big rise, and there is a rapid rise and fall?
The data is bullish, and gold is rising rapidly, but we should pay attention to the sustainability of the rise, and secondly, the current trend direction. The overall trend of gold is still fluctuating downward recently, so even if the data is bullish, it is likely to just give an opportunity to "go high and short".
Although gold performed strongly after the data was released, it began to fall under pressure at the 3360 line, the trading concentration area of the last box shock, indicating that the bulls' volume is still not enough to break through the upper resistance. It is reasonable to rise and fall.
Since gold is currently in a market that is tempting to buy more, it means that the main trend is still bearish. The rebound is still dominated by short selling. The gold 1-hour cycle closed with a long upper shadow, indicating that the upward attack is weak, indicating that the area above 3350 is still a strong pressure area. This upward rush is just a short-term effort with the help of data benefits, which is a typical false breakthrough. Therefore, gold rebounded to the 3350-3360 area in the US market, and it is still dominated by high shorts.
This is the charm of the market - some people are always hesitant in the ups and downs, while others can always grasp the key turning points. The premise is to be able to see the trend clearly and follow the trend.
Don't be led by the market, but understand: Is the current fluctuation a trap or an opportunity?
If the direction is wrong, the effort will be in vain; if the direction is right, you will get twice the result with half the effort.
Don't make excuses for failure, just find ways to succeed. Have you found it?
All recent trading strategies and ideas have been realized, and the point predictions are accurate. If your current gold operation is not ideal, we hope to help you avoid detours in your investment. Welcome to communicate with us!

How is the market situation during the China-US talks?Information summary:
On Tuesday, as the China-US trade negotiations entered the second day, the US dollar index fluctuated around the 99 mark.
The gold price once approached the 3,300 US dollar mark in the Asian market, and then continued to rise, reaching the highest of the 3,350 US dollar mark. After the opening of the US stock market, all the gains during the day were given up, and it has been maintained below 3,350 for consolidation.
From the current known negotiation information, the two sides basically agree on the general direction and principles, but it means that more specific content and details have not yet been fully negotiated, and more dialogue is needed to resolve.
Market analysis:
From the current gold market, as long as the 3,350 mark cannot be strongly broken through next, the price will fall again. The consolidation range will remain at 3,300-3,350. As long as the price fails to break through strongly, there will still be a fifth wave of downward trend.
Therefore, gold is still maintaining short selling operations at high points.
Operation strategy:
Short at 3345-3450, stop loss at 3360, the first target is this week's low of 3300, the second target is 3285, and the third target is 3250.

Analysis of gold prices on June 11
📌Gold news
🎈Economic data and policy expectations
U.S. employment data; initial jobless claims increased for two consecutive weeks, and the market focus shifted to the non-farm payroll report released this week. The data performance will affect the Fed's policy path.
Trump pressures interest rate cuts: Trump recently called on the Fed to cut interest rates by "one percentage point" again, and hinted that he would consider replacing the Fed chairman, exacerbating market expectations for loose monetary policy.
🎈Long-term support factors
Despite short-term fluctuations, global economic and geopolitical uncertainties (such as repeated trade frictions and debt risks) still provide long-term safe-haven demand for gold, especially in the context of the divergence of monetary policies between European and American central banks, the allocation value of gold is highlighted.
📊Technical analysis
Before the European session, the gold price showed a continuous positive trend. I gave a hint in my analysis that I was not in a hurry to guess the top, and followed the trend to rise to around 3340 and wait for the turning point to appear. The opening trend of the European session tended to fluctuate until it rose to around 3348 in the evening and then turned from rising to falling, but the decline was not strong. It rose again at the position of the European session. Now the gold price is trading around 3350. From the market point of view, this wave of rise was supported by the trend line at 3300. Whether it was geopolitical conflicts or various news about Sino-US trade negotiations that stimulated buying to drive gold prices up, the second rise in the US session has exceeded 3340.
The next key suppression level is around 3360, which is 618 from 3403 to 3300, which can be treated as a turning point. The initial support below focuses on the high point of yesterday's Asian session at 3338.
💰Strategy Package
Waiting for gold: short at 3355-3360, stop loss at 3365, target at 3340-3328!
⭐️ Note: Labaron hopes that traders can properly manage their funds
- Choose the number of lots that matches your funds

Gold V-shaped reversal still has room to rise In the morning, the market was under pressure at 3328, and two consecutive big negative lines fell to the low of 3302, breaking through the lower track of the descending flag consolidation channel, forming an effective break. 3317 was originally the confirmation point of the channel counter-pressure, and it was also the 618 split resistance at the time. Then the middle track was lost, and the trend was bearish, so it tried to rebound but continued to fall under pressure.
But the market immediately made a V-shaped reversal, breaking through the morning high of 3328, and had attacked to 3342 before the US market. The European session was volatile and strong, and with the help of a pullback before and after the U.S. session to lure short sellers, there is still hope for a second rise
The focus of the support for the retracement is on two positions: one is the 3322 line, corresponding to the middle track and 50% split support; the other is 3318, corresponding to the 618 split support. If it stabilizes after touching it, it will most likely point to the 3348 counter-pressure position.
If the pressure of 3348 cannot be broken, there is still a possibility of repeated fluctuations in the short term. It is necessary to pay attention to whether the secondary low point appears when it pulls back to further consolidate the support structure. If the market directly breaks through and stands above 3348, 3293 may have been confirmed as a short-term low.
The recent trading strategy ideas are all realized, and all the points are predicted accurately. If your current gold operation is not ideal, I hope I can help you avoid detours in your investment. Welcome to communicate with us!

Gold fluctuates repeatedly and opportunities emerge.Gold bottomed out in the Asian session and rebounded to break through the opening of the decline. The European session continued to break through yesterday's high. The US session continued to break through the key pressure position of 3335-3345, and walked out of the standard strong cycle. After the break, it is necessary to change the thinking and follow the trend to be bullish. Pay attention to the support below 3315-3325. In terms of operation, it is mainly long when it falls back. The upper side gradually looks to 3352 and 3365. If the pressure is not broken, look at the falling space!
Operation suggestion: Go long when gold falls back to 3325-3315, and look at 3338 and 3352! If the pressure above 3352 and 3365 is not broken, you can short!
The recent trading strategy ideas are all realized, and all the points are predicted accurately. If your current gold operation is not ideal, I hope I can help you avoid detours in your investment. Welcome to communicate with us!

The short-term tug-of-war for gold is starting
Gold prices continued their decline last Friday and stabilized and rebounded. Yesterday, gold prices fell back to the 3,300 mark, then slowly rose to the 3,338 mark, and fell back after encountering resistance, which is in line with the technical consolidation rhythm.
- China-US trade negotiations: The US has released signals that it is willing to relax export restrictions, and the market is waiting for the results of the negotiations, which may affect risk sentiment.
- US May CPI data: Inflation changes will provide key guidance for the Fed's policies.
- The current trend is weak, but the downside is limited. Buy on dips and avoid large-scale shorting.
- Today, it is recommended to wait and see, and wait for the negotiation results to become clear before entering the market to reduce volatility risks.
🔥Sell gold area: 3330-3348 SL 3352
TP1: $3320
TP2: $3310
🔥Buy gold area: $3295-$3305 SL $3290
TP1: $3320
TP2: $3330

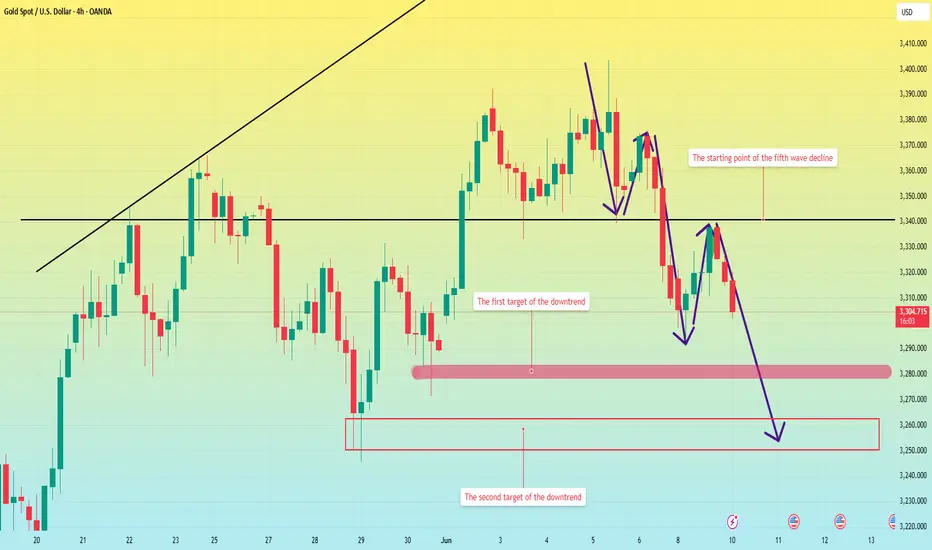
Gold is falling. Where is the low point?Market summary:
Yesterday, thanks to the weakness of the US dollar, the US dollar once fell below the 99.0 mark. Spot gold rebounded from the low of 3293 hit earlier in the session, recovering all the losses during the day, and the highest point was near 3338.
It fell from the high point in the early Asian session on Tuesday, and has been consolidating in the 3300-3310 range so far. In my early analysis, I pointed out that there is a high probability that the fifth wave of the wave trend will fall at the beginning of this week, and as I predicted, it is completing the fifth wave of the downward trend.
Trend analysis:
From the four-hour chart, the fourth wave of rebound has been completed, so today is the fifth wave of the downward trend. Next, we look at the two target ranges.
The first target is around 3280, and the second is 3260-3350. And today, it is highly unlikely to stabilize above 3310, so don't choose to short at the rebound high point, the chance is very slim.
Operation strategy:
Short around 3310, stop loss at 3320, profit range 3380-3350.