Special attention needs to be paid to gold operations on FridayThe current price fluctuates around the 3300-3348 range, with resistance at 3348-3352 and support at 3295-3303. If it breaks through 3348, be wary of a second surge to around 3365; conversely, if it loses 3295, it may fall back to the 3275-55 area.
Gold recommendation: short sell near 3335-3345 when it rebounds. Target position 3320-3310.
Analyse

Gold prices face substantial short-term suppression
📌 Bearish drivers
Gold prices (XAU/USD) rebounded from a multi-day low in early Asian trading, and are now at the psychological level of $3,300. Ongoing geopolitical uncertainties, including the Russia-Ukraine conflict, heightened tensions in the Middle East, and renewed frictions on the India-Pakistan border continue to support gold prices. Even so, improved risk sentiment appears to have limited gold's upside due to renewed optimism around the US-UK trade agreement and the launch of US-China tariff negotiations over the weekend.
📊Commentary and analysis
As tariff trade negotiations become more active, gold prices are facing huge selling pressure. Gold prices may return to the 3233 price range and continue to rise.
💰Strategy Package
🔥Sell Gold Zone: 3351-3353 SL 3358
TP1: $3340
TP2: $3330
TP3: $3320
🔥Buy Gold Zone: $3232 - $3234 SL $3227
TP1: $3245
TP2: $3260
TP3: $3270
⭐️ Note: Labaron hopes that traders can properly manage their funds
- Choose the number of lots that matches your funds
- Profit is 4-7% of the fund account
- Stop loss is 1-3% of the fund account

Gold still needs to be shorted after a sharp drop!
💢 Driving factors
Market sentiment was dampened by reports that US President Trump signed a potential trade agreement with the UK, while investors are awaiting the outcome of the US-China trade talks this weekend. In terms of trade agreements, any cooling of the trade war and reduction of uncertainty are bearish for gold. If the US and the UK announce a trade agreement, it will be good for the overall global economy.
📊 Commentary and analysis
In terms of trend, although gold soared in the morning, it continued to fall to 3320 in the afternoon. At present, gold has rebounded moderately but is still under pressure after the sharp drop.
💰 Strategy package
For the US market, it is still a rebound short. Pay attention to the resistance of 3370-74 above. You can directly enter the short position after the rebound, and bet on the second decline of the US market!
⭐️ Note: Labaron hopes that traders can properly manage their funds
- Choose a lot size that matches your funds
- Profit is 4-7% of the capital account
- Stop loss is 1-3% of the capital account

Thinking and practical skills for winning in the 3360-3400 rangeAffected by the news, gold fell sharply at the opening. Successfully won. According to the trading strategy, we gave gold a wide range of fluctuations in the 3360-3400 range, which will not change much. It can be operated within the range during the day. The trading strategy analysis is accurate, and the key points are accurately grasped to enter the market, which brought us good returns during the day. The short-term rhythm is accurately grasped! Brothers who followed the trading plan should have also made very good profits. 🍻🍻🍻

The downside risk of gold increases!📌Fundamentals:
1. The conflict between India and Pakistan shows signs of escalation
2. US-Houthi ceasefire agreement
3. The Fed’s interest rate decision dominates this week’s market
4. International trade situation disturbs market sentiment
5. Market sentiment and capital flow
📊Technical aspects:
At present, on the hourly basis, gold is still under pressure at the small range resistance of 3400, and the current tariff crisis has cooled down. The data of the Fed's interest rate decision will cause a series of fluctuations in gold in the short term. At the same time, the market is betting that there will be further trend corrections, which may cause capital outflows in the market, which will further hit gold bulls!
There is actually a new round of operation opportunities in the short term. The short-term resistance should be around 3400, but since the game between major powers has not stopped, there will be no big negative factors. However, if the data layout does not fluctuate much, the market may not have a big dive. At present, we will temporarily play at the 3360-3400 level. If it breaks, we will make new adjustments!
🎯Practical strategy:
Gold: Short around 3390-3400 on the rebound, and the target is 3370-3360!

3420, gold prices can reach today
📌 Gold driving factors
Driven by the weakening of the US dollar and safe-haven demand, spot gold closed up $93.77 on Monday, up 2.9%, at $3333.32 per ounce.
On Monday local time, US President Trump signed an order on biomedical research, hoping to take the opportunity to promote the US pharmaceutical manufacturing industry. Trump also announced that tariffs on pharmaceutical products will be announced in the next two weeks.
Kitco Metals senior metals analyst Jim Wyckoff said: "We see continued inflows of safe-haven demand, keeping gold prices high. Gold prices will remain above $3,000 per ounce, at least in the short term."
Gold is often seen as a safe-haven tool in uncertainty and performs well in a low-interest rate environment. Gold prices have soared 26.3% this year and have set new historical highs many times.
📊Comment Analysis
Bulls regained their dominance, and the upward trend approached above 3400 before the market expected a rate cut
💰Strategy Set
🔥Sell Gold Area: 3418-3420 SL 3425
TP1: $3410
TP2: $3400
TP3: $3385
🔥Buy Gold Area: $3323 - $3321 SL $3316
TP1: $3330
TP2: $3340
TP3: $3358
⭐️ Note: Labaron hopes that traders can properly manage their funds
- Choose the number of lots that matches your funds
- Profit is 4-7% of the fund account
- Stop loss is 1-3% of the fund account

Gold is expected to fall in the short term
Gold rebounded to around 3380, and the K-line decline was inevitable, so there is no doubt that the gold price will fall. The current K-line closed with an upper shadow, which is a sign that the bulls have reached their peak.
Trading ideas: short gold near 3380, stop loss 3390, target 3350

Gold could reach 3420 today
📌 Gold Drivers
Gold prices (XAU/USD) retreated slightly from intraday highs near two-week highs hit during the Asian session on Tuesday, but still held steady near $3,360, extending gains for a second day in a row. Improved U.S. economic data helped ease market concerns about a recession, providing mild support for the dollar. At the same time, signs that Sino-U.S. trade tensions may ease curbed gold's safe-haven demand, prompting some investors to take a wait-and-see approach ahead of the much-anticipated two-day Federal Open Market Committee (FOMC) policy meeting.
The Trump administration's imposition of tariffs of up to 25% or even 100% on semiconductors will further disrupt the global semiconductor supply chain, forcing many semiconductor manufacturers to look for alternative sources of supply or manufacture in the United States.
📊Comment Analysis
Bulls regained their dominance, and the upward trend approached 3400 before the market expected a rate cut
💰Strategy Set
🔥Sell Gold Area: 3418-3420 SL 3425
TP1: $3410
TP2: $3400
TP3: $3385
🔥Buy Gold Area: $3323 - $3321 SL $3316
TP1: $3330
TP2: $3340
TP3: $3358
⭐️ Note: Labaron hopes that traders can properly manage their funds
- Choose the number of lots that matches your funds
- Profit is 4-7% of the fund account
- Stop loss is 1-3% of the fund account
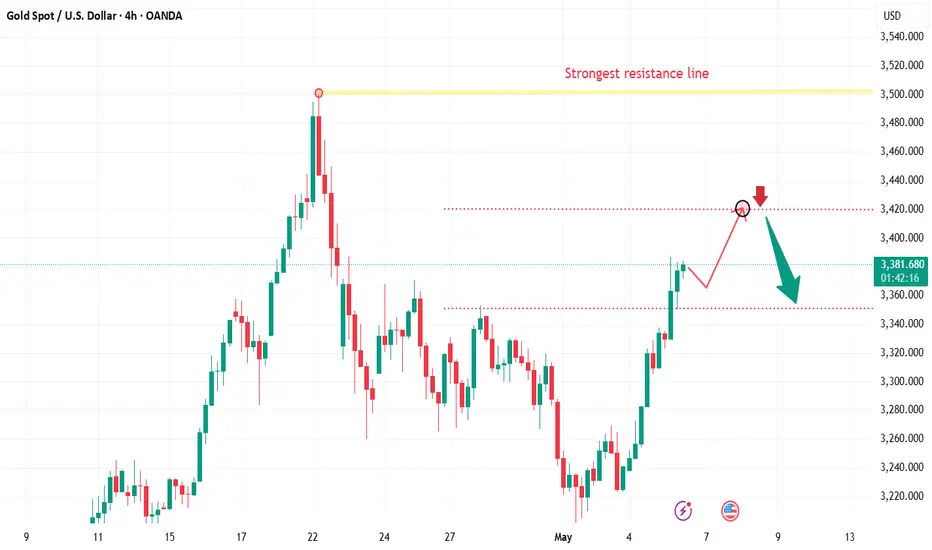
XAUUSD swing Analysis XAUUSD took support from support line,
All long targets are achieved.
this month taking rejection from major resistence,
Let's track the moves to down.
follow for more swing analysis on INDICES - CURRENCY - COMMODITIES

As expected, gold prices continue to fall
📌 Gold driving factors
There are two aspects to look at the impact of April non-agricultural data on the gold market.
One is the data itself and the existing economic environment, and the other is combined with the technical aspect.
The market itself is troubled by the tariff issue. Whether it is the US stock market or the US dollar, they all need good economic data to boost. Once the April non-agricultural performance is poor, the market sell-off will be out of control, and it also means that the risk of US economic recession will increase.
Secondly, good data performance reduces the Fed's expectations for rate cuts. As we all know, the Fed's expectations for rate cuts or implementation of rate cuts are theoretically good for gold prices, and vice versa.
The cooling of the tariff issue may come soon, which is also not conducive to the rise in gold prices, but cooling does not mean the end, and the final achievement will definitely take some time.
📊Comment Analysis
Recently, we have been very good at controlling the gold market. Keeping an eye on the changes in fundamental news is the focus of research and judgment. Of course, the technical direction is also of reference value. The next market will revolve around fundamental news, especially in the context of tariffs.
The non-agricultural data exceeded expectations, and the tariff issue may see "dawn". If it can be confirmed in the near future, the risk aversion sentiment will subside in the short term, which is not conducive to the rise of gold prices. There is a high probability that there is room for retracement, so there is no rush to chase now.
💰Strategy Package
Operation ideas for next week:
Gold 3265 short, stop loss 3275, target 3230-3220;.
⭐️ Note: Labaron hopes that traders can properly manage their funds
- Choose the number of lots that matches your funds
- Profit is 4-7% of the capital account
- Stop loss is 1-3% of the capital account

Non-farm data is released, and gold is still going to fall.
📌 Gold information
Today, the market will usher in the heavy non-farm data for April. From the expected value, there are only 130,000 people, far lower than the expected 228,000 people, and the unemployment rate remains at 4.2%.
If we refer to the unsatisfactory ADP data in April, then the number of non-farm people in April should have declined, or it is lower than expected, but the ADP data cannot fully correspond to the final non-farm data. This is the answer given to us by too many experiences in the past, so it cannot be concluded that the non-farm data this time will be lower than expected.
📊Comment analysis
Combined with the technical aspect, the strong technical pressure above the international gold price is around 3280, and then the 3300 mark. Even if it rebounds next, the pressure of the above two prices cannot be broken, and there is still a probability of a pullback adjustment. The initial support below is 3230, and after breaking through the position, it will follow the trend to explore 3205.
💰Strategy Package
If today's non-agricultural data cannot provide strong support for gold prices, the rise in gold prices in the short term will be difficult to sustain. The specific decision can only be made after the final release of the afternoon data and the guidance on prices. The trend fluctuations tonight will be very intense. Remember to strictly control your positions to prevent risks.
⭐️ Note: Labaron hopes that traders can properly manage their funds
- Choose the number of lots that matches your funds
- Profit is 4-7% of the fund account
- Stop loss is 1-3% of the fund account

Gold is still in a weak phaseIn terms of news: international tensions have eased recently, the United States may reduce tariffs on Chinese goods, Russia-Ukraine peace talks have made progress, market demand for hedging has weakened, and funds have shifted from gold to risk assets. At the same time, the mining agreement between the United States and Ukraine boosted the U.S. dollar in a short period of time. The U.S. dollar index strengthened and broke through the 100 mark. The appreciation of the U.S. dollar caused the relative depreciation of gold and suppressed the price.
Technical aspects: From the current market, gold is in a downward trend in the short term. In the short term, we should first pay attention to the suppression of 3260 US dollars on the top. Pay attention to the gains and losses of 3200 yesterday on the bottom. If it falls below 3200, it may further go to 3167.
Trading ideas: Short gold near 3260, stop loss 3270, target 3240

Gold plummeted as expected. Operation strategy?In my last analysis, Quaid predicted that gold was at risk of falling and breaking.
Quaid promptly told everyone that they could short trade at 3310-3320.
At present, the market situation is basically consistent with Quaid's expectations. As of now, gold has fallen to a low point near 3215. And it has been maintained for some time.
Quaid speculates that gold will continue to maintain a bearish trend and continue to retreat.
Quaid data analysis:
From the hourly chart, gold is currently following a wave trend, and the highest point of 3352 is the starting point of wave A. The high point of wave b is at 3320. If the current 3220 is the beginning of the low point of wave C, then be careful of its continued decline.
Trading strategy:
In terms of the next operation, Quaid suggests waiting for short trading near 3225.
If gold falls below 3210 again, then the bottom can directly look towards the 3190-3200 range.
Quaid warned everyone not to think that the trading range is very large; because the trading markets in some Asian countries are closed, any terrible thing could happen. It is recommended that everyone take profits in time.

The gold correction continues!On the news:
Gold prices fell for a third day in a row as signs that trade talks between the United States and China may be progressing dampened demand for safe-haven assets. News that the Trump administration is about to announce the first batch of agreements, which will reduce planned tariffs on some countries, also eased concerns about the outlook for global trade.
Technical aspects:
After the current gold market broke down, it started to fall from around 3270, which is also the key position for us to continue to bet on the market falling. At present, the short position of gold is more advantageous. Then in the short term, gold will focus on the support near 3233. If it falls below, then gold will reach the 3200 mark.

Gold suddenly rose. Be wary of gold’s retracement?The ADP report released in the morning said that the pace of hiring slowed sharply in April as companies prepared to deal with the possible impact of US President Trump's tariffs on US trading partners.
This month, the number of new jobs in the US private sector was only 62,000, the smallest increase since July 2024, significantly lower than the expectation of 115,000, and slower than the 147,000 increase after the downward revision in March.
After the data was released, spot gold rose in the short term and once touched around $3,320.
Gold fell to a low of 3,266 in the morning. With the release of ADP data, it was another short-term rise of $50-60.
Many traders may not know where to start with the current gold market and think it is still in the process of rectification.
Of course, it is definitely not wrong to look at it this way, after all, gold is still in the process of rectification.
However, traders should be alert that some Asian countries have entered a trading suspension state starting today, and it will last for about 5 days. The price of gold may fall during this period.
Quaid's analysis:
Gold rose to around 3320 in the morning, but failed to break through the upward resistance level of 3325. And 3320 is the 618 position of the trend Fibonacci from 3352 to the low point of 3266. If 3320 is the current high point of wave B, then 3352 is point A. Then point C is likely to appear around 3230.
Therefore, Quide believes that gold is likely to break down.
Operation suggestions:
Short at 3305-2210, stop loss at 3317, and take profit at 3250-3230.
Thank you for reading. If traders can leave your different suggestions, Quide will be very grateful to you.

Gold continues to fluctuate widely, mainly long at low levelsAs gold broke below the 3300 mark in the European session, the market once again tested the 3270 first-line support, which is the edge of the lower track of the channel.
rading idea: Go long gold near 3270, with a strict stop loss of 3267 and a target of 3300

The gold market fluctuated sideways. Waiting for a new trend?OANDA:XAUUSD During the Asian trading session, gold prices maintained a slight decline; in the early European trading, gold began to fall sharply, but it was still within the trend range expected by Quaid.
Today, the initial value of the US real GDP in the first quarter of 2025 will be released, and it is expected to grow by 0.3% at an annualized quarterly rate, after a strong growth of 2.4% in the fourth quarter of 2024.
If the world's largest economy unexpectedly shrinks, it will re-ignite bets on a sharp interest rate cut by the Federal Reserve. And this data will boost the upward trend of gold.
On the other hand, if the cooling of US economic growth is less than expected, it may bring a short-term relief to the overall market and the US dollar, which will continue to put gold under corrective downward pressure.
However, traders will remain cautious before the release of US ADP employment data this week; this data will limit the reaction of gold prices to GDP data. US non-farm payrolls will help the market assess whether US tariffs have had a substantial impact on the labor market.
Current trend analysis:
The daily line closed negative, and it is still bearish today. At the same time, yesterday's decline encountered 3300 support. In this pattern, regardless of today's strength, short once and see how the European session trends. If the European session falls, short the US session; if the European session rises strongly, the US session may remain volatile. If the European session breaks the downward channel, the US session may continue to fall.
Hi guys, if you want a solid trade, please wait for the US GDP data this morning. Quaid conducts gold trading after professional analysis.

The gold strategy is correct, enter the market at key points.Gold clearly treated the wide range of fluctuations, and the strategy was basically realized! In the real market, I also arranged short orders at 3345 and 35, and took profit at 3313-14! I continued to arrange long orders at 3302, and finally successfully reached the profit target of 3315! The overall harvest was good.
Analysis of gold trend:
On Tuesday (April 29) in the Asian market, spot gold fluctuated in a narrow range and is currently trading at $3337.58/ounce. Gold prices reversed their decline on Monday and rose. Earlier, they fell to around $3268, but then there was a low-absorption buying, and gold prices closed at $3343.91/ounce; the dollar fell across the board on Monday, which also provided support for gold prices. Investors cautiously waited for further news on US trade policies and prepared for a week of intensive economic data, which may initially indicate whether US President Trump's trade war is having an impact.
From a technical perspective, gold prices reversed their decline on Monday and rose. Gold repeatedly tested the 3260-3270 area for support. Gold has formed a multiple bottom structure in the short term, so gold may end its short-term adjustment. This time, gold has already adjusted, and it is unlikely to adjust again. Therefore, as long as it does not break the 3260 low in the near future, gold will rise and there will be room for growth. As for the high point, there are two dividing points, one is the 3337 high point, breaking 3337 is a strong shock, and the other is the 3370 high point, breaking 3370 is absolutely strong, then, the upper space is opened, and then look at 3420-3500.
From the daily chart, the daily line forms three bottoms at 3260, and the daily line closes positively, and the bullish trend is obvious. As long as the daily line is positive, it will not be able to go to the upper track or the previous high is just around the corner. The 4-hour cycle is also absolutely strong after Monday's rise, but now the unilateral rising mode of the Bollinger opening has not yet formed, and the gains and losses of 3370 will be tested here. Therefore, if the bullish long position continues on Tuesday, it must pay attention to whether 3370 breaks. If 3370 breaks, there will be a strong unilateral rising space. If 3370 does not break, it will still be a large range of fluctuations. Then, the only thing to consider during the day is to adjust the long position. Today, the lower support is around 3300-3310, and the upper pressure is around 3350-3360.

Gold still has a chance to reboundCurrently, gold's bulls and bears are still oscillating within a large range. The key pressure above and the upper edge of the range are maintained near 3365-70, while the lower edge of the large range and the support are maintained near 3260. It is very likely that there will be multiple shocks and choices within this range again.
Gold retreats to around 3302-00 during the day, go long, target around 3330-50, stop loss 3295.

Gold's counterattack? Today's market analysisGold has repeatedly tested the 3260-3270 area to gain support. Gold has formed multiple bottom structures in the short term, so the short-term adjustment of gold may end.
Gold has formed multiple bottom structures in the 1-hour, and the 1-hour moving average has also begun to gradually turn. If it can turn upward and form a golden cross, then the 1-hour bulls of gold will exert their strength again. Stimulated by risk aversion, gold in the U.S. market once again broke through and rose, and finally broke through Monday's high. Then the first-line suppression of gold near 3335 did not form effective resistance. When gold fell back in the Asian market, we first followed the trend and went long. Gold quickly bottomed out at 3320 first-line support in early trading and then rebounded quickly. Then gold should only be operated in the short term or go long on dips.
Operation ideas:
Short-term long: 3310-3315 long, stop loss 3300, target 3350-3370;
Short-term short: 3350-3360 short, stop loss 3365, target, 3315-3310;
Friends, don’t be afraid of missing the market, wait patiently for your own opportunity, the market will never neglect those who are prepared.

Gold is trying to break through the upward channelGold started the new week on a bad note, hitting a low of 3260 in the morning, followed by a small shock adjustment; then it began to rise sharply. As of press time, it has risen to around 3350 and tried to break through the upward resistance.
Although some of gold's safe-haven appeal has weakened, its overall forecast and price trend remain optimistic. Until we see clear lower highs, lower lows, and a solid trade agreement rather than more political bragging from the Trump administration, the possibility of gold setting new highs cannot be underestimated.
Surface calm hides potential risks
Although last week's market movements and today's early trading performance show that the market is calming down, any sense of security is fragile. Under the surface, key risks remain: trade tensions, recession concerns, and uncertainty about monetary policy are real. Ongoing trade negotiations remain a key factor. If the United States sticks to its position on tariffs or the negotiations break down, risk aversion may quickly pick up, boosting demand for gold again.
Quaid's analysis:
Based on last week's market situation, Quaid conducted an analysis of gold's trend this week over the weekend. As I predicted, gold is trying to break through and try a new high.
Gold has risen to around 3350, and 3365 is a key resistance level in the upward trend. If the gold price breaks through this position and can maintain horizontal development, it will continue to rise in a stable situation.
From the upside, the initial resistance level is $3365, followed by $3430. If the bullish momentum is restored, it may soon hit the historical high of $3500 again.
On the contrary, if the price fails to break through the 3365 resistance level, Quaid believes that it is necessary to pay attention to the key support at the 3285 position.

Gold market, further decline is likelyOANDA:XAUUSD Continue to test the support level of 3270 points, looking for a breakthrough. Any easing of the Sino-US conflict may trigger a price drop. But things are not so simple.
The Chinese Ministry of Foreign Affairs issued a statement: China and the United States have not discussed or negotiated on the issue of tariffs.
Gold prices are under pressure before the tariff war and the release of US data.
International situation: Russia issued a statement on a truce; and Ukraine issued a statement: If Russia really wants to achieve peace, it must immediately cease fire. If the two sides formally sign a truce agreement, the safe-haven demand for gold may also be greatly reduced.
In the morning, gold prices tested last week's low of $3260, and the strengthening of the US dollar and the possible easing of Sino-US trade risks put gold prices under pressure.
Traders are waiting for the release of key US GDP and labor market data, which may affect the Fed's interest rate expectations. In this context, if macro statistics are weak and geopolitical risks remain, the correction in gold prices may be replaced by growth.
Another test of the support level may trigger a breakthrough. It is necessary to pay attention to the situation between China and the United States. Any easing of the situation will trigger a decline in gold.
Upward resistance: 3300, 3325
Downward support: 3265, 3245, 3230
The possibility of further decline in gold prices has been exhausted since the opening. Gold prices may strengthen to the above resistance levels. A false breakout of 3300/3325 may trigger a decline, which may bring gold prices closer to the support level of 3270.

Gold is expected to rise in the US market
🌐 Driving factors
Geopolitical situation: US President Trump's special envoy Witkov held a three-hour meeting with Russian President Putin in Moscow last Friday to discuss the US plan to end the war in Ukraine. The Kremlin said that the positions of the two sides have become closer.
Iran and the United States said on Saturday that they have agreed to continue nuclear talks in the coming week, but Iranian Foreign Minister Abbas Araqchi was "extremely cautious" about whether the negotiations aimed at resolving the decades-long deadlock can be successful. US President Trump expressed confidence in reaching a new agreement with Iran to prevent the country from developing nuclear bombs.
Latest news: Russian President Putin announced on the 28th that a ceasefire will be implemented from 0:00 on May 8 to 0:00 on May 11.
Bullish sentiment in the market cools down
📊Comment analysis
After the Asian session gold gapped up and opened, it began to fall back quickly to around 3267. After a small rebound in the European session, it continued to retreat. It is currently maintained near 3290. It may continue to fall in the short term, and the support below is maintained near the previous low of 3265-3260 US dollars. This position will also determine the trend of the long and short positions in the later period. It is very likely to retreat again near this position in the evening and continue to make directional choices in the later period. Once the support is effective, the US session may usher in a rebound again, and the key suppression area above is maintained near the integer level of 3300. This position is also the high point of the rebound in the European session, and it will also be the key suppression position of the US session. The operation idea of the US session is very simple. Continue to maintain a certain fluctuation in this range. Once it breaks through, consider stopping loss and exiting.
🔷Technical side:
For the current gold, the 4-hour chart is fluctuating widely between 3330-3270, and is currently near $3295.
✔Operational suggestions, keep short-term trading:
US gold operation strategy:
If you try to go long at 3265-60 first, the target is around 3280-3290, and the loss is 3255. If you first pull back to 3295-00, go short with a light position, and the target is around 3270-3265, and the loss is 3205. In the short term, the long and short positions may continue to pierce, so you need to operate with caution!
💥Risk warning
Liquidity risk: The market may be bearish in early May, and price fluctuations may be amplified.
Policy black swan: Trump may suddenly change tariff policies or personnel changes at the Federal Reserve, causing violent market fluctuations.
Technical false breakthrough: There are a large number of stop-loss orders near $3350, so be wary of reversals after inducing longs.
Summary: This week, the gold market will be affected by geopolitics, the Fed's policies and the trend of the US dollar, and the fluctuation range is expected to be between $3260 and $3350. Investors need to pay close attention to key support and resistance levels and adjust their strategies flexibly.
