Smells Like a Trend ReversalWeekly Recap – Gold Market
Monday, May 12, 2025
The week began with a sharp GAP during the Asian session (starting around 1:00 AM London / 8:00 PM New York on Sunday) :
Gold dropped abruptly by $60, from $3,325 to $3,266.
The catalyst was a temporary easing of trade tensions between the U.S. and China, following weekend negotiations that led to a 90-day tariff pause.
During the European session (starting at 8:00 AM London / 3:00 AM New York) , the downtrend continued, pushing the price further down to $3,207.
Tuesday–Wednesday, May 13–14
Between these two sessions, the price consolidated within a narrow range of $3,265 to $3,202 (63 $ range).
Despite better-than-expected U.S. inflation data, there was no significant breakout—the market remained indecisive.
Wednesday, May 14 – European Session
The price continued its descent, falling from $3,243 to $3,168—a $75 drop—indicating persistent downward pressure despite macroeconomic stability.
Thursday, May 15
The Asian session (1:00 AM London / 8:00 PM New York) began quietly, with a range between $3,168 and $3,192.
Then a sharp drop to $3,123 followed (down $71), triggered by new statements from President Trump, who announced potential trade deals with India, Japan, and South Korea.
In the European session (8:00 AM London / 3:00 AM New York) , a strong reversal occurred.
After failed peace negotiations between Russia and Ukraine in Istanbul, and due to growing geopolitical uncertainty plus a weakening dollar, gold surged by $132, from $3,120 to $3,252.
Friday, May 16
The Asian session opened slightly bearish, with gold dipping from $3,252 to $3,218.
However, bullish momentum returned during the European and U.S. sessions, continuing Thursday’s upward trend and adding $51 by day’s end.
📰 Geopolitical News Landscape
India / Pakistan
Since the Kashmir terror attack on May 9, 2025, tensions have escalated again.
Cross-border airstrikes and border closures have resumed. A fragile ceasefire, brokered by the U.S., is under pressure.
Disputes over water rights further strain relations.
➡️ Short-term outlook: high tension remains.
Gaza Conflict
On May 9, Israel launched Operation Gideon’s Chariot against Hamas, aiming to dismantle the group and rescue hostages.
Over 300 deaths have been reported. A leaked plan suggests Gaza will be divided into three heavily controlled zones.
The humanitarian situation is catastrophic (over 53,000 deaths since 2023).
Peace talks are underway in Doha, but the situation remains dire.
➡️ No relief in sight.
Russia / Ukraine
Direct talks were held in Istanbul for the first time in three years.
While a prisoner exchange (1,000 each side) took place, no substantial progress was achieved.
Russia demands Ukrainian troop withdrawals from contested areas—Kyiv refuses.
Simultaneously, Russian attacks intensified, including drone strikes on Sumy.
➡️ A ceasefire remains unlikely in the near term.
U.S.–China Trade War
A 90-day tariff pause was announced the weekend before May 12:
U.S. tariffs cut from 145% to 30%
Chinese tariffs reduced from 125% to 10%
Markets reacted positively at first—especially in retail and shipping sectors.
➡️ However, unresolved structural issues (e.g., tech transfers, export controls) keep tensions fragile.
No comprehensive deal is in sight.
⚖️ Trump vs. Powell
Tensions escalate between President Trump and Fed Chair Jerome Powell:
- Trump demands aggressive rate cuts
- Powell warns of inflation risks
- The Fed holds the interest rate steady at 4.25–4.5%
- A 10% staff reduction is planned at the Fed for “efficiency”
➡️ The growing political interference is increasing market instability.
📉 U.S. Inflation – April 2025
The official inflation rate dropped to 2.3%, the lowest since February 2021.
However, consumer inflation expectations soared to 7.3%, the highest since 1981.
The University of Michigan Consumer Sentiment Index fell to 50.8—a historic low.
➡️ A clear gap between perception and data is emerging.
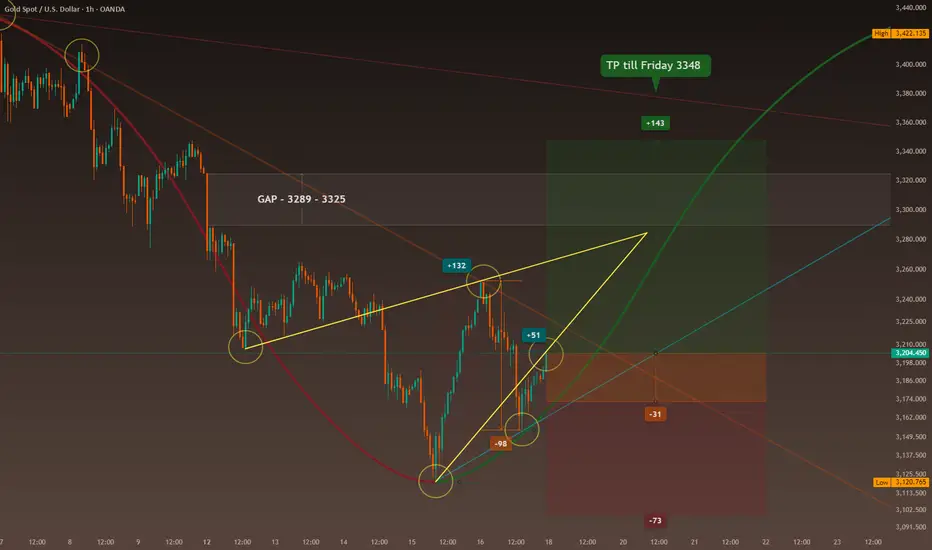
📊 Technical Analysis – Short-Term
Since May 12, an open GAP exists between $3,289 and $3,325 (36 $ range)
A V-shaped reversal formed from the low on May 15 ($3,120) to the Friday close ($3,204)
Symmetrical triangle formation suggests a convergence around $3,284 (possible by Tuesday)
➡️ Current trading range: $3,172 to $3,285 (113 $ range)
💡 Outlook for Monday, May 19
Time-Zone-Based Expectations:
Asia session (starting 1:00 AM London / 8:00 PM New York Sunday):
👉 Potential retest of $3,154
Europe session (8:00 AM London / 3:00 AM New York):
👉 Bullish outlook toward $3,234
U.S. session (2:30 PM London / 9:30 AM New York):
👉 Possible continuation of bullish move — open-ended potential
📌 Trade Setup – Monday 8:00 AM (London) / 3:00 AM (New York)
If price is below $3,154 → I stay flat and wait for clear signals
If price is above $3,172 → I consider a long position, unless conflicting news emerges
🎯 Weekly Target
My goal for the week is $3,348, provided the U.S. Dollar Index (DXY) holds near the 100-point level.
🧠 Conclusion
I am increasingly convinced that news-driven trading delivers the best results—if one can properly interpret the signals.
🔢 Fibonacci Levels
1h chart: low $3,131 → high $3,500 (April 22)
Levels: 0.315, 0.382, 0.5
1h chart: low $3,131 → high $3,435 (May 6)
Levels: 0.315, 0.382, 0.5
1h chart: low $3,131 → high $3,252 (May 16)
Levels: 0.315, 0.382, 0.5
-------------------------------------------------------------------------
This is just my personal market idea and not financial advice! 📢 Trading gold and other financial instruments carries risks – only invest what you can afford to lose. Always do your own analysis, use solid risk management, and trade responsibly.
Good luck and safe trading! 🚀📊
Analyses
EUR/USD analysis in 1 hourEUR/USD analysis in 1 hour
We also have a strong downward movement in the price
That is, we have a supply area, which means that the price will return to this area, and then it will bounce back to the bottom

eurcad sellwaiting for price to pill back ti 1.47100 and consolidate on a 15min timeframe then sell.
profit targert 1.46500
stoploss 1.47200

USD/JPY USD/JPY
Time frame:4H
well,i use in this technical analys the ict systems and fibo
we see that blocks on 4h time frame ,there are mitigation blocks that the price retested every time ,
Also,we will wait for a retest of the area between 133.800 and 134.134 ,
If he could penetrate that area with a volume , we can reached the second goal 136.500 ,
otherwise we will comeback to area between 128.000 and 127.500
This analysis remains my own analysis and not investment advice

scalping analyses for NQ my analyses idicate that the market is gonna be long and that a good time to buy in the market

GAZPROM analyseswe have signal in the market that idicate the next phase is short gazprom going down

good signal in SHOP marketwe have good signal idicate that the market is long but we still dont have good confirmation well wait and see what happen next


TCS LongTCS has been a fundamentally good stock which ultimately is good to hold for a long time. However, The recent budget has also been focused on IT which is an added advantage for IT Sector.
At present, the chart shows Cup and handle pattern which will fetch 10% and above on breakout. I'm holding TCS for quite a while now and looking forward to investing more.

AVALANCHE/TETHERUS LONG Avalanche currently has fastest smart contracts platform on market, which is one of the most important things in trading currency's. They also hit all time high's daily transactions (1M) while keeping gas fees low. Many more things are in motion so I expect price to go up.
Entry price (Black line): 75.38$
Stop loss (Red line): 72.63$
Target prices (Pink box):
1) 97.60$
2) 113.48$
Not financial advice.


FIOusdt on BinanceFIOusdt on Binance
ENGLISH
What do we all see?
The market structure tells us that we are still in an uptrend on macro vieuw, maw if we look at all the candles together it gives us the weather of an uptrending asset.
As a result, we automatically look for a long entery.
Short overview of our drawing tool layers:
VPVR indicates to us that we are on support
Momentum represents a ranging phase, (in favor of a long), ranging has a chance of a pullback (buy moment).
OBs put us that e are closer to support
Trading ranges, there we see an lvl that we are now trading for, close below it is high chance to pullback, close above it is high chance of further uptrending
As always, we are going to determine the most ideal entery - stop and branch proftits via our own layer system. given that the current market phase altcoin remains bullish tinged, we are also going to hunt for extend targets via the Fib; extention. Our extra layer of BIASlines (under construction) will allow us in the future to skip the fib, extension and prices to projects higher than the current trading area. as always, these will have the accuratity that we have gained from the MYpileus drawing tools.
Well now the game plan:
through the confluence strategy we arrive at the next lvl's - zones.
*attention, this is an obvious swing trade, respond appropriately with positionsizing!
Entery: Market - 0.0.2022 - 0.1834 - 0.1574
Stoploss : 0.1478
Take profit: 0.3268 - 0.4088 - 0.4744 - 0.5659 - 0.8145 - 1.2392
Wat zien we allemaal?
De market structure zegt ons dat we nog steeds in een uptrend zitten op macro view, maw als we alle candles samen bekijken geeft deze ons de weerspiegeling van een uptrending asset.
Hierdoor gaan we automatisch op zoek naar een long entery.
Korte overview van onze tekentool lagen:
VPVR geeft ons aan dat we op steun zitten
Momentum geeft een ranging fase weer, ( in het voordeel van een long), ranging heeft kans op een pullback (buy moment).
OBs zetten ons dat e dichter bij steun zitten
Trading ranges, daar zien we een lvl waar we nu voor aan het traden zijn, close eronder is high chance tot pullback, close erboven is high chance van verdere uptrending
We gaan zoals steeds via ons eigen lagen systeem de meest ideale entery - stop en tak proftits bepalen. gezien de huidige market fase altcoin blijven bullish getin, gaan we ook voor extend targets jagen via de Fib; extention. Ons extra laag BIASlines (under construction) zullen ons in de toekomst in staat stellen om de fib,extension over te slaan en prijzen te projecten hoger dan het huidige trading gebied. zoals steeds zullen deze de accuratheid hebben die we gewon zijn van de MYpileus tekentools.
Goed nu het gameplan:
via de confluence strategie komen we op volgende lvl's - zones uit.
*opgelet, dit i s een overduidelijk swing trade, reageer gepast met positionsizing!
Entery: Market - 0.0.2022 - 0.1834 - 0.1574
Stoploss : 0.1478
Take profit: 0.3268 - 0.4088 - 0.4744 - 0.5659 - 0.8145 - 1.2392

XTZUSD technical analysesmake a choice
it's targets are from fibbo retracements
and trend line is obvious in 1hr


ATOM-BTC$Atom seems to be in decisive period. OFcourse, all depending on #btcd , but it would be nice to see atom retest that .236 level again and then break and use it as support. I would wait for this break and retest before entering.


A Perfect Storm US30So.
With everything going on in the Yield Bonds market, it begs the question of what is to occur in the Stock market.
A correlation can be made between DXY and the US30 movements.
When is to come of this Daily Engulfing candle we have just observed?
Nothing can be guaranteed but if one this is observed; history repeats. The last time we saw an engulfing candle such as this was Sept 3, followed by a significant ABC correction.
Notice in the DXY analysis that there are EXTREMELY close time and price moves that can be correlated with this US30 analysis.
We will have to see how things play out.
The Fib Speed Fan is a relevant indicator of price moves through time. With every major reversal point being layed on the chart, we can see an equal and opposite move on the other side of the 1/1 ratio line.
There are significant mirroring patterns from the .75, .618, .50; on the upwards correction out of the gulley, into the uptrend, and now to the downward correction. The trendlines have been confirmed.
Through and through, we are seeing currencies looking extremely exhausted.
A correction is coming. Be cautious in these times of certainty.

VET/USD Probability of going to $0,085 Cents Near/Short termAs price might seem Bearish to some, i don't think Vet is due to a drop lower.. Please note i might be wrong so DYOR.
Price is corresponding to our Bull Flag and touched the 0.5 (golden zone between 0.5 and 0.618) level on the fib, i am expecting price to break out around 18 February and i have my targets at $0.085 cent.
You might ask why $0.085? Well that's because my take profit level on the Fibonacci (-0.618) gives me a price of $0.085 and if i measure the low of the Flag pole to the top of it and place it on the bottom of the breakout zone then we have the same price target of $0.085.
So, all with all i am Bullish on Vet and as always i wish you all good luck.. may your gains be strong!
xoxo Mico

GBPUSD1st scenario - If price breaks out of resistance, wait for pullback and then buy.
2nd scenario - If price don't break out sell.
(This is not a signal, I am a beginner trader)


manipulation?is the market manipulated? this is based around the mindset of retail traders:
blindly buy the brake of a certain range and het rich quick...
