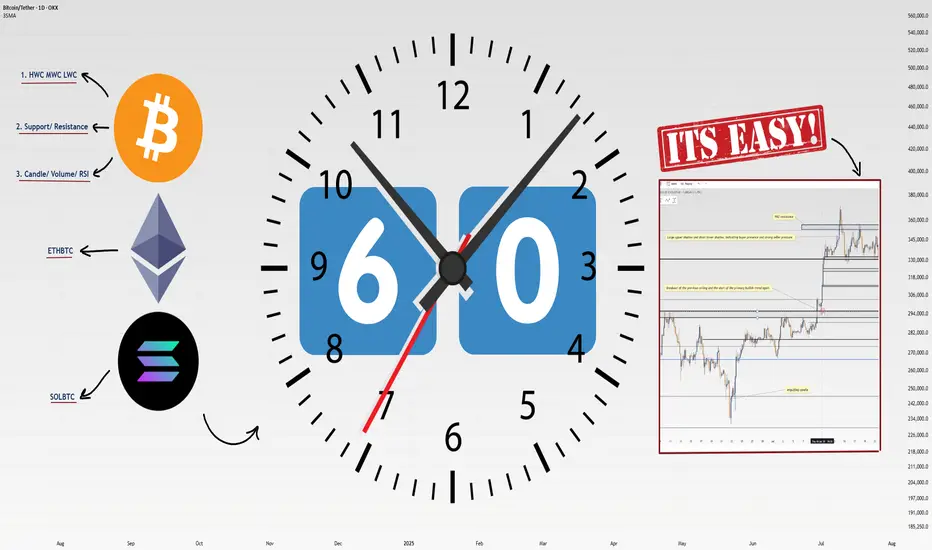
How I Analyze Any Coin in 60 Seconds: 4-Step Masterclass!Heyy traders, it’s Skeptic from Skeptic Lab! 🩵 I’m breaking down my lightning-fast method to analyze any coin in just 60 seconds . This 4-step process is how I spot long/short triggers like a pro. Buckle up, let’s dive in:
✔️ Step 1: Identify HWC/MWC/LWC (10 seconds)
Nature’s got a cool vibe—bet a lot of you hit the outdoors on weekends. When I see an apple tree from afar, it’s majestic, but up close, I spot branches and worm-eaten fruit. From a distance, I miss the details; up close, I lose the tree’s grandeur. Markets work the same. You need different timeframes to grasp the market structure. With practice in Dow Theory, trends, and tools, spotting HWC (Higher Wave Cycle), MWC (Mid Wave Cycle), and LWC (Lower Wave Cycle) becomes second nature. For me, this takes 10 seconds.
Want a full HWC/MWC/LWC guide? Check my free article I wrote a while back—it’s a hands-on tutorial ( link Cycle Mastery ).
📊 Step 2: Draw Support/Resistance Lines (20–30 seconds)
I start with higher timeframes: Monthly, then Weekly, then Daily. Once I’ve drawn lines up to Daily, I don’t always redraw for lower timeframes—often, I just adjust them.
Pro tip : Give more weight to the right side of the (recent data) since it’s fresher and more valuable. I change line colors for 4-hour lines, so I know they’re less critical than Daily. I don’t draw lines below 4-hour, but if you’re a scalper, tweak this to your strategy. This step takes me 20–30 seconds, the longest part.
📉 Step 3: Analyze Candles, Volume, Oscillators, and Indicators (10–15 seconds)
Here, I check everything I can: candles, volume, oscillators, and indicators . The goal? Stack confirmations for my triggers. Think RSI hitting overbought, volume spikes, larger candle sizes, or momentum surges—you get the vibe. This step’s length depends on your tool mastery. For me, it’s quick because I know what to look for.
🔔 Step 4: Check Coin Dominance (5–10 seconds)
This is the most critical yet simplest step. We need to track where liquidity’s flowing . For example, if SOL/BTC is bearish, I skip buying Solana—liquidity’s exiting. BTC.D (Bitcoin Dominance) is also key. The relationships dominance creates are complex and don’t fit in one analysis, but if you want a full dominance tutorial, drop it in the comments!
🔼 Key Takeaway: Using these 4 steps—HWC/MWC/LWC, support/resistance, candles/indicators, and dominance—I analyze any coin in 60 seconds. Your speed depends on experience and knowledge. If you’re new, this might take 60 minutes per coin, but don’t sweat it— practice makes you lightning-fast . Thanks for vibing with this educational idea! <3 I’ll catch you in the next one—good luck, fam!
💬 Let’s Talk!
Want a dominance tutorial or more tips? Hit the comments, and let’s crush it together! 😊 If this guide lit your fire, smash that boost—it fuels my mission! ✌️
Analysetechnique
USD/JPY 1H Analysis – Channel Breakout and Buy SignalOverview:**
The USD/JPY chart shows a **bullish breakout from a descending channel**, supported by technical indicators like the Ichimoku Cloud and a strong demand zone. This setup suggests a potential bullish reversal and upward momentum.
*Key Technical Points:**
* **Descending Channel Breakout:**
Price action has broken out of a falling channel, indicating a shift in market sentiment from bearish to bullish.
* **Strong Support Zone:**
Around 143.28 – 143.73, the price found significant support, which aligns with a previous demand zone. This area held firm, helping trigger the breakout.
* **Ichimoku Cloud:**
Price is emerging above the Ichimoku Cloud, signaling a potential start of an uptrend. If the price maintains above the cloud, bullish momentum may strengthen.
* **Resistance Levels:**
* **First Resistance:** Near 146.00 – a critical area to watch for short-term profit-taking.
* **Second Resistance:** Around 148.00 – a more extended target if bullish continuation holds.
---
### **Trading Idea:**
**BUY USD/JPY** on successful retest of the breakout or sustained move above the Ichimoku Cloud.
* **Entry:** 144.30–144.40 zone
* **Target 1:** 146.00
* **Target 2:** 148.00
* **Stop Loss:** Below 143.20 (under the support zone)
---
Conclusion:**
The chart presents a classic **bullish channel breakout** supported by the Ichimoku indicator and price action at a strong support zone. As long as the price holds above the breakout level and Ichimoku Cloud, the upside targets at 146 and 148 remain valid.
Let me know if you want this formatted as a trade plan or journal entry.
To ensure you do not miss the upcoming analysis, be sure to follow me!
Please leave a remark and a like!

Support/resistance has now been decisively broken.EUR/USD Technical Analysis – Daily Timeframe Overview
Disclaimer: This content is for educational and informational purposes only. It is not intended as financial advice. Please conduct your own research (DYOR) before making any trading decisions.
The EUR/USD pair has recently shown a notable technical development on the daily chart. A key trendline that has previously acted as dynamic support/resistance has now been decisively broken. Following the breakout, the price action has returned to retest this trendline from below—a common behavior that traders often refer to as a "break-and-retest" setup.
Adding further weight to this area is the presence of a breaker block, which is overlapping with the retesting zone. This convergence of technical structures increases the probability of a bearish rejection from this level. Should the market respect this zone as resistance, we can expect a potential downward move targeting the nearest Fair Value Gap (FVG), which has been highlighted on the chart.
However, traders should also consider a contingency scenario. If the FVG fails to act as a price magnet or support zone, further downside pressure could take the pair toward lower levels—specifically, the recent swing lows, which may serve as the next major support area.
This scenario aligns with the current market momentum and structure, but as always, price action confirmation and risk management are crucial.

BTC at Crossroads: Rejection from ATH or Breakout.Key Zones Highlighted:
🟥 Recent ATH and Resistance Level (~$111,000 - $112,000)
The price recently tested this area, forming a new All-Time High (ATH).
This zone has acted as a major resistance, causing a pullback.
A break and close above this range would indicate bullish continuation.
🟩 Support Zone (~$105,000 - $106,000)
Price previously bounced from this zone.
Currently acting as a mid-level demand/support.
Likely to be tested again if bearish pressure continues.
🟩 Strong Supply Zone (~$102,000 - $103,500)
A more significant support area, where previous buying pressure emerged strongly.
If the upper support fails, this becomes the next possible bounce zone.
Price Action and Projection:
Price is currently at $108,209 and moving within a correction phase.
Two potential scenarios are highlighted on the chart:
Bullish Continuation:
Price rebounds from current level (black circle) and breaks above the resistance zone.
Targets new highs beyond $112,000.
Bearish Pullback:
Price fails to sustain above current level and dips into the support zone (~$105K).
If strong buying interest appears, a bounce back to the ATH zone is expected.
Technical Outlook:
Ichimoku Cloud: Price is testing the Kumo (cloud), indicating neutral to slight bearish momentum.
Volume: Slight uptick in volume during the recent drop suggests sell pressure is increasing.
Structure: Price is forming a higher high and potentially a higher low, maintaining a bullish structure as long as support holds.
Conclusion:
BTC is in a critical zone with mixed signals. A decisive move from the current level will likely set the tone for the next 24–48 hours. Watch:
A bounce at ~$108K for bullish continuation,
A dip toward $105K for potential re-entry opportunities.
Let me know if you’d like trade setup suggestions based on this.

#AVAAIUSDT looks ready for further gains📈 LONG BYBIT:AVAAIUSDT.P from $0.05800
🛡 Stop Loss: $0.05170
⏱ 1H Timeframe
✅ Overview:
➡️ BYBIT:AVAAIUSDT.P shows strong bullish momentum, breaking key resistance levels.
➡️ The price is holding above $0.05730, confirming buyer control.
➡️ Trading volumes are increasing, signaling rising market interest.
➡️ POC at $0.05189 acts as solid support, reinforcing the long scenario.
⚡ Plan:
➡️ Wait for a confirmed hold above $0.05800 before entering.
➡️ Stop-Loss at $0.05170 to minimize downside risk.
➡️ Main target $0.06938, with intermediate take profits at $0.06165 and $0.06640.
🎯 Take Profit Targets:
💎 TP1: $0.06165
🔥 TP2: $0.06640
🚀 TP3: $0.06938
📢 Monitor $0.05730 – a breakout above strengthens the bullish case.
📢 Volume increase supports upward movement, confirming buying interest.
📢 Risk management – closing the trade if $0.05170 is broken down.
🚀 BYBIT:AVAAIUSDT.P looks ready for further gains, expecting a move towards targets!

Market Situation for #MOODENGUSDT📊 Market Situation for BYBIT:MOODENGUSDT.P
The asset is in a phase of uncertainty, consolidating between key levels. Price is forming an accumulation zone, where the next move will depend on reactions. A breakout from this range will determine direction – either a rally towards $0.07472 or a drop to $0.05624.
✅ The best approach in this situation is to add both scenarios to the watchlist and monitor price action.
✅ This allows traders to avoid premature entries and only enter after confirmation.
👉Two possible scenarios BYBIT:MOODENGUSDT.P
━━━━━━━━━━━━━
Bullish scenario
🔵 LONG BYBIT:MOODENGUSDT.P from $0.07060
🛡 Stop Loss: $0.06877
⏱ 1H Timeframe
Overview:
➡️ BYBIT:MOODENGUSDT.P is showing signs of reversal after testing support at $0.06376.
➡️ Volume is increasing, suggesting possible accumulation by buyers.
➡️ A breakout above $0.06920 and confirmation could push the price toward $0.07315 and $0.07472.
Take Profit targets:
💎 TP1: $0.07315 – first resistance level.
💎 TP2: $0.07472 – main profit-taking zone.
Plan:
➡️ Bullish confirmation requires a solid breakout above $0.06920.
➡️ Entry is preferred after a retest or with increasing volume.
➡️ If the breakout happens on low volume, it might be a false move.
━━━━━━━━━━━━━
Bearish scenario
🔴 SHORT BYBIT:MOODENGUSDT.P from $0.05914
🛡 Stop Loss: $0.06054
⏱ 1H Timeframe
Overview:
➡️ If the price fails to break $0.06376 and starts dropping, further downside is likely.
➡️ Sellers are active, and a loss of $0.05962 could trigger a selloff.
➡️ Support at $0.05624 could be reached if the downtrend continues.
Take Profit target:
💎 TP1: $0.05624 – support test.
Plan:
➡️ Bearish confirmation comes with a breakdown below $0.05962.
➡️ If volume increases on the drop, expect an accelerated decline.
➡️ If the price rebounds sharply, the short position should be reconsidered.
🚀 BYBIT:MOODENGUSDT.P Waiting for the Signal!

#MELANIAUSDT further bearish movement!📉 SHORT BYBIT:MELANIAUSDT.P from $1.420
🛡 Stop Loss: $1.440
⏱ 1H Timeframe
✅ Overview:
➡️ BYBIT:MELANIAUSDT.P continues its bearish trend, failing multiple times to break above resistance $1.469.
➡️ POC at $1.469 indicates a strong liquidity zone, acting as resistance and reinforcing bearish pressure.
➡️ The price broke below $1.424, confirming further downside momentum.
➡️ The next key support level is $1.380, which is the primary target for this short setup.
⚡ Plan:
📉 Bearish Scenario:
➡️ Enter SHORT from $1.420 , as the price continues its decline.
➡️ Manage risk with Stop-Loss at $1.440 to protect against a potential reversal.
➡️ Main downside target:
🎯 TP Target:
💎 TP1: $1.380 — the nearest support level for profit-taking.
📢 If the price BYBIT:MELANIAUSDT.P remains below $1.424, the downtrend is likely to continue.
📢 However, a move back above $1.440 could invalidate the short setup.
🚀 BYBIT:MELANIAUSDT.P Expecting further bearish movement!

ETH/USDT Setup: Trendline retest before next moveAfter a strong bullish move, ETH/USDT 🔥 broke below its downward trendline 📉 and started moving lower. A potential pullback to retest the broken trendline ⚠️ could be on the horizon before the price resumes its downward path, targeting the key support level 🛑. Traders should watch this zone closely for opportunities! 📊💡

XAUUSD 100% CPI signal Alert!The latest CPI update is in, and with Trump elected as the new President of the U.S., we’re seeing a strong bullish reaction from the DXY while gold is in a steep decline.
We have two scenarios to consider:
Scenario 1: If the government pauses interest rates until the new administration is in place, we may initially see a bullish spike in gold, followed by a decline.
Scenario 2: If the government cuts interest rates by 0.5%, we could see gold drop by approximately 200 to 300 pips.

S&P 500 IndexHello community,
Weekly chart.
My goal: 6,118 points.
I have drawn a Fibonacci extension to get the target.
In orange, the 200-period simple moving average.
Make your opinion before placing an order.
► Thank you for boosting, commenting, subscribing!

AUDUSD next possible moveWe are waiting for our asset to reach our action zone, and based on the reaction, we’ll decide on our next moves.ALWAYS WAIT FOR A CONFIRMATION TO SEE IF THE PRICE VALIDATES THE ZONE.

UnitedHealth Group Incorporated (daily - log)Hello community,
Small daily analysis in log.
The trend is bullish, we have a gap lately that should be filled logically.
I have indicated on the graph the three accumulation zones.
Graphically, it's beautiful.
We are at the bottom of the regression line channel, we will have to watch that it does not break down.
Make your opinion, before placing an order.
► Thank you for boosting, commenting, subscribing!

ETF SPY weekly (log)Hello everyone,
Weekly chart in logarithmic scale.
The channel is bullish, we are in the upper part of the channel, but I do not see any bullish exaggeration.
The 200-period simple average is bullish in orange on the screen.
In any case, investing in the SPY is a very good investment.
Make your own opinion, before placing an order.
► Thank you for boosting, commenting, subscribing!

Gold Spot / U.S. DollarHello community,
Look at the price of gold since 1833!
Weekly scale in log, I use linear regression, powerful mathematical tool!
The graph speaks for itself.
Make your opinion, before placing an order.
► Thank you for boosting, commenting, subscribing!

Berkshire Hathaway Inc. New (log)Hello community,
Weekly graph on logarithmic scale.
A quick look in the rearview mirror.
What can we say about the performance of the fund of the "god" of investment, except BRAVO!
A little quote that I love:
"Wall Street is the only place where people get into a Rolls Royce to get advice from those who take the subway."
Make your own opinion, before placing an order.
► Thank you for boosting, commenting, subscribing!

Amazon.comHello community,
A little analysis of Amazon stock.
We must watch the break of the trend line.
The movement is bullish, the 200-period simple average is bullish.
The 3 green zones on the chart indicate the accumulation zones.
The end-of-year holidays should be beneficial for the stock.
Make your opinion, before placing an order.
► Thank you for boosting, commenting, subscribing!

Church & Dwight Company, Inc. (log)Daily chart.
Exit up or down?
On the chart, volume accumulation zone.
Orange line, SMA 200.
Make your opinion, before placing an order.
► Thank you for boosting, commenting, subscribing!

gold look like to make up trendgold on support area,its break structure in lower tf so we can expect a short buy from here..confirm it before entering your own... thank you

Raydium _ Next Target is Previous High, Make a +575% PROFITRaydium is going to break the 0.6 Fibonacci Retracement level. If the market close above the 0.6 Fibonacci Retracement level, then the market Approaching Previous High. So Previous High is the Next Target. And Offering the chance to make a +575% Percentage Profit.
Support me; I want to Help People Make PROFIT all over the "World".

SOFTBANK Group _ Next Target is Channel Top +42 % PROFITA Rising Channel Pattern has formed, and the Previous All-Time High has also breakout. The Next Target is the Channel Top, offering a chance to make a PROFIT of 42% or more. For Long-Term Analysis, you must follow the Trend continuation technique.
I want to help people to Make Profit all over the "World".

TOYOTA MOTOR _ Rising Wedge Pattern Target Reached _ 62 % ROI A Rising Wedge Pattern formed, and a Breakout occurred, achieving the pattern target. Buy in August 2023 and Sell in March 2024, achieving a 62% ROI within 8 months.
I want to help people to Make Profit all over the "World".

DXY (DOLLAR) IS TRYING TO RECOVER, (READ CAPTION)The dollar is trying to recover in today's trading from the US Federal Reserve's strike
The US dollar achieved a modest rise during trading on Thursday, as the green currency attempted to recover from the losses incurred last session as a result of negative federal developments.
In this regard, the dollar incurred strong daily losses at the end of yesterday’s session, estimated at about 0.43%, affected by the less stringent statements of US Federal Reserve Governor Jerome Powell, which he made yesterday evening, as Jerome Powell said that postponing the interest rate reduction step may harm the US economy, It is expected that the interest rate reduction cycle will begin in the second half of this year, while hinting that despite the strong conditions in the labour market and the outstanding performance of the US economy, this will not prevent the US Federal Reserve from taking interest rate reduction measures.
This coincided with the pressures facing the dollar at that time immediately after the release of economic forecasts by the US Federal Reserve, which indicated the possibility of reducing US interest rates three times this year, which means that the US Federal Reserve did not take into account the rise in inflation rates during the past two months, and here it is worth noting. Pointing out that the markets now see a 65% chance that the US Federal Reserve will start cutting interest rates at the June meeting, according to the performance of tracking federal interest rates issued by the CME Group.
If you like this informative data and technical analyse please support my ideas and follow thanks for kindness.

NZDUSD SELL | Sell Setup| Short Trading AnalysisHello Traders, here is the full analysis.
Watch strong action at the current levels for SELL . GOOD LUCK! Great SELL opportunity NZDUSD
I still did my best and this is the most likely count for me at the moment.
Support the idea with like and follow my profile TO SEE MORE.
Traders, if you liked this idea or if you have your own opinion about it, write in the comments. I will be glad 🤝
Patience is the If You Have Any Question, Feel Free To Ask 🤗
Just follow chart with idea and analysis and when you are ready come in THE GROVE | VIP GROUP, earn more and safe, wait for the signal at the right moment and make money with us💰
