550+ Points Secured on MNQ | Bullish FVG + Gap Fill PrecisionIn today’s trade, we captured over 550 points on MNQ, banking a solid $288 profit on one clean, high-probability setup.
Here’s the breakdown:
Sunday’s open left a gap above, creating a clear target for buy-side liquidity.
During Asia, price dipped into a validated Daily Bullish FVG, which had previously been traded through and reclaimed — a powerful sign of support.
As price retraced into the 30m FVG and approached its high, I entered at 7AM, aiming for the equal highs above.
Although we exited slightly early before the 10am open push, price ultimately fulfilled the full TP target, confirming the strength of the setup.
🎯 Bonus insight: As mentioned in the video, re-entry at the 50% of the 30m FVG was also valid — and it could’ve netted another 600+ points. That’s how powerful these FVG structures are when aligned with narrative and timing.
Watch the full video to see the exact entry logic, TP strategy, and lessons learned.
Don’t forget to like, comment, and subscribe for more trade recaps and educational content!
#MNQ #NasdaqFutures #FVG #FairValueGap #LiquidityTrading #DayTradingStrategy #SmartMoneyConcepts #TradeRecap #FuturesMarket #GapFill #PriceAction
Analysis

GOLD ROUGH IDEASo last time we failed to close above that daily level which we have now closed above. We created a huge 4H fvg on the way. We might retrace to that fvg and proceed to the next daily level above.

AUD/USD - Triangle Breakout (02.06.2025)The AUD/USD pair on the M30 timeframe presents a Potential Buying Opportunity due to a recent Formation of a Triangle Pattern. This suggests a shift in momentum towards the upside and a higher likelihood of further advances in the coming hours.
Possible Long Trade:
Entry: Consider Entering A Long Position around Trendline Of The Pattern.
Target Levels:
1st Resistance – 0.6490
2nd Resistance – 0.6512
🎁 Please hit the like button and
🎁 Leave a comment to support for My Post !
Your likes and comments are incredibly motivating and will encourage me to share more analysis with you.
Best Regards, KABHI_TA_TRADING
Thank you.
Disclosure: I am part of Trade Nation's Influencer program and receive a monthly fee for using their TradingView charts in my analysis.

$TRUMP Bounces from Golden Pocket – Rally Incoming?$TRUMP has bounced from a strong support zone around $10.30–$10.50, which lines up with the 0.618 Fib level.
As long as this support holds, price could push toward $11.78 and possibly higher to $13.00+ if momentum builds.
The structure looks healthy, and buyers are stepping in again.
Keep watching, a move toward the upper levels may be starting! 👀
#Trump #ALTSEASON

XAUUSD | 1h BearishGold (XAUUSD) 1H Analysis
Currently, gold is showing signs of a potential bearish reversal from a key supply zone. Price tapped into the previous high and reacted with strong rejection, suggesting weakening bullish momentum. This area aligns with a clear zone of interest, where sellers previously stepped in, adding confluence to our bearish bias.
The structure has been respected so far, and price has now broken below the minor trendline support, which previously acted as dynamic support for this bullish leg. A pullback to retest this broken structure or the imbalance zone just above could provide an optimal entry for further downside.
The trade idea is built on a potential shift in market structure:
A double top internal structure formation is visible at the recent high, indicating exhaustion in the uptrend.
Price is expected to push lower, targeting TP1, which sits at the previous strong support zone and aligns with the internal structure break.
Further continuation to the downside could take price toward the 0.5 FIB retracement level and PDL (Previous Day Low)—both strong liquidity areas.
We are anticipating a reaction from these lower zones. If bullish momentum reappears there, it may offer a chance to reposition for long setups later. For now, the bias remains bearish while price holds below the supply zone and structure confirms.

Will the Dollar’s Drop Fuel More Gold Upside After Weak PCE DXY OUTLOOK – Will the Dollar’s Drop Fuel More Gold Upside After Weak PCE and Trade Tensions?
📉 TECHNICAL STRUCTURE – DXY CONTINUES TO WEAKEN
The US Dollar Index (DXY) has failed to hold the 99.20–99.30 support zone and continues to respect its bearish structure on the H2 chart. The sharp sell-off at the end of May was a direct response to weaker-than-expected PCE inflation data, combined with growing political uncertainty surrounding US–China and US–EU trade negotiations.
🔻 Key Resistance Levels: 99.234 – 99.618
🔻 Key Support Zone: 98.030 – A clean break below this may open the door toward 97.50
🌍 MACRO CONTEXT – USD UNDER PRESSURE ON MULTIPLE FRONTS
Trump’s tariff decisions remain unclear. While some deadlines were delayed (e.g., steel tariffs on the EU), no substantial agreements have been reached.
Core PCE inflation – the Fed’s preferred gauge – continues to ease, reducing expectations of further rate hikes in the short term.
Institutional flows are shifting toward safe havens like gold, especially as uncertainty clouds the outlook for both US fiscal and trade policy.
📊 IMPACT ON XAUUSD – DOLLAR DROP GIVES GOLD ROOM TO RALLY
Gold remains supported by:
A weakening DXY trend
A bullish structure on H1 with EMA 13–34–89–200 alignment in favor of upside
Strong safe-haven demand heading into a new month with fresh capital inflows
If DXY breaks below 98.70 and slides toward 98.030, gold could extend its rally toward key resistance zones at 3348 – 3361.
🎯 TRADING STRATEGY (Based on DXY Bearish Continuation):
Prioritize buy setups on XAUUSD if DXY fails to reclaim the 99.23 resistance
Watch for a potential DXY pullback to resistance – if rejected, this would confirm momentum for gold to climb further
📌 NOTE: Traders should stay alert to any major news from the Fed or new developments in US–China–EU trade talks. While the current DXY structure favors continued downside, short-term pullbacks can provide gold with consolidation before another leg higher.

BTCUSD UPDATE 2- 6 - 25The chart you uploaded shows a falling wedge pattern on the Bitcoin (BTC/USD) 1-hour chart. Here is an updated analysis based on visual indicators:
---
🔍 Pattern Overview:
Pattern: Falling Wedge (bullish reversal pattern)
Price Action: Consolidation within two downward sloping trend lines
Current Price: Around $104,773
Potential Breakout Target: ~$112,240
Support Zone: ~$102,830
---
📈 Updated Technical Outlook:
✅ Bullish Scenario:
If BTC breaks above the wedge resistance (upper blue line), a rally towards $112,240 is possible.
This level is likely captured by the wedge height projected above the breakout point.
Look for a clear breakout candle with volume above ~$105,000 for confirmation.
⚠️ Bearish scenario:
Failure to hold above support (~$102,830) could invalidate the bullish setup.
A break below this could open the door to further declines, especially if macroeconomic factors turn negative.
---
📅 Timing and Events:
Marked by icons at the bottom are upcoming US economic events, which could trigger volatility.
Keep an eye out for high-impact data releases like non-farm payrolls, CPI, or interest rate announcements.
---
✅ Actionable Summary:
Buy Trigger: Break and close above the wedge with strong volume (~$105K+)
Target: $112,240
Stop Loss: Below $102,830 (or below the lower trendline)
Would you like me to interpret or update the image with these insights, or create a fresh one with the expected breakout?

Fundamental Market Analysis for June 2, 2025 EURUSDEUR/USD is recovering its recent losses recorded during the previous session, trading around 1.13700 on Monday during Asian hours. The pair is strengthening amid a weakening US dollar (USD) after the US Court of Appeals ruled on Thursday to allow US President Donald Trump's tariffs to take effect.
On Wednesday, a panel of three judges at the International Trade Court in Manhattan said Trump had exceeded his authority by imposing broad import tariffs and ruled the orders issued on April 2 illegal.
On Friday, President Trump said at a rally in Pennsylvania that he plans to double import tariffs on steel and aluminum to increase pressure on global steel producers and escalate the trade war. “We are going to impose a 25 percent increase. We are going to raise tariffs on steel imported into the United States from 25 percent to 50 percent, which will further strengthen the steel industry in the United States,” he said, according to Reuters.
On Saturday, the European Commission (EC) warned that Europe is ready to respond to President Trump's plan to double tariffs on imported steel and aluminum, which would escalate the trade war between the world's two largest economic powers.
Trading recommendation: BUY 1.13600, SL 1.13200, TP 1.14200

MKR 1W🔍1. Overall Trend:
In the long term, we can see that MKR was in a downtrend, as evidenced by the falling trendline (orange dashed line).
The last candles show that the price has broken this downtrend line - this could indicate a potential trend reversal or at least an attempted upside correction.
📊Support and resistance levels (horizontal chart):
Strong support (red) and resistance (green) levels are marked:
✅ Resistances:
~3,770 USDT – local top, very strong resistance.
~3,079 USDT – previous support, now acting as resistance.
~2,002 USDT – current growth barrier, price is currently struggling with this level.
🔻 Supports:
~1,574 USDT – current local support.
~1,248 USDT – next support, previously tested.
~800 USDT and ~400 USDT – historical accumulation zones, deep support levels.
Oscillators (bottom of the chart):
Stochastic RSI – currently in the upper zone, which may suggest that the market is approaching overbought. Possible correction.
RSI (classic) – oscillates around 50, i.e. neutral, but with a slight upward slope. There is no overbought signal yet.
🧠 Conclusions:
➕ Bullish signals (pro-growth):
Break of the downtrend line (may be the first signal of a trend change).
Formation of a higher low.
Oscillators are not yet in the extreme zone.
➖ Bearish signals (pro-fall):
The price has not yet managed to break the resistance at 2,002 USDT.
Stochastic RSI indicator close to the overbought zone - possible short correction.
📌 Scenarios:
1. Upside scenario:
If the price breaks through the 2,002 USDT level and stays above it, the next target will be the 3,079 USDT level.
Confirmation will be the rising RSI and staying above the trend line.
2. Downside scenario:
If the price fails to break through the 2,002 USDT level and falls below the 1,574 USDT level, a possible test of the 1,248 USDT level or even lower (800 USDT).

Bitcoin Wasn't Built for Bull Runs — It Was Built for This MomenDear traders,
You may be witnessing a “first” — a pivotal moment right before things begin to spiral.
We’re not fortune tellers. We don’t claim to predict the future.
But what you’re about to read is based entirely on **publicly available data**, interpreted not through speculation, but through a deep, rational analysis of interconnected facts — the kind of connections that most overlook, and few dare to question.
We may not know how the future is being orchestrated behind the scenes...
But one thing seems certain: **crisis always comes first...** and *then* we are given a **narrative** to justify it — be it war, a pandemic, or a "global emergency."
This is the correct sequence... and it’s the one they never teach you.
Yet for those of us who navigate the financial markets, one question matters more than all others:
**How do we profit from this?**
---
We recently shared an important setup on the **Nasdaq index**, the benchmark that reflects — to a large extent — the true state of the U.S. economy.
As a proxy for the 100 largest American corporations, the Nasdaq plays a critical role in signaling macro trends.
And while some are just now waking up to the storm ahead, **our outlook has been clear since October 2022**:
A major economic crisis was not only probable… it was **inevitable**.
Some analysts chalk this up to uncontrolled money printing post-2019 as governments tried to patch the damage from the COVID-19 crisis. That’s one explanation.
But at **Glich**, our vision is different.
More complex.
And for now… **not something we can fully release**.
---
For years, strong correlations between **risk markets** — especially U.S. equities and crypto — held firmly in place.
But something changed on **May 30th, 2025**. Completely and unmistakably.
The link was severed.
Now ask yourself:
**Why was Bitcoin created in the first place?**
It wasn’t just digital money.
It was a bold, revolutionary idea. A system designed for a future economy no longer shackled by inflation, central banking failures, or hidden agendas.
A fluid, transparent, and secure network for a world in desperate need of change.
The current financial model is obsolete. It’s no longer evolving — just surviving.
And it can no longer answer the challenges of what's to come.
**2008 was not the collapse; it was the setup.** A convenient pretext to slowly roll out something **new**.
And "Satoshi Nakamoto"? Well, let’s just say...
**That name means more than you think.**
_"HIDDEN INFORMATION"_ 👁️
---
What does NEO mean when he says:
> "This has all happened before… yet it’s happening for the first time"?
And what does that have to do with us?
This analysis is *not* just about charts or setups.
It’s a **hidden message** — a spotlight on a once-in-a-generation opportunity lying in plain sight.
But not everyone is trained to read between the lines.
---
Let us ask:
- Why was **Donald Trump** specifically pushed into position?
- Why is crypto — after being suppressed, banned and attacked worldwide — now being quietly **promoted** and fast-tracked in legislation during 2024 and 2025?
Something’s moving beneath the surface.
---
### 🔍 In summary:
- Expect a tidal wave of **global crypto legislation** to pass in the coming **days/weeks/months**.
- Crypto — particularly **BTC and ETH** — will become silent **stores of value** during the economic storm.
- Expect record-breaking levels: **$400K for Bitcoin**, **$40K for Ethereum**.
Yes, this may sound like science fiction…
But keep your eyes and ears wide open. 👁️
- And brace yourself for a **historic collapse** in U.S. equities. Possibly… something we’ve never seen before.
---
The show is starting.
And we won’t spoil the ending — because watching it unfold is part of the experience.
But here’s what we *can* say, thanks to our proprietary **algorithmic system**:
- The **U.S. economy will bleed**.
- And crypto will blow past expectations — fulfilling the very purpose it was built for.
---
🛒 Load your bags in the coming days...
Because when this train leaves the station —
It won't be stopping for anyone.

Nasdaq Signals Economic Instability – Are You Watching CloselyDear traders,
You may be witnessing a “first” — a pivotal moment right before things begin to spiral.
We’re not fortune tellers. We don’t claim to predict the future.
But what you’re about to read is based entirely on publicly available data, interpreted not through speculation, but through a deep, rational analysis of interconnected facts — the kind of connections that most overlook, and few dare to question.
We may not know how the future is being orchestrated behind the scenes...
But one thing seems certain: crisis always comes first... and then we are given a narrative to justify it — be it war, a pandemic, or a "global emergency."
This is the correct sequence... and it’s the one they never teach you.
Yet for those of us who navigate the financial markets, one question matters more than all others:
How do we profit from this?
We recently shared an important setup on the Nasdaq index, the benchmark that reflects — to a large extent — the true state of the U.S. economy.
As a proxy for the 100 largest American corporations, the Nasdaq plays a critical role in signaling macro trends.
And while some are just now waking up to the storm ahead, our outlook has been clear since October 2022:
A major economic crisis was not only probable… it was inevitable.
Some analysts chalk this up to uncontrolled money printing post-2019 as governments tried to patch the damage from the COVID-19 crisis. That’s one explanation.
But at Glich, our vision is different.
More complex.
And for now… not something we can fully release.
For years, strong correlations between risk markets — especially U.S. equities and crypto — held firmly in place.
But something changed on May 30th, 2025. Completely and unmistakably.
The link was severed.
Now ask yourself:
Why was Bitcoin created in the first place?
It wasn’t just digital money.
It was a bold, revolutionary idea. A system designed for a future economy no longer shackled by inflation, central banking failures, or hidden agendas.
A fluid, transparent, and secure network for a world in desperate need of change.
The current financial model is obsolete. It’s no longer evolving — just surviving.
And it can no longer answer the challenges of what's to come.
2008 was not the collapse; it was the setup. A convenient pretext to slowly roll out something new.
And "Satoshi Nakamoto"? Well, let’s just say...
That name means more than you think.
"HIDDEN INFORMATION" 👁️
What does NEO mean when he says:
"This has all happened before… yet it’s happening for the first time"?
And what does that have to do with us?
This analysis is not just about charts or setups.
It’s a hidden message — a spotlight on a once-in-a-generation opportunity lying in plain sight.
But not everyone is trained to read between the lines.
Let us ask:
Why was Donald Trump specifically pushed into position?
Why is crypto — after being suppressed, banned and attacked worldwide — now being quietly promoted and fast-tracked in legislation during 2024 and 2025?
Something’s moving beneath the surface.
🔍 In summary:
Expect a tidal wave of global crypto legislation to pass in the coming days/weeks/months.
Crypto — particularly BTC and ETH — will become silent stores of value during the economic storm.
Expect record-breaking levels:
400
K
f
o
r
B
i
t
c
o
i
n
∗
∗
,
∗
∗
400KforBitcoin∗∗,∗∗40K for Ethereum.
Yes, this may sound like science fiction…
But keep your eyes and ears wide open. 👁️
And brace yourself for a historic collapse in U.S. equities. Possibly… something we’ve never seen before.
The show is starting.
And we won’t spoil the ending — because watching it unfold is part of the experience.
But here’s what we can say, thanks to our proprietary algorithmic system:
The U.S. economy will bleed.
And crypto will blow past expectations — fulfilling the very purpose it was built for.
🛒 Load your bags in the coming days...
Because when this train leaves the station —
It won't be stopping for anyone.

ETH/USD Technical Outlook – Key Patterns in PlayEthereum is showing key technical formations on the daily chart:
🔸 A Rectangle Range that held for months
🔸 A confirmed Falling Wedge breakout, signaling possible reversal
🚀 Immediate target is above the $3,000 level if momentum sustains.
📊 Watch for volume confirmation before entries.
This is not financial advice. DYOR ✅
#ETH #Ethereum #CryptoAnalysis #ChartPatterns #TechnicalAnalysis #TradingView #ETHUSD #Altcoins #CryptoTraders #BullishSetup

Professional Analysis: XAU/USD – GOLD Price Forecast :
📈 Professional Analysis: XAU/USD – GOLD Price Forecast 🟡
🗓️ Date: May 28–29, 2025 | ⏱ Timeframe: Intraday (Hourly)
🔍 Instrument: Gold vs. USD (XAU/USD)
📊 Technical Chart Summary
🟥 Resistance Zone:
📌 Level: $3,350 – $3,365
🛑 Price has rejected this zone multiple times, marking it as a strong supply area.
📉 Each test of resistance led to a pullback — showing seller strength 💪.
🟩 Support Zone:
📌 Level: $3,280 – $3,295
🛡 Multiple higher low bounces suggest this zone is being defended by buyers.
🔁 Price has formed 3 reaction lows, indicating accumulation 📥.
🔄 Structure & Pattern Recognition
🔺 Descending followed by Ascending Swings
⛳ Market shows a reversal attempt after forming a potential double bottom / triple test at support.
📈 Bullish structure forming with the latest swing creating a higher low.
📉 Past wave = Bearish Correction
📈 Current projection = Potential bullish impulse if the support holds.
📐 Projection & Price Action Forecast
📍 Current Price: $3,297.175
📈 Expected Move: Bounce off support → climb toward $3,330–$3,350 🔼
🧠 Rationale:
Price testing support again
Market respecting horizontal range
No clean breakdown yet
📊 Bullish Scenario (Primary)
🔁 Rebound off support
🎯 Target: Resistance zone ($3,350)
✅ Entry: Above $3,300 with bullish candle close
🛑 SL: Below $3,280
📉 Bearish Breakdown (Alternate)
❌ Break below $3,280
🎯 Target: $3,260 or lower
⚠️ Wait for confirmation candle
🔚 Conclusion
🟡 Gold (XAU/USD) is trading within a well-defined range with buyers stepping in near $3,290 and sellers near $3,355.
📌 Based on current technicals, there’s a higher probability of an upward move, unless support breaks decisively.
🛠️ Pro Tip:
💡 Use RSI + Volume to confirm momentum on breakout. Look for bullish divergence or volume surge near the bounce.

Gold Drops $30 in Asia as Month-End Profit Taking Hits Hard XAUUSD PLAN – Gold Drops $30 in Asia as Month-End Profit Taking Hits Hard
After a sharp rebound candle yesterday, gold unexpectedly reversed in the Asian session, plunging over $30 as market participants rushed to exit positions ahead of the monthly close. The move reflects strong technical rejection and potential macro pressure.
🌐 MACRO OUTLOOK – US-CHINA TRADE TENSIONS BACK IN FOCUS
Trade negotiations between the US and China are showing renewed signs of strain, especially around tariff policies.
The uncertainty has not triggered safe-haven flows into gold—a sign of waning momentum.
Dollar Index (DXY) remains range-bound, offering no clear direction.
Broad market sentiment indicates institutional cash-out behavior ahead of the weekly and monthly candle closes.
📉 TECHNICAL OUTLOOK – BEARISH STRUCTURE STILL INTACT
Gold is respecting a downward sloping channel on the H1 timeframe.
Price failed to hold above EMA 200, reinforcing bearish bias.
EMA 13 – 34 – 89 – 200 are in bearish alignment, showing continued downside momentum.
Support at 3274 – 3276 is a key reaction zone for potential scalping opportunities.
🔑 KEY PRICE LEVELS TO WATCH
🔴 SELL ZONE: 3322 – 3324
Stop-Loss: 3328
Take-Profit: 3318 → 3314 → 3310 → 3306 → 3300 → 3295 → 3290 → 3280
🟢 BUY ZONE: 3266 – 3264
Stop-Loss: 3260
Take-Profit: 3270 → 3274 → 3278 → 3282 → 3286 → 3290 → 3300
⚡ BONUS SCALP SETUPS
Support Zone 3274 – 3276 → Look for bullish rejection for a quick BUY SCALP (Target: 50 pips / SL: 50 pips)
Resistance Zones 3302 – 3304 and 3310 → Watch for early rejection to enter SELL SCALP, with extended downside targets.
📌 STRATEGY NOTES
Priority: Short-term sell bias unless price reclaims 3310 with momentum.
Avoid trading in the mid-range; wait for price to reach key reaction zones.
Today’s structure favors liquidity sweeps, so patience and disciplined entries are crucial—especially during London and NY overlap.

Fundamental Market Analysis for May 30, 2025 USDJPYThe Japanese yen (JPY) attracted strong follow-through buying for the second consecutive day on Friday and continued to recover from a two-week low reached the previous day against the US dollar. Global risk sentiment deteriorated after a federal appeals court on Thursday suspended a recent ruling blocking US President Donald Trump's radical tariffs. This is evident from the general weakening of sentiment in the stock markets and is contributing to a recovery in demand for traditional safe-haven assets, including the JPY.
Meanwhile, optimistic macroeconomic data from Japan released today, including strong consumer inflation figures in Tokyo, confirm the need for further interest rate hikes by the Bank of Japan (JPY) and provide additional support for the JPY. On the other hand, the US dollar (USD) is consolidating after a sharp reversal yesterday amid concerns about the deterioration of the US financial situation and bets that the Federal Reserve (Fed) will stick to its easing policy. This further contributes to the continued decline of the USD/JPY pair.
Trading recommendation: SELL 143.800, SL 144.200, TP 142.900

$BUSDT Ready to Explode? Breakout Could Send It Flying#BUSDT is demonstrating strong potential for a pennant breakout.
A successful breakout could trigger a +60% bullish rally in the coming days. 🚀
#Altseason2025

+113% gain made in 40 minues with Double BuyHUGE 🚀 +113% gain made in 40 minues with Double Buy Alert from $0.70 to Take Profit Alert at $1.10 🎯 Expected $1+ that's why two buy attempts were made during the day at $0.66 with both with $1.10 max target but shortsellers kept dropping the price and preventing a push higher so had to exit each time for controlled loss.
Finally once after hours came they can't manipulate as much as they're able during the day so I notified everyone about $0.70 double buy and $1+ expectation. Soon after huge win was pocketed!
Awesome end of the day with NASDAQ:ASBP after bumpy start of the day not taking profit on AMEX:SGN on time

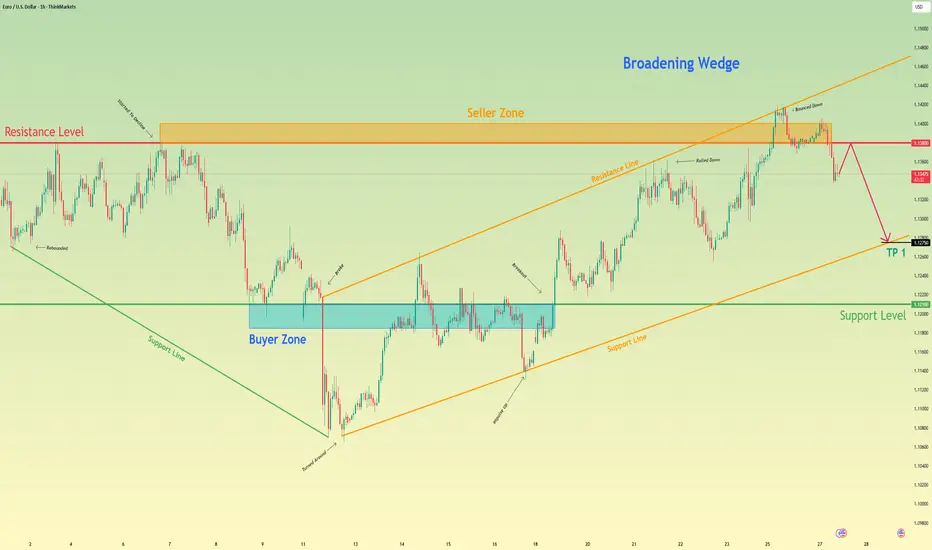
Euro may grow to resistance level and then drop to 1.1275 pointsHello traders, I want share with you my opinion about Euro. After forming a strong upward move from the buyer zone (1.11850–1.1210), the price rose sharply, broke the mid-range resistance, and entered the seller zone between 1.1380 and 1.1400. Once it reached the upper boundary of the broadening wedge, the price bounced down from resistance at 1.1380. Now the price is trading inside a broadening wedge, showing signs of a potential reversal. After failing to hold above resistance, the Euro started to decline from the seller zone, confirming selling pressure. The current movement points to a correction within the wedge structure. I expect the Euro will continue falling toward 1.1275, my TP 1, where the support line of the wedge coincides with the upper boundary of the previous buyer zone. This zone has already shown strong reactions before and could act as a short-term reversal area. Given the recent rejection from resistance, the broadening wedge formation, and return from the seller zone, I remain bearish and anticipate further decline. Please share this idea with your friends and click Boost 🚀
Disclaimer: As part of ThinkMarkets’ Influencer Program, I am sponsored to share and publish their charts in my analysis.
EUR/USD UPDATE 29 5 2025The chart you've shared is a 30-minute candlestick chart for the Euro/US Dollar (EUR/USD) currency pair, published on TradingView. Here’s a breakdown of the technical elements:
Key Levels and Zones:
Support Zone (lower yellow zone): ~1.12100 to ~1.12500
Current Price: 1.12776
Resistance Zones:
Mid resistance zone: ~1.12850 to ~1.13000
Upper resistance zone: ~1.13500 to ~1.13700
Observations:
The price is currently around 1.12776, just below the mid resistance zone.
The chart includes two blue arrow projections:
1. A bullish projection: Suggests a break above the mid resistance, heading toward the upper resistance (~1.13657).
2. A bearish projection: Indicates a potential drop toward the support zone before bouncing back up toward the upper resistance.
Volume:
Noticeable spike in volume during the drop before price stabilized near the support zone, suggesting strong selling pressure was absorbed.
Implications:
If the price breaks above the 1.13000 level with strong volume, it could signal a move toward the 1.13657 level.
A rejection from the mid resistance zone could lead to a retest of the lower support area before attempting another upward move.
Would you like a deeper technical analysis, or help planning trade entries/exits based on this chart?

Recovery or Just a Bull Trap? All Eyes on PCE This WeekNZDUSD – Recovery or Just a Bull Trap? All Eyes on PCE This Week
🌐 MACRO & FUNDAMENTAL OVERVIEW
After the FOMC’s decision to keep interest rates unchanged, the US Dollar has shown signs of recovery driven by expectations that core inflation remains persistent — especially ahead of the upcoming US Core PCE Price Index release this Friday.
On the New Zealand side, the Kiwi remains under pressure due to recent weak economic data and negative sentiment from China — its largest trading partner. The RBNZ continues to maintain a neutral stance, offering little support for the currency in the near term.
Market sentiment remains cautious as investors await the PCE data to determine inflation trends and potential Fed policy shifts.
📉 TECHNICAL ANALYSIS (H1–H2 TIMEFRAME)
NZDUSD is forming a technical rebound after a strong bearish leg from the 0.60300 region. Current price is trading around the 38.2%–50% Fibonacci retracement zone (0.5964–0.5976), struggling to break above EMA89 and EMA200 resistance.
Overall structure: Bearish bias remains intact with lower highs.
EMA alignment: EMA13, EMA34, and EMA89 are in bearish formation.
Key support zone: 0.5926–0.5940, trendline confluence + consolidation base.
🔑 KEY LEVELS TO WATCH
Resistance:
0.5976 – Fibonacci 0.5 retracement + previous rejection zone
0.5990 – Structural resistance of the week
0.6007 – 78.6% Fib + liquidity sweep potential
Support:
0.5940 – Trendline retest + short-term structure
0.5926 – Key demand zone with previous fake breakout
🎯 TRADE IDEAS
SELL SETUP – Fade the pullback into resistance:
Entry: 0.5976 – 0.5990
Stop Loss: 0.6010
Take Profit: 0.5940 → 0.5926
BUY SCALP – On strong bullish rejection from support:
Entry: 0.5926 – 0.5930
Stop Loss: 0.5900
Take Profit: 0.5960 → 0.5976
Note: Confirm with bullish candlestick and volume spike before entry.
⚠️ STRATEGY OUTLOOK
NZDUSD remains in a corrective phase. This week’s PCE inflation data will be critical. A hotter-than-expected reading could strengthen the USD and push NZDUSD below 0.5926, resuming the medium-term downtrend.
Avoid chasing mid-range price action. Focus on price reactions near the key resistance and support levels.

XAUUAD UPDATE 29 - 05 - 2025This chart is a 30-minute candlestick chart for CFDs on Gold (XAU/USD), published on TradingView. Here’s a detailed breakdown of what it shows:
---
Chart Analysis Details
1. Timeframe:
30-minute candlesticks, showing short-term price movements.
2. Price Levels:
Current price: Around 3,277.014 USD
Resistance zone (highlighted in yellow near the top): Around 3,299.476 USD
Support zone (highlighted in yellow near the bottom): Around 3,249.832 USD
3. Volume:
Volume bars at the bottom suggest increased activity leading up to and during the most recent upward movement.
4. Price Action:
There was a strong bullish move recovering from the support area near 3,250 USD.
Price reached a recent high near 3,285 USD and began to retrace slightly.
5. Forecast/Prediction (Illustrated by blue arrows):
The trader (Mr_Zakrii) anticipates a bearish reversal from the current region.
The blue arrows suggest a short position setup:
Entry near 3,285 USD
Target back toward the support area near 3,250 USD
Stop-loss near 3,299.476 USD
6. Risk-to-Reward Ratio:
The shaded red and green areas represent the stop-loss and take-profit zones respectively, indicating a favorable risk-to-reward setup (reward appears larger than the risk).
7. News Indicator:
There's a news icon (U.S. flag) indicating an upcoming news event that might affect the gold price volatility.
---
Conclusion:
This is a bearish setup based on a resistance rejection around 3,285–3,299 USD, aiming for a move back to the support zone near 3,250 USD. The chart suggests a sell position with a clear stop-loss and take-profit area, possibly relying on technical resistance and recent price action for confirmation.
Let me know if you want help evaluating the trade setup or analyzing the fundamental context behind it.

XAUUSD – Post-FOMC Trading Plan | Key Resistance: 3308 – 3310XAUUSD – Post-FOMC Trading Plan | Key Resistance: 3308 – 3310
📊 MACRO UPDATE – After the FOMC Decision:
The Fed kept interest rates unchanged as expected, but the tone remained hawkish. Chairman Powell reiterated that inflation remains too high and ruled out any near-term rate cuts, signaling prolonged restrictive policy.
This led to a swift rebound in the US Dollar and Treasury yields, weighing on gold. However, XAUUSD bounced back late in the session, suggesting the market is re-evaluating key technical zones post-announcement.
📉 TECHNICAL ANALYSIS – H1/H4 Chart Structure:
Gold remains in a corrective descending structure but is now reacting around key Fibonacci levels. The 13–34–89 EMAs provide dynamic support and resistance, and a potential double bottom has formed near the 3245–3247 zone.
🧠 Two key levels to watch:
3308–3310: major resistance with trendline + FVG confluence
3245–3247: strong horizontal support + Fib 0.618 retracement
🎯 TRADE SETUPS:
🔵 BUY ZONE: 3247 – 3245
Stop-Loss: 3241
Take-Profit: 3251 → 3255 → 3260 → 3264 → 3270 → 3275 → 3280
🔵 BUY SCALP: 3263 – 3261
Stop-Loss: 3257
Take-Profit: 3266 → 3270 → 3275 → 3280 → 3290 → 3300
🔴 SELL SCALP: 3294 – 3296
Stop-Loss: 3300
Take-Profit: 3290 → 3286 → 3282 → 3278 → 3274 → 3270 → 3260
🔴 SELL ZONE: 3308 – 3310
Stop-Loss: 3314
Take-Profit: 3304 → 3300 → 3296 → 3292 → 3288 → 3280
📌 STRATEGIC OUTLOOK:
Unless price breaks above 3310 with strong momentum, sellers are still in control short term. Any rejection from the resistance zone could offer clean short entries. A breakout, however, would shift sentiment and expose 3340–3360 next.
Patience is key — let price react before committing to entries.

GOLD - SELLING FROM PULLBACKPrice has shown a reaction from the low around 3,245 and is now approaching a strong confluence zone around the DAILY FLIP, which acted as prior support AND now resistance. This zone coincides with the upper boundary of the descending channel.
Bias: Bearish, unless price breaks above 3,305 with strong momentum and closes outside the descending channel.
TRADE IDEA:
SELL from 3,295–3,300 (wait for bearish confirmation)
once activated, I will update SL and TP
Let me know what your opinion.
