GOLD - WAITING FOR BREAK OUTOverall Price is still bearish, however, we may get short term buy opportunity as well.
Trade idea 1: SELL below 3207
Trade idea 2: BUY above 3225
Please note these trade ideas are for 100-200 pips target only.
Once trade is activated, I will update SL too.
Share your opinion below, Thank you.
Analysis

USDCHF Will the Downtrend Break or Bounce? Full Trade Plan TodayUSDCHF – Will the Downtrend Break or Bounce? | Full Trade Plan Today 🔥
🌍 Macro Overview
USDCHF remains in a short-term bearish correction, reflecting current macroeconomic uncertainties surrounding US interest rate expectations and safe-haven demand for CHF.
USD is under pressure after softer-than-expected CPI and PPI data last week, increasing speculation that the Fed may cut rates in Q3.
CHF continues to benefit from its safe-haven status amid ongoing geopolitical uncertainty and fragile European growth.
However, the key support around 0.8318 has acted as a major demand zone. If bulls react strongly here, we could see a technical rebound in the short term.
📉 Technical Analysis (H1–H2)
USDCHF is trading within a descending channel, showing lower highs and lower lows.
Price is now testing the lower boundary of the channel around 0.8318, which also aligns with a key liquidity area.
EMAs (13 and 34) still slope downward, but momentum is slowing — a possible signal that sellers are losing strength.
🔑 Key Levels to Watch
🔺 Resistance Zones:
0.8395 → Recent swing high & supply zone
0.8459 → Medium-term structural resistance
🔻 Support Zones:
0.8318 → Major confluence zone (channel bottom + demand block)
0.8230 → Final support level before deeper drop
🎯 Trade Setups
✅ Scenario A – Bullish Reversal from Support (Preferred):
Entry (Buy): 0.8318 – 0.8322 (after bullish rejection confirmation)
Stop Loss: 0.8288
Take Profits: 0.8395 → 0.8430 → 0.8459
✅ Scenario B – Bearish Breakdown Below Support:
Entry (Sell): 0.8300 – 0.8310 (only if price closes below 0.8310 on H2)
Stop Loss: 0.8340
Take Profits: 0.8260 → 0.8230 → 0.8200
⚠️ What to Watch Today:
Market may see higher volatility during the US session, especially with housing data (Existing Home Sales) and Fed speakers lined up.
Watch for clean price action around 0.8318 — no need to rush entries until confirmation appears.
This is a reactive market, not a predictive one. Let price speak first.
📌 Follow for real-time market updates and actionable strategies during US trading hours.

GBP/USD Retracement or Reversal? Stay Sharp as Momentum FadesGBP/USD Trading Plan – May 20th | Retracement or Reversal? Stay Sharp as Momentum Fades
🌐 Macro Overview
GBP/USD is currently influenced by several macroeconomic forces:
USD strength is returning, supported by stable US data (Retail Sales, Jobless Claims), leading the market to delay expectations of a Fed rate cut.
The British Pound is under pressure as the Bank of England (BoE) is not expected to raise rates further amid slowing domestic growth and easing inflation.
Simultaneously, US-China trade tensions and US debt concerns are keeping market sentiment cautious. The pair is forming a bullish flag structure, but signs of exhaustion are emerging.
📉 Technical Analysis (2H Chart)
GBP/USD is moving within a rising channel. However:
1.3433 remains a strong resistance, aligning with a local top — breakout potential is limited in the short term.
A rising wedge pattern is forming — watch for a potential trap followed by a sharp sell-off.
EMA13 and EMA34 are diverging, signaling distribution and potential reversal ahead.
🔑 Key Levels to Watch
Major Resistance:
🔺 1.3433 – recent swing high and potential double top
🔺 1.3355 – mid-range resistance and EMA34 convergence (H2)
Key Support:
🔻 1.3303 – key FIBO + trendline intersection
🔻 1.3251 – medium-term bullish structure support
🔻 1.3174 – previous swing low and strategic BUY ZONE
🎯 Trading Scenarios
📍 Scenario A – False Break and Rejection from Resistance
Entry (SELL): 1.3430 – 1.3433 (after bearish confirmation)
Stop Loss: 1.3460
Take Profits: 1.3355 → 1.3303 → 1.3250
📍 Scenario B – Breakdown and Failed Retest
Entry (SELL): 1.3303 – 1.3310 (after support break and retest)
Stop Loss: 1.3340
Take Profits: 1.3251 → 1.3174
📍 Scenario C – Deep Buy from Strong Support
Entry (BUY): 1.3170 – 1.3174
Stop Loss: 1.3140
Take Profits: 1.3251 → 1.3300
⚠️ Key Reminders:
Stay cautious ahead of key US releases this week (PMI, FOMC Minutes), which may trigger high volatility.
Avoid FOMO and respect SL/TP discipline — especially near potential trap zones.
📌 Follow for intraday updates and real-time trade setups as the structure evolves. Flexibility is key in this market.

Gold Price Market in a Sideways Phase Awaiting BreakoutGold Price Drops Amid Hawkish Fed Comments - Market in a Sideways Phase Awaiting Breakout
Gold (XAU/USD) has experienced a sharp drop following recent hawkish comments from the Federal Reserve. The continuation of tight monetary policy has unsettled investors, leading to strong sell-offs during both the Asian and US trading sessions today.
📊 Technical Analysis:
Currently, gold is forming a new sideways range, and if you zoom out to higher timeframes, you'll notice a classic bearish flag pattern developing. This suggests that gold is in a period of consolidation before a potential large-scale breakout. While the upward momentum from both the Asian and European sessions was strong, gold failed to break the critical 3250–3255 zone. This area remains vital for determining the next direction in gold's price action.
Should the bearish trend continue, if we break the support trendline below the current price, the likelihood of the bearish flag pattern playing out rises to around 80%. This could lead to further price corrections.
Key Levels to Watch:
Support Levels: 3205, 3194, 3280, 3262
Resistance Levels: 3244, 3262, 3278, 3286
📈 Trading Strategy:
BUY SCALP:
Entry: 3294 - 3292
Stop Loss (SL): 3288
Take Profit (TP): 3298 → 3302 → 3306 → 3310 → 3315 → 3320 → 3330
BUY ZONE:
Entry: 3272 - 3270
SL: 3266
TP: 3276 → 3280 → 3284 → 3288 → 3292 → 3296 → 3330
SELL SCALP:
Entry: 3242 - 3244
SL: 3248
TP: 3238 → 3234 → 3230 → 3226 → 3220 → 3210
SELL SCALP:
Entry: 3276 - 3278
SL: 3282
TP: 3272 → 3268 → 3264 → 3260 → 3250 → 3240
⚠️ Risk Management:
As we approach the close of the week, the volatility in gold could intensify, especially with the Fed’s actions, market sentiment, and geopolitical developments. Always follow your TP/SL to safeguard your investments and avoid unnecessary risk.
🧠 Final Thoughts:
The market is in a consolidation phase, and it's essential to wait for confirmation before taking significant positions. If gold fails to break the 3250–3255 resistance zone, the chances of a more significant move downwards increase. However, be cautious, as the market is volatile, and things can shift rapidly.

ETHUSDT pair has formed a set of Equal Highs!Currently, the ETHUSDT pair has formed a set of Equal Highs (EQ Highs) on the chart, indicating the presence of potential liquidity resting above that level. At the same time, there’s some price structure visible on the lower side, suggesting that the market may have created liquidity pools both above and below the current price range. This kind of setup often precedes a significant move.
Recently, the market executed what appears to be a 'Turtle Soup' pattern — a common liquidity grab strategy in which price breaks below a key support or above resistance to trap breakout traders, only to quickly reverse and pump in the opposite direction. Following this pattern, ETHUSDT saw a sharp upward movement, indicating that smart money may have manipulated liquidity to fuel this breakout.
Now , patience is essential. The market has created a visible trendline, and typically, such trendlines attract retail traders who treat them as dynamic support or resistance. However, what often happens is that liquidity builds up around these trendlines, and institutional players later push the price through them to trigger stop-losses or induce panic. It’s likely the market will take out (or 'kill') the liquidity lying along that trendline.
After that liquidity sweep, we’re watching for price to move into a marked Fair Value Gap (FVG) — an imbalance left by a strong move where price didn’t fully fill in. Once the price taps into that FVG, we need to wait for additional confirmation. Ideally, we’d like to see a Market Structure Shift (MSS) or a Change of Character (CHoCH), both of which are strong indicators that the trend may be reversing or forming.
Only after those confirmations should we start considering entering a long position. We can further validate the setup using refined models such as the Unicorn Model, or other entry confirmations like a refined FVG entry, a bullish order block (OB), or breaker block. The goal is to enter the trade when there is a high-probability confluence of signals, not just based on a single indicator.
Once a solid entry setup is confirmed, our targets can be the Equal Highs formed earlier, as they represent resting liquidity which price often seeks. However, it’s crucial not to blindly follow the setup. Observe how the market reacts at each critical level, manage risk properly, and most importantly DYOR (Do Your Own Research) before making any trading decision.

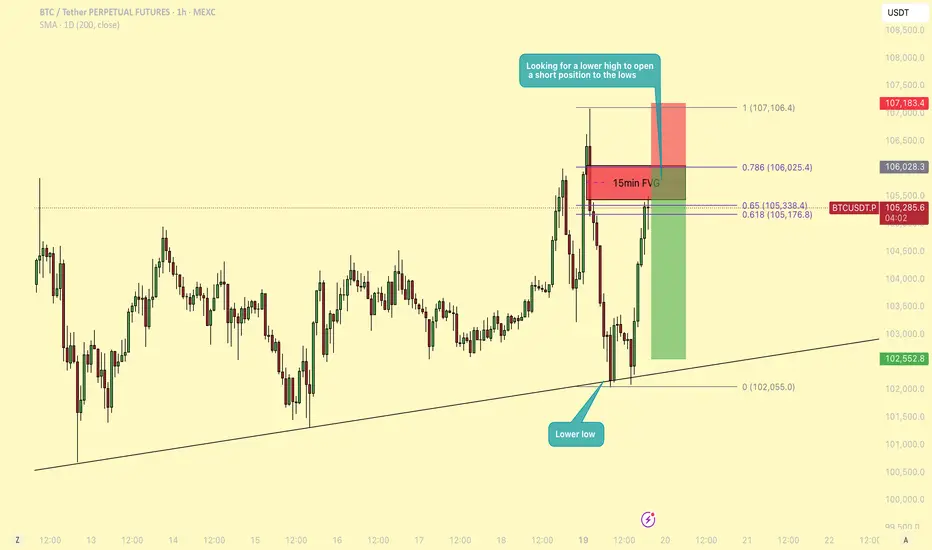
BTC - Will BTC revisit $102k or is a pump imminent?Bitcoin (BTC) has been in a consolidation phase for an extended period, marked by a lack of strong directional momentum and characterized by ranging price action. This type of market environment often leads to both liquidity grabs and choppy movement, and traders need to remain especially vigilant about key levels and structure shifts.
Liquidity grab
Yesterday, BTC managed to sweep the recent highs, grabbing liquidity above a short-term resistance zone before reversing and moving lower. This move appears to have been a classic stop-hunt or liquidity sweep, which was followed by a strong rejection. As price moved down from those highs, it left behind an unfilled gap on the 15-minute chart, what many refer to as a Fair Value Gap (FVG). This gap now acts as a magnet for price and is a key area to watch as we approach it again.
Market structure
On the 1-hour timeframe, BTC has now printed a lower low, suggesting a short-term shift in market structure to the downside. This structural break opens up the possibility for a lower high to form, setting up a classic trend continuation scenario. From a technical standpoint, the expectation would be for BTC to now create a lower high and then push lower, potentially targeting the range lows from yesterday and today. This provides an opportunity for a short setup with a favorable risk-to-reward (RR) ratio, estimated to be around 3:1, if the entry and stop are managed around the key resistance and structural levels.
Fibonaccy that aligns with the FVG
Currently, BTC is sitting at the Golden Pocket, the region between the 0.618 and 0.65 Fibonacci retracement levels. This area often serves as a reaction zone for price, and we are seeing some hesitation here. Interestingly, this Golden Pocket sits just below the aforementioned 15-minute FVG, and price appears to be gravitating toward this inefficiency, potentially looking to fill it before making a more decisive move.
What adds to the confluence at this level is the 0.786 Fibonacci retracement, which aligns almost perfectly with the top boundary of the Fair Value Gap. While many traders look to enter short positions at the 50% mark of the FVG, this added confluence makes the 0.786 + FVG top zone a more compelling entry point. This would allow for a tighter stop just above the gap or structure high, and thus improves the risk-to-reward ratio slightly compared to a more conservative FVG entry.
Conclusion
In summary, the plan would be to wait for BTC to either fill the FVG and reach the 0.786 level or show strong rejection signs there. A rejection from this zone would confirm the lower high thesis and offer a solid short setup aiming for a move back to the range low. With the current setup, market structure, and confluence levels lining up, this trade idea presents a tactical opportunity with clear invalidation and high RR potential.
Fundamental Market Analysis for May 20, 2025 EURUSDEURUSD:
EUR/USD tested high levels on Monday, briefly rising to 1.1300, but then retreated slightly, although the day ended higher overall. Nevertheless, the pair remains in a short-term consolidation zone.
Last Friday, rating agency Moody's downgraded the United States (US), stripping it of its latest AAA rating on Treasuries, citing the growing US debt and long-standing government budget deficits that various presidential administrations have either neglected or failed to manage effectively. While initial investor reaction was shaky, sentiment quickly stabilised and the impact on US creditworthiness was largely written off. Still, Treasury markets are struggling: On Monday, 30-year bond yields topped 5 per cent and 10-year yields topped 4.5 per cent.
Federal Reserve (Fed) officials have been working hard this week to manage market expectations for a possible rate cut. Fed policymakers have continually reminded investors that ongoing U.S. tariff and trade policies complicate the outlook for the national economy, which in turn affects rate adjustments.
Thursday will see the release of German and pan-European purchasing managers' index (PMI) reports from HCOB, providing a double dose of business expectations surveys on both sides of the Pacific. Both the German and pan-European PMIs are expected to rise moderately. The key economic data release from the US will be the S&P Global PMI data for May, where average market expectations suggest a slight decline in both the manufacturing and service components of the PMI report due to the impact of tariffs on business spending.
Trading recommendation: BUY 1.1250, SL 1.1230, TP 1.1350

Euro can continue to decline in channel to buyer zoneHello traders, I want share with you my opinion about Euro. Earlier, the Euro formed a symmetrical triangle, where the price squeezed between resistance and support lines before breaking out with a strong impulse move. After this breakout, the pair quickly climbed toward the 1.1420 - 1.1455 resistance area, a major seller zone, but failed to hold above it. Since then, the price structure shifted into a well-defined downward channel. Within this channel, we’ve seen repeated rejections from the upper boundary and controlled declines toward the support line. Recently, EUR rebounded again from the resistance line, confirming that sellers remain in control. Now the price is heading lower once more. Given this repeated rejection and the prevailing bearish structure, I expect the decline to continue toward the next key area, the 1.1070 - 1.1035 buyer zone. This level aligns with the channel’s support and has acted as a reaction zone in the past. That’s why I set my TP at 1.1035, the bottom of the buyer zone and a logical target within this bearish setup. Please share this idea with your friends and click Boost 🚀
Disclaimer: As part of ThinkMarkets’ Influencer Program, I am sponsored to share and publish their charts in my analysis.

EUR/USD DAILY PLAN – BREAKOUT CONFIRMATION OR FAKEOUT TRAP?EUR/USD DAILY PLAN – BREAKOUT CONFIRMATION OR FAKEOUT TRAP?
🧠 Macro Overview
This week’s trading landscape is influenced by both European and U.S. developments:
EU Side: There are no major macroeconomic releases ahead, but expectations are growing that the ECB may adopt a more dovish tone in upcoming meetings. If inflation continues to cool, the euro may face downside pressure.
U.S. Side: Last week’s CPI and PPI data showed signs of cooling inflation, yet not enough for the Fed to shift gears. The U.S. dollar remains supported by the prospect of “higher for longer” interest rates.
Global Sentiment: Ongoing U.S.–China tensions and trade policy updates in Europe are keeping risk appetite cautious. The EUR/USD pair is testing a key zone and may break out of the descending channel soon — or reject hard if buyers fail to hold.
📊 Technical Analysis (H1 Chart)
EUR/USD bounced strongly from the 1.1160 – 1.1180 demand zone and is now testing the key resistance at 1.1237 — a confluence of descending trendline and the 200 EMA on the 1H chart.
A clean breakout above and sustained hold of 1.1237 could pave the way toward higher resistance levels at 1.1270 and 1.1325.
However, if the pair gets rejected at 1.1237, it may fall back to test the lower support at 1.1160 – 1.1180, possibly forming a range before a larger move.
📌 Key Levels to Watch
🔺 Resistance Levels:
1.1237 → Key confluence zone (EMA200 + trendline)
1.1270 → Previous swing high
1.1302 – 1.1325 → Upper resistance zone with Fibo confluence
🔻 Support Levels:
1.1180 → Immediate demand area
1.1160 → Critical trendline support
A break below 1.1160 could trigger stronger bearish momentum
🎯 Trading Scenarios
1. Bullish Breakout Above 1.1237
🔹 Entry: 1.1240 – 1.1250
🔹 SL: 1.1210
🔹 TP: 1.1270 → 1.1302 → 1.1325
2. Bearish Rejection at 1.1237
🔻 Entry: 1.1230 – 1.1225
🔻 SL: 1.1255
🔻 TP: 1.1180 → 1.1160
3. Buy-the-Dip at Key Support
🔹 Entry: 1.1165 – 1.1170
🔹 SL: 1.1135
🔹 TP: 1.1200 → 1.1230
⚠️ Key Notes:
Avoid entering trades during chop between 1.1215 – 1.1237 unless breakout confirmation appears.
Be cautious of liquidity grabs during London and NY session opens.
Stick to tight risk management as market remains uncertain and range-bound.
📌 Conclusion:
EUR/USD is at a decision point. Whether bulls take control or sellers defend key resistance will determine short-term trend direction. Trade the breakout or the reaction — not the prediction.

GBP/CAD - Triangle Breakout (19.05.2025)The GBP/CAD pair on the M30 timeframe presents a Potential Buying Opportunity due to a recent Formation of a Triangle Pattern. This suggests a shift in momentum towards the upside and a higher likelihood of further advances in the coming hours.
Possible Long Trade:
Entry: Consider Entering A Long Position around Trendline Of The Pattern.
Target Levels:
1st Resistance – 1.8651
2nd Resistance – 1.8685
🎁 Please hit the like button and
🎁 Leave a comment to support for My Post !
Your likes and comments are incredibly motivating and will encourage me to share more analysis with you.
Best Regards, KABHI_TA_TRADING
Thank you.
Disclosure: I am part of Trade Nation's Influencer program and receive a monthly fee for using their TradingView charts in my analysis.

GBP/USD - Triangle Breakout (16.05.2025)The GBP/USD pair on the M30 timeframe presents a Potential Buying Opportunity due to a recent Formation of a Triangle Breakout Pattern. This suggests a shift in momentum towards the upside and a higher likelihood of further advances in the coming hours.
Possible Long Trade:
Entry: Consider Entering A Long Position around Trendline Of The Pattern.
Target Levels:
1st Resistance – 1.3389
2nd Resistance – 1.3441
🎁 Please hit the like button and
🎁 Leave a comment to support for My Post !
Your likes and comments are incredibly motivating and will encourage me to share more analysis with you.
Best Regards, KABHI_TA_TRADING
Thank you.

Gold Price Surge Will This Be the Catalyst for the Next Breakout💥 Gold Price Surge: Will This Be the Catalyst for the Next Breakout? | Trading Plan for Today 📊
📊 Market Overview:
✔️ Gold (XAU/USD) has shown a strong recovery following significant geopolitical and economic developments over the weekend. Key factors driving this rally include:
✔️ Putin’s Rejection of Peace Talks: If the conflict intensifies, we may see a surge in demand for safe-haven assets like gold.
✔️ US Credit Downgrade: Rising concerns over US debt and bond yields could drive more investors back into gold.
✔️ Trump’s Tariff Threat: Although less aggressive than before, Trump’s volatility still poses risks to market stability, with gold remaining a key hedge.
✔️ These combined factors have driven a gap up of over 20 points during the early Asia session. Should these issues remain unresolved, gold could be set for a strong move back toward its previous All-Time High (ATH).
📉 Technical Analysis:
✔️ The chart is showing an increasingly bullish setup. EMA 13 has crossed above both EMA 34 and EMA 200 on the M30 chart, suggesting that the market is primed for a breakout.
✔️ We’re seeing the potential for a $100–$200 rally per ounce, should the bullish momentum persist.
✔️ Given the current market volatility, geopolitical events could cause sharp price movements. A breakout of the current trendline may indicate that we are witnessing a retest before the next significant surge.
🔑 Key Levels to Watch:
🔻 Support Levels: 3204, 3193, 3186, 3174, 3163
🔺 Resistance Levels: 3254, 3277, 3288
💰 Trading Strategy for Today:
✅ BUY Scalp: 3194 – 3196
🔴 Stop-Loss (SL): 3190
✅ Take-Profit (TP): 3200 → 3210 → 3220 → 3230
✅ BUY Zone: 3186 – 3184
🔴 Stop-Loss (SL): 3180
✅ Take-Profit (TP): 3190 → 3195 → 3200 → 3210 → 3220 → 3230
✔️ SELL Zone: 3287 – 3289
🔴 Stop-Loss (SL): 3293
✅ Take-Profit (TP): 3285 → 3280 → 3285 → 3280 → 3270
💎 Good Luck! Stay tuned for more updates, and trade wisely! 📈

btc . w4 . may . wOpen . LONGto catch everyone of guard, whom thinks we're crashing today:
. LONG: look for good tpo at nyOpen, of running aLow and pump to liquidate and grab liquidity
. SHORT: still on the table - but the LONG could be a runner

btc . w4 . may . wOpen . SHORTideally :
. good tpo and price not finding a floor during ny
SHORT
. ladder limits
. start pw.0.5
. end pwVAH - pdEQ
. withhold 30% of total order to add upon trade confirmation
. tp1 +1.5%
. tp 2 . mOpen . 94133.6 + 9%
- ride the momentum shift downwards

Don't trade Aussie this week!Dear traders,
Among the top 8 forex market currencies, tariffs war affects the Aussie most, because Australia is highly dependent on China.
Rank Trading Partner Exports (A$ million)
1 China 185,141
2 Japan 119,889
3 European Union 31,816
4 United States 30,690
Uncertainty about China's future means, fluctuations in Aussie. I don't trade AUDUSD this week,
only if everything goes well with negotiations between Trump and China, I might use confirmed break over zone of 0.64355 to take long trades.
Regards, Ali

NZDJPY Long: Fib 0.786 Retest + Strong NZD Momentum🔹 Pair: NZD/JPY
🔹 Timeframe: Daily
🔹 Direction: Long
🔹 Status: Price holding Fib 0.786 retracement level (bullish structure intact)
🔹 Entry Zone: ~85.50–85.60 (Live entry)
📊 Fundamental Confluence
🇳🇿 NZD – Bullish Momentum
Conditional Score Jump: 🚀 From 8 → 13 (Strongest improvement this week).
Seasonality: 🔼 Strong seasonal bias from mid-May onward.
CB Stance: Hawkish — RBNZ cautious but maintains restrictive policy.
Global Risk-On: VIX < 20 supports high-beta currencies like NZD.
🇯🇵 JPY – Weakening
BoJ Outlook: Delayed inflation target to 2027 = no urgency to tighten.
Score Flat: Minor improvement (11 → 12), not enough to change bias.
Risk Sentiment: Safe-haven demand dropping, weakening JPY.
Macro Drag: Japan underperforming vs G7 counterparts.

XAUUSD GOLD Just Grabbed liquidity Below a key low analysis Full Guide: How to Use COT Data for Trading XAUUSD (Gold)
1. What is COT Data?
The Commitment of Traders (COT) report is a weekly publication by the Commodity Futures Trading Commission (CFTC). It shows the aggregate positioning of different types of traders in the futures markets.
For XAUUSD (Gold), you’ll look at the Gold futures (COMEX) section.
2. Key Trader Categories in COT Report
1. Commercials (Hedgers):
Typically big institutions or producers like mining companies.
They use futures to hedge exposure, not speculate.
Usually short during rallies and long when price is low.
2. Non-Commercials (Large Speculators):
Hedge funds, money managers.
Considered the "smart money." Full Guide: How to Use COT Data for Trading XAUUSD (Gold)
1. What is COT Data?
The Commitment of Traders (COT) report is a weekly publication by the Commodity Futures Trading Commission (CFTC). It shows the aggregate positioning of different types of traders in the futures markets.
For XAUUSD (Gold), you’ll look at the Gold futures (COMEX) section.
---
2. Key Trader Categories in COT Report
1. Commercials (Hedgers):
Typically big institutions or producers like mining companies.
They use futures to hedge exposure, not speculate.
Usually short during rallies and long when price is low.
2. Non-Commercials (Large Speculators):
Hedge funds, money managers.
Considered the "smart money."
Follow trends and often drive major moves.
3. Nonreportables (Retail/Small Traders):
Smaller traders, often contrarian indicators.
Not always consistent with price direction.
---
3. Where to Find COT Data
CFTC Website
Tools like:
Tradingster.com
BarChart.com
COTbase.com
Look for "Legacy" or "Disaggregated" COT reports for Gold - COMEX.
---
4. How to Read the COT Data for Gold
Key Metrics:
Longs/Shorts: Number of contracts held.
Net Positions: Longs minus Shorts.Changes WoW: Increase/decrease in positions compared to the prior week.
Example Insight:
If Non-Commercials are heavily net long, and reaching historical highs, market may be overbought.
If Commercials increase shorts significantly, they may be preparing for a price decline.
A divergence between price action and COT data often signals potential reversal.
---
5. Using COT for Gold Trading (XAUUSD)A. Trend Confirmation
Rising net long positions by non-commercials = bullish confirmation.
Decreasing net long or rising shorts = weakening trend or reversal.
B. Reversal Spotting
Extremes in positioning (e.g., record longs by speculators) often precede reversals.
Look for non-commercials reducing longs while commercials increase shorts—potential top.
C. Liquidity Grabs and COT
If gold grabs liquidity (stop hunts) and COT shows heavy speculative positioning, that could be a smart money trap.
A strong bullish reversal after liquidity grab with increasing net longs confirms a momentum shift.
---
6. How to Combine COT with Technical Analysis
Use COT to validate or question what you see on the chart.
Example Setup:
Chart: Gold drops below key support (liquidity grab).
COT: Non-commercials increase longs that week.
Conclusion: Smart money bought the dip — potential for bullish reversal.
Combine with:
Market structure
Volume
Sentiment tools
Price action (e.g., bullish engulfing, break of structure)
---
7. Limitations and Tips
Lagging Data: COT is released every Friday for data on Tuesday.
Use it for context and macro positioning, not for intraday trades.
Look at weekly or monthly trends, not daily.
Best used alongside price action and other confirmation signals.
---
Conclusion
COT data is a powerful tool for understanding who is behind the move in gold. By tracking the positioning of major players, you can:
Confirm trends
Spot early signs of reversal
Align your trades with institutional momentum

btc . recap . w3 . maymon to eager . wait mon to show its hand - cw!
. early LONG compound because of the bullish outlook
- tp2 108462
tue didn't ride momentum - blind bullish
. tp1 HIT
. missed SHORT at 10pm (UTC+2)
- should have traded the momentum of mon looking to form support during the week later . for more compound LONG
wed mid of range . cw
. no trade zone
thu
. waiting for run of aLow during ny
. compound LONG - 101485
. tp1 HIT
fri didnt catch enough upward momentum
. tp1 HIT
. last limit order for bullish continuation . tpo - 102862.5
wknd
. tp1 for weekly LONG idea finally hit
. duration 5d 22h
. +4.33%
conclusion :
trade what you see, go with momentum, but have a narrative.
outlook :
america downgraded from AAA to AA+ . People will turn hardcore bearish, once the price starts falling. this could be the trigger to find the long awaited drop - while having retail call out a bearmarket . massive potential here, to both sides. wOpen and monday full data (while keeping an close eye on tpo and footprint charts), are key .

SWDY Trend AnaylsisSWDY stock is in a downward trend. In case of falling, it's expected to break the first support line at 78.025 points, till it reaches the second support line at 76.249 points. In case of rising, it's expected to reach the first support line 78.687, the second support line 78.928, and the third support line at 79.019, which is highly anticipated due to its latest acquisition.

XAU/USD Pivot area with possibe Bullish move.Currently Gold is at a Pivotal area between 3153.46 and 3109.10 , this area holds a pivot turning point fot Gold next move , where we could head towards 3280 and 3407 for upward targets.
However failure to hold this area could send the price towards 2981.86 and 2855 for bearish Targets.

Hims is OVERBOUGHT Market Context ✨
NYSE:HIMS | Current Price: $42.00
1-Month Move: +17.5% (from $35.75)
1-Year Move: +68.2% (from $25.00)
Year High/Low: $43.50/$24.80
Technicals
RSI: ~75.8 (overbought )
Moving Averages: Above 20-day, 50-day, and 200-day MAs (strong uptrend, but overextended )
MACD: Bearish divergence forming (momentum fading, potential reversal )
Trade Setup
Direction: PUT
Entry Price: $42.00
Take Profit 1 (TP1): $36.00 (~14.3% gain )
Take Profit 2 (TP2): $30.00 (~28.6% gain )
Expected Move: ~12–15% downward
Best AI Signals on the market

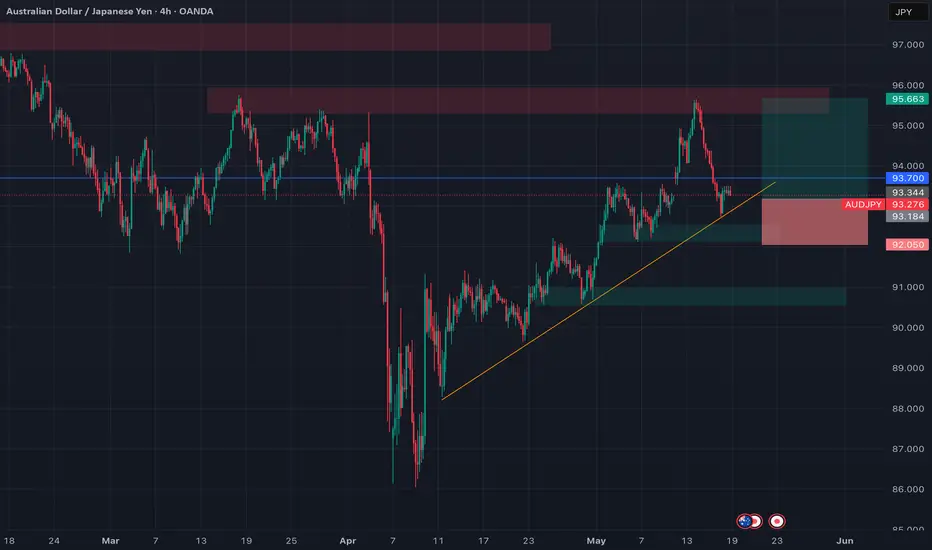
AUDJPY Long: Buy the Dip into Trendline + Seasonal AUD Surge🔹 Pair: AUD/JPY
🔹 Timeframe: 4H
🔹 Direction: Long
🔹 Status: Retesting Trendline Support
🔹 Entry Zone: 93.20–93.40 (Live Entry Area)
⸻
📊 Macro & Fundamental Confluence
🇦🇺 AUD – Bullish
• Strong Seasonality: Historically bullish May 19 – June 10.
• Conditional Score Rise: From 21 → 24 = Positive momentum shift.
• Dovish CB, But Risk-On: Supports carry trade flows into AUD.
• Macro View: Rebalancing inflation & trend recovery, AUD outperforming.
🇯🇵 JPY – Bearish
• BoJ Hawkish Talk, Dovish Action: Delayed inflation targets (to 2027).
• Score Flat: Minor rise (11 → 12), showing underperformance.
• Risk-On Mood: With VIX under 20, safe-haven demand fading.
• Macro Lag: JPY weakest G7 performer year-to-date.
🧠 Confluences Supporting the Trade
✅ Seasonal AUD strength
✅ Fundamental divergence: AUD strong, JPY weak
✅ Risk-on regime (favoring carry trades like AUDJPY)
✅ Trendline respected since April (bullish market structure)
✅ Support zone at 93.00–93.30 area
⸻
📈 Technical Setup
• Entry Zone: 93.20–93.40
• Stop Loss: 92.08 (below structure and ascending trendline)
• Take Profit:
• TP1: 95.40 (resistance zone)
• TP2: 96.00 (supply zone retest)
• Risk:Reward: ~1.8 – 2.2 depending on final entry
📌 Execution Notes
Watching for candle closure confirmation above 93.50.
Break below 92.08 invalidates the bullish bias.
This setup combines macro divergence, seasonal strength, and clean 4H market structure.
⸻
💬 Are you trading AUDJPY this week?
Drop your thoughts below ⬇️
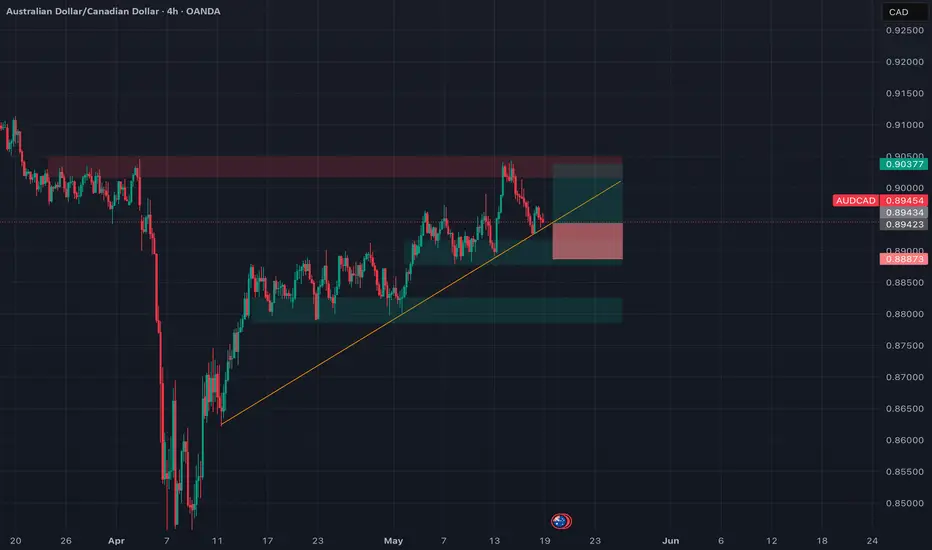
AUDCAD Long: Riding Aussie Strength vs Weak Loonie 🔹 Pair: AUD/CAD
🔹 Timeframe: 4H
🔹 Direction: Long
🔹 Strategy: Trend Continuation + Macro Confluence
🔹 Trade Active: 📍 0.8945 (CMP)
📊 Fundamental Bias
🇦🇺 AUD – Bullish
• Seasonal Surge: Historically strong from May 19 to June 10.
• Conditional Score Gain: AUD rose from 21 → 24 (momentum improving).
• Macro View: Inflation stabilizing, dovish stance offset by improving sentiment.
• VIX < 20: Risk-on conditions favor AUD.
🇨🇦 CAD – Bearish
• Flat Conditional Score: No improvement (2 → 2).
• Hawkish CB but Weak Data: CPI softening, trade risks persist.
• Global Sentiment: Oil stagnation + cautious BoC tone = headwinds for CAD.
⸻
🧠 Confluence Summary
✅ AUD macro + seasonal strength
✅ CAD remains fundamentally weak
✅ Risk-on supports commodity currencies
✅ 4H trendline support holding
⸻
🖼️ Technical Setup
• Entry: 0.8945
• Stop Loss: 0.8890 (below ascending trendline + support zone)
• Take Profit: 0.9036 (prior resistance + TP1)
• Risk:Reward: ~1.67
🟠 Optional Target: 0.9045 for extended move.
📌 Outlook
I’m bullish on AUDCAD for the week of May 19–23, supported by:
• Seasonal patterns
• Risk tone
• CAD stagnation
• Clear trend structure
Will look to trail SL as price closes above 0.8975. Clean invalidation below 0.8890.
⸻
💬 What’s your bias on AUD this week?
Drop a comment & let’s discuss 📉📈