EURCAD Bearish Breakdown – More Downside Potential Ahead?# EURCAD Bearish Breakdown – More Downside Potential Ahead?
**Analysis:**
EURCAD has broken below a key support level at **1.5710**, which previously acted as a consolidation base. This breakdown could signal the start of a deeper bearish move.
The market structure is clearly shifting to the downside, with **lower highs and lower lows** forming. If bearish momentum continues, the price could drop toward the psychological zones around **1.5000** and potentially **1.4500**.
---
**Key Technical Highlights:**
- **Breakdown level:** 1.5710 (former support)
- **Structure:** Bearish
- **Target zone:** 1.5000 – 1.4500
- **Invalidation:** Bullish recovery above 1.5710
---
**Trade Idea (Not Financial Advice):**
Watch for retests below 1.5710 to confirm bearish continuation. Short positions may be considered with proper risk management.
---
> **Disclaimer:**
> This analysis is for educational and informational purposes only and does not constitute financial advice. Always do your own research before making trading decisions. Trading involves risk, and past performance is not indicative of future results.
Analysis

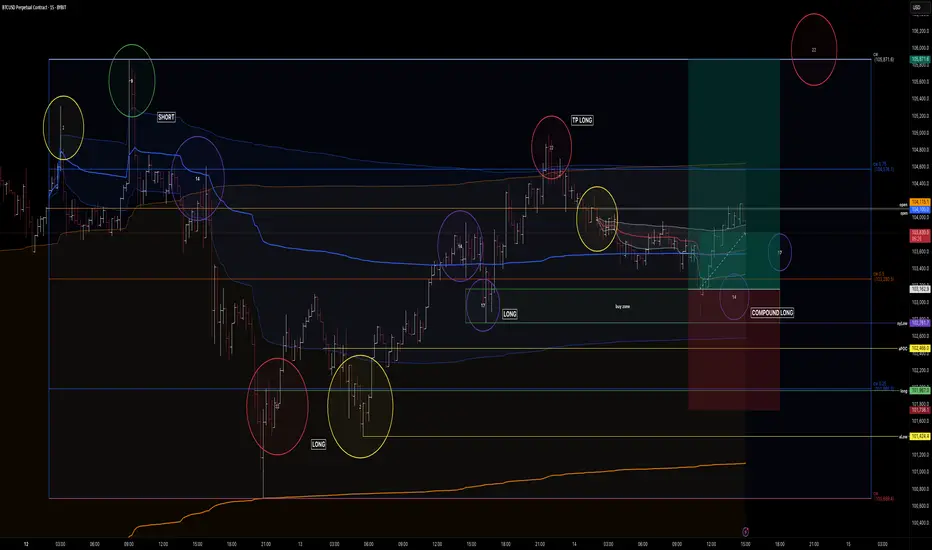
btc . wednesday . may . w3yesterday
. no LONG - only at bigger retracement - didnt come
. no SHORT - as 10pm (UTC+2) has recently been a little unpredictable
today - wednesday - LIQUIDITY + VOLATILITY ?!
. no SHORT - as we are nowhere price opportunity wise + BULLISH outlook
. yes COMPOUND LONG . I had wanted to see the drop towards 2pm (UTC+2) - run yesterdays NewYork low and push up . didnt happen, but as I was waiting for the level, I had limit orders prepared of which 4 triggered during LondonSession
. additional little compound now prepared at 103622 - LPOC + VWAP
- bullish continuation . price is consolidating and momentum of this week is turning to the upside
- bearish continuation . see a rejection here at dOpen + wOpen . have price loose its cwLow . catch everyone of guard (unlikely by the outlook, but neverless)
TA on WTI Oil - 2025.05.14Quick technical analysis on WTI oil.
Let us know what you think in the comments below.
Thank you.
77.3% of retail investor accounts lose money when trading CFDs with this provider. You should consider whether you understand how CFDs work and whether you can afford to take the high risk of losing your money. Past performance is not necessarily indicative of future results. The value of investments may fall as well as rise and the investor may not get back the amount initially invested. This content is not intended for nor applicable to residents of the UK. Cryptocurrency CFDs and spread bets are restricted in the UK for all retail clients.

GOLD XAU-USD CORRECTION COMPLETE REALLY TOWARD UP $3400 0PEN XAUUSD continues to trade within a clearly defined bullish channel, showing strong adherence to upward trendlines and key support levels. Recent price action confirms the ongoing strength of bullish momentum, with higher highs and higher lows reinforcing the prevailing trend. Technical indicators, including moving averages and RSI, remain aligned with buyers, while macroeconomic factors such as inflation concerns and global risk sentiment further support the upside narrative. As the precious metal steadily advances, the $3400 level emerges as a key psychological and technical target, suggesting that, barring significant shifts in market dynamics, gold may continue its trajectory towards new highs in the medium term."

Fundamental Market Analysis for May 14, 2025 USDJPYUSDJPY:
The Japanese Yen (JPY) continues to strengthen against its US counterpart for the second consecutive day on Wednesday and reacted weakly to the Producer Price Index (PPI), which was largely unchanged. Aggressive comments from Bank of Japan (BoJ) Deputy Governor Shin'ichi Uchida on Tuesday keep the door open for further policy normalisation and continue to serve as a tailwind for the Japanese Yen. The US Dollar (USD), on the other hand, continues to be threatened by weaker US consumer inflation data released on Tuesday, which raised the odds that the Federal Reserve (Fed) will cut interest rates at least twice this year. This is seen as another factor putting downward pressure on the USD/JPY pair.
Meanwhile, optimism about a 90-day tariff truce between the US and China continues to keep the market upbeat. This may deter traders from aggressively bullish bets on the safe-haven yen. Nevertheless, the diverging policy expectations between the BoJ and the Fed indicate that the path of least resistance for the low-yielding Yen lies to the upside and support the prospects of further downside for the USD/JPY pair. In the absence of any market-relevant economic data from the US, traders will focus on speeches from influential FOMC members. In addition, broader risk sentiment may give the currency pair some momentum.
Trading recommendation: SELL 147.10, SL 147.30, TP 146.10

USD/JPY(20250514)Today's AnalysisMarket news:
The U.S. unadjusted CPI annual rate unexpectedly dropped to 2.3% in April, the lowest since February 2021.
Technical analysis:
Today's buying and selling boundaries:
147.76
Support and resistance levels:
148.83
148.43
148.17
147.34
147.08
146.68
Trading strategy:
If the price breaks through 147.76, consider buying, the first target price is 148.17
If the price breaks through 147.34, consider selling, the first target price is 147.08

COIN ~ Inverse Head & Shoulders Breakout -- Key Levels- Hello traders! COIN made a massive move today, breaking out of a beautiful Inverse Head & Shoulders pattern. So whats next?
- There are significant resistance levels approaching between $267 and $302 (including the Inverse H&S target level) which could potentially make for a good intraday short trade opportunity.
- Watch for a quick reversal from these levels in the coming days, if you're quick you may be able to catch a short trade.
- Theres no gaurantee that price will bounce from these levels, however this zone will certainly act as significant resistance in the short term.
~ Thanks everyone and best of luck in your trading journey!

AUD/JPY Short Bearish Trade Plan (Conservative Structure-Based Entry)
Entry: 92.40 (Sell Limit at resistance)
Stop Loss: 94.10 (Above weekly structure and fakeout buffer)
Take Profits:
TP1: 89.00 (initial neckline retest)
TP2: 85.50 (structure base)
TP3: 83.00 (macro extension target)

Gold has recently broke through the call entry!Market Analysis Update: Gold Price Movement
Gold has recently broken through the Call Entry (CE) level of the 1-hour Fair Value Gap (FVG), indicating a possible continuation of upward momentum in the short term. Based on current price action and technical indicators, we are expecting gold to continue moving higher. This move may potentially target the liquidity resting above previous swing highs, as traders' stop losses in those areas are likely to be triggered, fueling the upward trend.
Once this liquidity is cleared, there is a notable resistance zone marked in the 3270–3274 range, commonly referred to as the "black zone." This area is likely to act as a key decision point. If price reaches this zone and exhibits signs of bearish confirmation (such as rejection candles, divergence, or other reversal signals), there may be a potential selling opportunity from that level.
Additionally, it is worth noting that there is a trendline drawn below the current market structure, which may also attract price action. This trendline represents another area where liquidity might be collected before any significant directional move occurs.
Thank you for your attention to this analysis. If there is anything in the explanation that you find unclear or if you have questions about specific terms or concepts, feel free to ask for clarification.

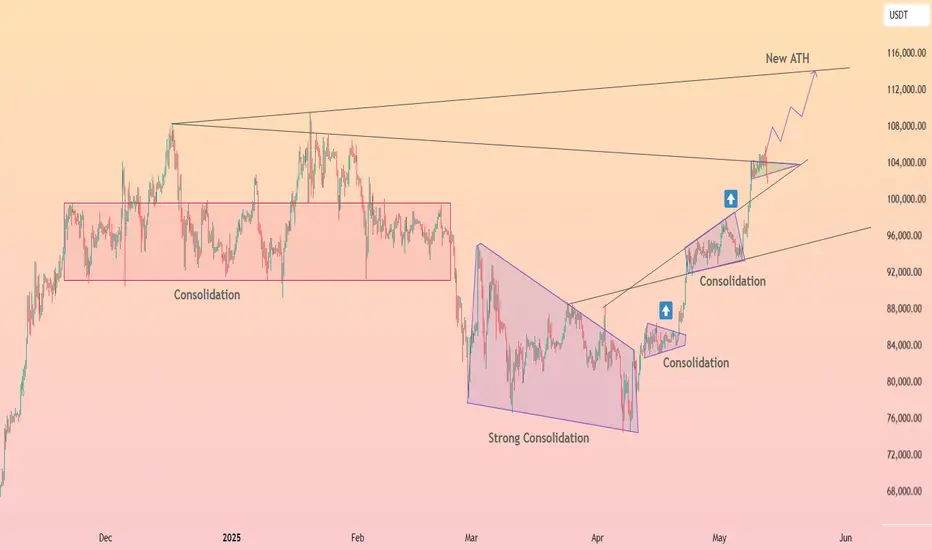
HolderStat┆BTCUSD retest $100 000 level🚀 After a grueling multi‑month consolidation boxed between mid‑90 k and 100 k, BTC finally sliced through its ceiling, confirming a textbook breakout from the rising wedge that grew out of March’s strong consolidation pennant. Price is stair‑stepping higher inside a fresh ascending channel, using 96 k as intraday support and chewing through 100 k supply. As long as this channel stays intact, traders can focus on the mapped path toward the projected new ATH near 115 k.
HelenP. I Bitcoin will continue to grow inside upward channelHi folks today I'm prepared for you Bitcoin analytics. The price has recently shown another confident bullish impulse, pushing higher within a clean ascending channel. The key moment was the breakout above the resistance zone, which had previously acted as a ceiling for the price. This breakout marked the continuation of a higher-high, higher-low sequence that confirms the strength of the ongoing trend. Then the market returned to retest this former resistance, now acting as support, and immediately bounced, reinforcing buyer control and validating the area as a foundation for the next move. Now BTC is holding firm in the upper half of the channel, maintaining its position above the trend line with little sign of weakness. This combination of sustained bullish structure, well-respected technical levels, and steady volume behavior suggests that the market is still preparing for higher levels. With the current structure and momentum, I expect BTCUSDT will continue its upward path within the channel. My goal is 108700 points, which aligns almost with the resistance line of the upward channel. If you like my analytics you may support me with your like/comment ❤️

btc . tue . may . w3looking bullish. missed the SHORT on monday, was merely looking for a nice LONG entry to trade the 1 leg extension and new ATH's.
LONG
entry . 101967
tp1 . 104576
tp2 . 108462
( tp3 . 110800 - let the trade run )


Fundamental Market Analysis for May 13, 2025 GBPUSDEvent to pay attention to today:
15:30 EET. USD - Consumer Price Index
18:00 EET. USD - BOE Governor Andrew Bailey Speaks
The GBP/USD pair is climbing towards 1.3195 in the early European session on Tuesday.
US President Donald Trump said last week that he would continue to impose new 10% tariffs on imports of most British goods, but would reduce higher tariffs on imports of British cars, steel and aluminium. These positive developments related to the US-UK trade deal are fuelling cable prices.
In addition, gradual and cautious policy easing by the Bank of England is helping to boost the Pound Sterling. The UK central bank cut interest rates by a quarter of a percentage point in a split decision last week and said the risks to growth posed by Trump's global trade war did not derail its plan for cautious policy easing. The Bank of England estimates the UK economy will grow by 1 per cent, up from the 0.75 per cent forecast at its February meeting.
Traders await the release of the US consumer price index (CPI) for April, due later on Tuesday.
Trading recommendation: BUY 1.3225, SL 1.3125, TP 1.3425

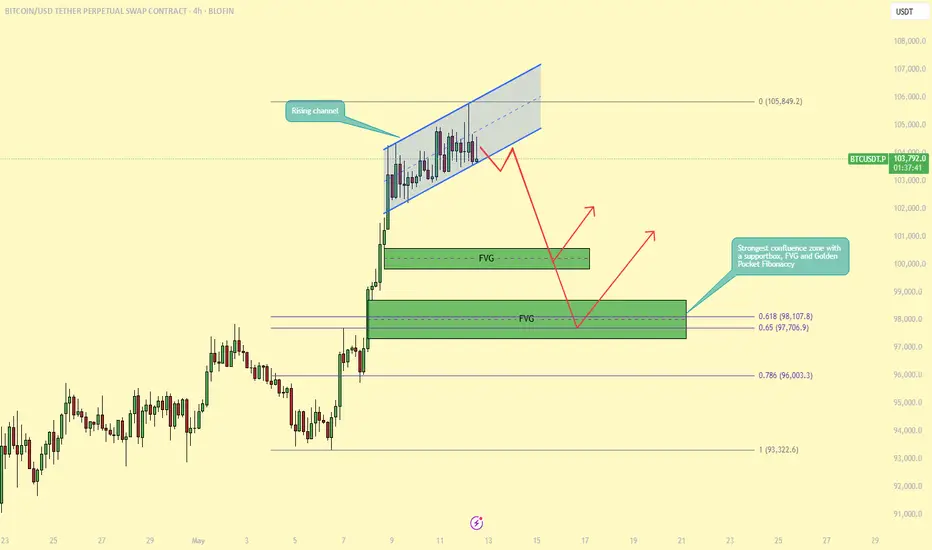
BTC Approaches All-Time High — But Signs of Weakness Emerge!BTC is once again approaching its all-time high (ATH) on the daily timeframe, generating excitement across the market. However, a closer look at the lower timeframes reveals signs of potential exhaustion as BTC encounters strong resistance. This suggests a pullback could occur before any continuation higher.
On the 4-hour and 1-hour charts, BTC is currently trading within a rising channel, which is often considered a bearish continuation pattern, especially when it forms directly below a key resistance level like the ATH. Price action within this structure is starting to lose momentum, and the presence of bearish divergences and decreasing volume further supports the likelihood of a near-term correction.
Where Could We Buy the Dip?
A pullback may offer a strategic entry opportunity for traders looking to ride the next leg up. Notably, two fair value gaps (FVGs) were created during the recent upward move. The first FVG could provide a minor bounce, but the second one is more compelling for a higher-probability long setup.
This second FVG aligns with a well-established support zone and coincides with the Golden Pocket of the Fibonacci retracement (between the 0.618 and 0.65 levels). This confluence of technical factors makes it a strong area of interest for bulls, and a potential springboard for price to retest, and possibly break, the ATH.
In summary, while BTC is showing strength on the higher timeframes, lower timeframe patterns suggest that a healthy correction is likely. Patience and proper level selection will be key. Watching how price reacts around the second FVG and the Golden Pocket zone may present one of the best opportunities for re-entry.
-------------------------------
Thanks for your support.
- Make sure to follow me so you don't miss out on the next analysis!
- Drop a like and leave a comment!
GBPUSD - SHORTI'm currently holding a bearish bias on GBP/JPY, anticipating a short-term correction after recent overbought conditions. Price action shows signs of exhaustion, and I'm expecting a move downward to fill the Fair Value Gaps (FVG) left behind during the previous bullish impulse.
Trade Rationale:
Overbought Conditions: After a strong upside move, price has reached a zone where buyers are losing momentum, hinting at a potential reversal or pullback.
Imbalance/FVG Zones: Clear inefficiencies exist below current price levels, and I expect the market to retrace to fill these imbalances as part of its natural rebalancing.
Structure & Supply: The market is showing reaction near a significant supply zone, which could act as the catalyst for bearish continuation.
Target Zones:
TP1: First demand zone where minor support may form — partials can be taken here.
TP2: Deeper demand zone aligned with previous consolidation — a high-probability area for price to react and potentially reverse or consolidate again.
Risk Management:
Stops are placed just above recent highs, invalidating the idea if the market breaks structure and continues bullish. The setup offers a favorable risk-to-reward ratio aligned with smart money concepts like imbalance fills and demand/supply reactions.
📉 Plan: Waiting for clear bearish confirmation (e.g., lower timeframe break of structure) before fully committing to the short position.

XAUUSD Price Outlook – Bearish Setup in Play ??Asset Overview
The chart represents a price action analysis with support and resistance zones, along with EMA indicators (50 and 200), likely on a 4H or 1H timeframe.
Key Technical Levels
Resistance Zone: ~3,400 to 3,450
First Support Zone: ~3,230 to 3,250
Second Support Zone: ~3,090 to 3,130
Indicators
EMA 50 (Red): Currently around 3,340, acting as dynamic resistance.
EMA 200 (Blue): Positioned near 3,232, reinforcing the first support zone.
Price Action Insight
Price had a strong uptrend, peaking above 3,440 before pulling back.
A lower high may be forming, suggesting possible trend exhaustion.
The current bounce appears to be a retracement back toward resistance or EMA 50.
Projected Move (As Illustrated on Chart)
Short-term bullish move into the resistance zone (~3,400–3,450).
Failure to break above resistance leads to sharp rejection.
Price retraces to first support zone (aligned with EMA 200).
If support fails, deeper drop expected toward the lower support zone (~3,100).
Strategic Notes
📉 Bearish Bias if price fails to break above resistance.
🔍 Watch for bearish candlestick patterns or divergences near resistance.
🛡️ First support aligns with EMA 200, making it a critical level for bulls to defend.
🔻 Breakdown below 3,230 opens room for larger correction to 3,100–3,090.
Conclusion
Currently, the chart suggests a potential short opportunity if price confirms rejection at resistance. The EMA cross structure remains bullish long-term, but momentum is weakening, and failure to reclaim highs could shift sentiment bearish in the short to mid-term.

NASDAQ Bullish Breakout Above Channel;📈 Technical Analysis Overview
1. Breakout from Downtrend Channel
The price has clearly broken out of a descending channel, confirmed by a clean breakout above the upper trendline.
This is a bullish signal, indicating the end of the prior downtrend and the start of a possible uptrend or reversal.
2. Moving Averages (EMA 50 & EMA 200)
EMA 50 (Red): 18,965
EMA 200 (Blue): 19,409
Price is currently trading above both EMAs, which is another strong bullish indicator.
A bullish crossover (where EMA 50 crosses above EMA 200) is likely imminent if upward momentum continues—this would form a Golden Cross, further confirming bullish sentiment.
3. Structure and Market Behavior
After the breakout, price retested the breakout zone and showed a bounce, forming a higher low, which is characteristic of a bullish structure.
The chart includes projected price action with higher highs and higher lows—suggesting a bullish continuation pattern.
4. Volume & Momentum (Not shown but implied)
Breakouts are typically validated by volume. Although volume is not shown, the sharp upward movement and breakout above resistance suggest strong buying pressure.
🔍 Key Levels to Watch
Resistance: 20,000 psychological level; above that, 20,500–21,000 may act as resistance.
Support: 19,400 (near EMA 200), and 18,965 (EMA 50); a break below may invalidate the bullish setup.
📊 Conclusion
The chart shows a clear breakout from a descending channel, supported by the price moving above both key EMAs. The structure favors bullish continuation, especially if price holds above the 19,400–19,500 support zone. Upside targets lie around 20,500 to 21,000.

US30 Approaching Key Resistance Within Rising Channel:🧠 Chart Context & Overview
Chart Type: Candlestick
Time Frame: Appears to be Daily (based on price action and spacing of dates)
Current Price: ~$40,798.4
Indicators:
EMA 50 (Red): ~40,065.2
EMA 200 (Blue): ~41,475.6
Trend Structure: Ascending channel with higher highs and higher lows forming since early April.
🔍 Technical Breakdown
📈 Trend Analysis
The price is moving within a rising parallel channel, respecting both upper and lower boundaries.
The recent bullish candles indicate momentum building towards a breakout or test of resistance.
🔄 EMA Confluence
Price is above the 50 EMA, showing short-term bullish momentum.
EMA 200 is acting as overhead resistance (~41,475), aligned with the top of the channel—a key decision zone.
📊 Support & Resistance Levels
Immediate Resistance: ~41,475 (EMA 200 & upper channel boundary).
Support Levels:
~40,065 (EMA 50)
~39,000 (mid-channel support zone)
~38,000 (lower channel boundary)
📌 Scenarios to Watch
✅ Bullish Case:
A clean breakout above the channel and the 200 EMA (~41,475) with strong volume could trigger a trend continuation toward:
42,500 – next psychological and historical resistance
Potentially higher if macro sentiment aligns
⚠️ Bearish Case:
Rejection at 200 EMA or the upper channel could lead to:
A pullback to the mid-channel zone (~39,800–40,000)
Further downside to retest the lower channel support (~38,000)
📅 Outlook
The chart currently supports a bullish bias within an uptrend structure, but the key resistance zone (41,475) must be broken decisively for confirmation. Watch for volume and candle structure near that level to assess breakout validity.

$ENA Finally Breaks Out – Retesting Before Next Leg Up!!MIL:ENA eventually broke through the adamant trendline resistance.
following repeated rejectionsPrice is now backing off slightly, testing the Fib area and breakout formation.
Holding at this level positions it to make a clean run to $0.48–$0.50+This chart is on the rise again ????
Follow for more updates
DYOR, NFA

USD/CHF Reversal Setup (Read-Caption)🧠 Professional Technical Analysis – USD/CHF 💱
🗓️ Date: May 6, 2025
🕰️ Timeframe: Likely 4H or Daily
📊 Current Price: ~0.82218
🔍 Technical Indicators
🔵 EMA 20: 0.84190 (short-term trend)
🔴 EMA 50: 0.82524 (mid-term trend)
❗ Bearish crossover: EMA 20 is below EMA 50 → short-term bearish bias 🐻
📉 Support Zone Analysis 🛡️
🟥 Key Demand Zone (Support): 0.82084 – 0.81437
🔁 Price has bounced here before 🪃
🕯️ Candles with long lower wicks = buyers stepping in 🧍♂️💪
🟠 This is the “bounce zone” 📈
🧭 Trade Idea
✅ Long Entry: Around 0.82084–0.82200
🛑 Stop Loss: Below 0.81437 ❌
🎯 Take Profit: Around 0.83600 🟢
⚖️ Risk/Reward: Excellent (>2:1) if bounce holds 🚀
🔄 Price Action Outlook
📉 Downtrend approaching major support
🕯️ Looking for bullish candlestick confirmation (engulfing, hammer, etc.)
📈 Target area aligns with mean reversion to EMA 20
📌 Conclusion
👀 Watching for bullish reversal signs 🔄
🛒 Buy zone is clearly defined ✅
⛔ Setup is invalidated if price closes below 0.81437

EURNZD Bearish Reversal Confirmed: Break and Retest Below Key Su🧠 Market Context & Structure:
Trend Analysis: The pair is currently in a bearish structure. This is evident from lower highs and lower lows forming after a failed bullish breakout attempt.
Key Zone: A supply zone (highlighted in red) around 1.90198 – 1.90750 has acted as a strong resistance. Price was rejected here after retesting.
Break of Structure (BoS): A clear bearish breakout below the ascending trendline and the horizontal support confirms a shift in sentiment.
📉 Indicators & Confluences:
EMA Analysis:
EMA 50 (red): 1.90757
EMA 200 (blue): 1.90728
Price is trading below both EMAs, which confirms bearish momentum. Also, a bearish EMA crossover (50 crossing below 200) may be forming or has just occurred — a death cross, which further supports downside bias.
🎯 Trade Setup Breakdown (Bearish Bias):
Entry: Around 1.89760 (current price)
Stop Loss: Above the supply zone (~1.9020 - 1.9070)
Take Profit Target: Around 1.86035 (highlighted in green), aligning with previous demand zone or measured move.
Risk-to-Reward Ratio (RRR): Estimated at ~3:1, making this a favorable setup.
🔽 Technical Patterns:
Bear Flag / Rising Wedge: The broken ascending pattern suggests a bearish continuation.
Retest Confirmation: Price retested the broken structure before continuing down — classic bearish retest behavior.
✅ Conclusion:
This is a textbook bearish setup supported by:
A failed breakout and structure shift
Resistance at a key supply zone
Break and retest of support
Price under both EMAs (bearish confirmation)
📌 Bias: Bearish
📌 Invalidation Level: Close above 1.9075
📌 Next Support Zone: 1.8600–1.8550 range

BTC at Key Inflection Zone – Breakout or Rejection Ahead?Asset: BTC/USD
Timeframe: 4H or Daily (based on visual pattern structure)
As of: May 6, 2025
Indicators:
50 EMA (Red): $91,615.79
200 EMA (Blue): $89,305.75
Key Technical Zones:
🔴 Resistance Zone: ~$104,000 – $108,000
This area has historically acted as a major supply zone.
Price has been rejected from this level multiple times, indicating strong selling pressure.
🔁 Flip Zone (Resistance turned Support/Support turned Resistance): ~$95,500 – $100,000
The current price ($95,234.23) is testing this zone from below.
A confirmed break and hold above could signal continuation toward the higher resistance.
🟢 Strong Support Zone: ~$88,000 – $91,000
Confluence of 50 EMA and 200 EMA adds strength to this demand zone.
Previous breakout level and accumulation area.
EMA Outlook:
50 EMA > 200 EMA: Short-term bullish crossover is active, indicating bullish momentum.
Both EMAs are sloping upward slightly, suggesting trend strengthening.
Price is currently above both EMAs, which acts as dynamic support.
Potential Scenarios:
✅ Bullish Scenario:
If price reclaims the $95,500–$100,000 resistance-turned-support zone:
Expect upward momentum to continue.
Target: $104,000–$108,000 zone.
Break of $108K could lead to a macro bull continuation.
⚠️ Bearish Scenario:
If price rejects the current zone and fails to hold above the $91,000 support:
Look for retest of $88,000–$89,000 area (confluence with EMAs).
Breakdown below that zone would invalidate bullish structure and signal potential deeper correction.
Summary:
Bias: Bullish above $91K, Neutral between FWB:88K –$91K, Bearish below $88K.
Key Confirmation Needed: Daily close above $100,000 for strong bullish continuation.
Risk Management: Watch for fakeouts within the $95K–$100K range due to past volatility.
