XAUUSD at Critical Support – Bullish Continuation or Pullback 🔍 Market Overview
The chart shows a technical setup with clear support and resistance zones, alongside key Exponential Moving Averages (EMAs) to guide directional bias.
📊 Key Technical Levels
Resistance Zone: ~$3,445–$3,460
This is a historically reactive area where price has reversed sharply in the past. A breakout above this zone would suggest strong bullish continuation.
Strong Supporting Zone: ~$3,375–$3,390
Currently being tested. If the price holds here, it could act as a launchpad for a bullish move toward resistance.
Support Zone: ~$3,320–$3,340
If the strong support breaks, the next downside target would be this zone, which aligns with the 200 EMA (blue line) — a dynamic support level.
📈 Moving Averages
50 EMA (Red): Currently at $3,345.60, serving as a short-term dynamic support.
200 EMA (Blue): Currently at $3,304.13, marking a critical longer-term support. Price staying above this EMA reflects a bullish bias.
🔀 Probable Scenarios
Bullish Case (Preferred Scenario)
If price holds the strong supporting zone and breaks above current highs (~$3,395), it could rally toward the resistance zone at $3,445–$3,460.
Break and close above resistance may open the door for further upside continuation.
Bearish Case
A rejection from current levels or a break below $3,375 would likely lead to a retracement toward the support zone ($3,320–$3,340).
A break below the support zone and the 200 EMA would shift the structure into bearish territory.
✅ Bias & Recommendation
Current Bias: Cautiously Bullish
As long as the price remains above the strong supporting zone and 50 EMA, bulls have the upper hand.
Look for confirmation with a higher low or bullish engulfing candle before entering long.
Trade Idea:
Long Entry: On bullish confirmation above $3,395
Target: $3,445–$3,460
Stop Loss: Below $3,375 (support break)
Analysis

[XAUUSD] Daily Analaysis 12 - 13 May 2025Continuing my mapping in the previous post, H4 GOLD turned out to be stronger and brought GOLD down to support 3195 - 3238. Of course, today's large decline will be followed by a fairly high correction as well. Anticipate GOLD which will correct to the previous low at 3282.
With the confirmed downtrend pattern, the SELL Area 3262 - 3290 is worthy of our SELL position again.

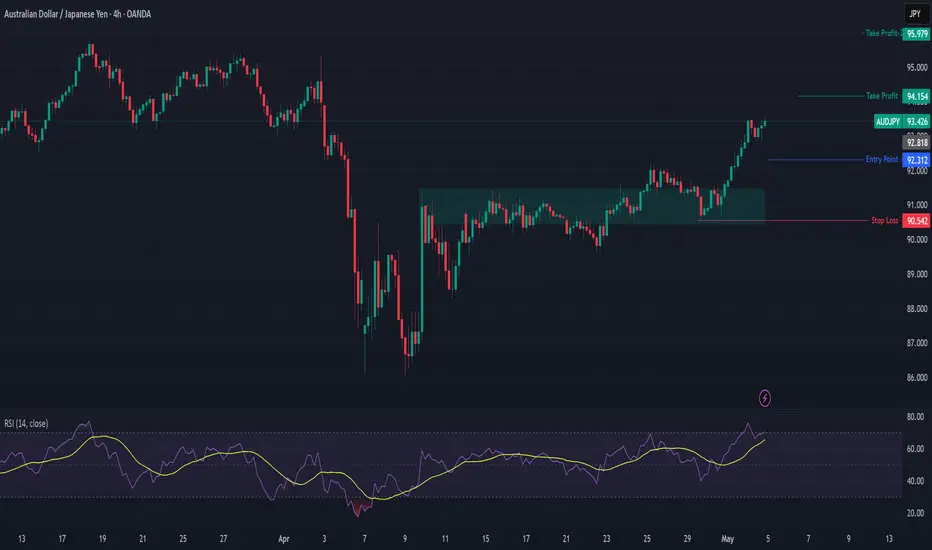
AUDJPY Trade Setup (Bullish Bias)🔥 Setup Summary:
Item Details
Bias: ✅ Bullish
Reasoning:
- Fundamentals strong (expectation no interest rate cuts + CPI bullish)
- JPY weak + overbought COT
- Exogenous: AUD strengthening
- Seasonality bearish short-term BUT medium-term bias bullish
Primary Entry: 🔑 92.30 (Buy Zone)
Dip Buy Zone: 🔄 91.80 – 92.00 (0.5–0.618 Fib retrace)
Stop Loss: 🚫 90.54 (below structure + 0.786 Fib)
Take Profit 1: 🎯 94.15 (below last swing high)
Take Profit 2: 🎯 95.00+ (extended target for trend continuation)
Risk:Reward: ~1:3+ (Entry at 92.3 / TP at 94.15–95.00)
Euro may exit from wedge and then drop to support levelHello traders, I want share with you my opinion about Euro. After a strong impulse to the upside and a retest of the 1.1265 resistance area, the Euro started to consolidate inside a downward wedge. Despite repeated attempts to hold above the 1.1265 - 1.1300 zone, price action gradually shifted lower, creating lower highs within the wedge formation. This pattern often signals continuation or deeper correction, especially when formed after a large bullish move. The recent breakout below both the support area and the lower wedge boundary confirms that bearish pressure is taking control. The rejection from the seller zone and the sharp decline reinforce this shift in sentiment. Now the price is trading near the support line of the wedge and showing weak attempts to recover, forming a potential retest of the broken structure. Given the break of support, I expect the Euro may continue its decline toward the 1.0925 level, which coincides with both the buyer zone and a well-defined support level, thereby exiting from wedge pattern. This zone serves as my current TP 1. Please share this idea with your friends and click Boost 🚀

GOLD Weekly Open Analysis:Gap Down Sparks Fresh Bearish Momentum🟠 GOLD (XAU/USD) – Weekly Open Analysis: Gap Down Sparks Fresh Bearish Momentum
Gold opens the week with a sharp gap-down, reflecting a cooling of global tensions and softer tones in tariff negotiations over the weekend. With both geopolitical risks and trade conflicts showing signs of de-escalation, investors quickly shifted away from safe-haven demand, leading to immediate downside pressure in early Asia hours.
🔍 Market Context:
The price action remains within a bearish parallel channel on the M30 timeframe.
A visible GAP ZONE has formed between $3326 – $3328, which now acts as a key resistance area to watch for a potential retest.
This week brings critical US economic data including CPI, PPI, and a Fed speech, all of which could drive large volatility.
The market is likely to remain extremely sensitive to any shifts in:
US inflation expectations
FED forward guidance
Further headlines on tariffs or geopolitical escalations (Russia–Ukraine, India–Pakistan)
🔧 Trading Strategy for Today (13/05/2025):
Bias: Short-term bearish unless clear reversal signs appear.
Primary focus: Sell the rally, especially near key resistance zones.
🔺 Key Resistance Levels:
$3288
$3308
$3326–$3328 (Gap Fill Zone)
🔻 Key Support Levels:
$3262
$3246
$3236
$3200
🎯 Trade Ideas:
🔵 BUY ZONE:
Entry: $3246 – $3244
SL: $3240
TPs: $3250 → $3254 → $3258 → $3262 → $3266 → $3270 → $3280
Valid only if buyers show strong defense at key support zones.
🔴 SELL ZONE (Main):
Entry: $3326 – $3328
SL: $3332
TPs: $3322 → $3318 → $3314 → $3310 → $3305 → $3300
🔴 SELL SCALP (Early Intraday):
Entry: $3306 – $3308
SL: $3312
TPs: $3300 → $3296 → $3290 → $3286 → $3282 → $3278 → $3270
⚠️ Key Reminders:
Volatility is expected to remain high throughout the week due to macro events and shifting risk sentiment.
Trade with discipline — stick to your TP/SL and avoid emotional entries.
Wait for confirmation at your planned levels. Let the market come to you.
📣 Final Note:
This week is packed with catalysts. Patience and precision will define successful trades. Follow this account for real-time updates as the market reacts to US CPI and Fed commentary.

Fundamental Market Analysis for May 12, 2025 EURUSDEUR/USD is retreating from the gains made in the previous session, trading near 1.12400 in Monday's Asian session. The Euro (EUR) has been under pressure since European Central Bank (ECB) official Olli Rehn said last week that the ECB may consider cutting interest rates at its next meeting, provided that upcoming forecasts confirm a continued trend of disinflation and slowing economic growth.
Despite this, EUR/USD found some support thanks to optimism surrounding the trade talks between the US and China that took place in Geneva. Both sides reported “substantial progress” after two days of talks aimed at de-escalating the ongoing trade dispute. Chinese Vice Premier He Lifeng called the talks an “important first step” in stabilizing bilateral relations, while U.S. Treasury Secretary Scott Bessent echoed his sentiment, noting significant progress.
Markets are now awaiting Washington's response to the European Commission's proposed countermeasures against U.S. tariffs. On Thursday, the Commission launched a public consultation that outlined potential tariffs on up to 95 billion euros worth of imports from the U.S. if trade talks break down.
Meanwhile, the U.S. economic outlook remains uncertain. Federal Reserve (Fed) officials have noted the risk of stagflation, and Fed Chairman Michael Barr has warned that higher tariffs could disrupt supply chains, leading to higher inflation, lower growth and higher unemployment. Investors remain cautious as further escalation of trade tensions could pose serious problems for the US economy.
Trading recommendation: BUY 1.12300, SL 1.11900, TP 1.13000

HelenP. I Gold will rebound from trend line to resistance zoneHi folks today I'm prepared for you Gold analytics. After an aggressive rally from the support zone, the price has been consolidating just below the resistance area. What’s important now is how price behaves around the trend line, which has acted as dynamic support since early April. The most recent pullback landed exactly on this line, where buyers quickly reacted, forming a higher low. This move suggests that the bullish structure remains intact and buyers are defending their positions. The market is currently hovering near 3325, but with momentum slowly building and no major bearish breakdowns, it’s reasonable to anticipate another push higher. The resistance zone between 3405 and 3435 is the next key area, and it aligns with the top of the recent impulse move. If XAUUSD holds above the trend line and breaks through the 3405 level, we could see a continuation toward 3435, my current goal. Overall, the market shows a steady uptrend, supported by rising lows and a strong reaction at the trend line. Until this structure is broken, I remain bullish. If you like my analytics you may support me with your like/comment ❤️

Gold will continue to grow and exit from pennantHello traders, I want share with you my opinion about Gold. After looking at this chart, we can see how the price of Gold has been developing inside an upward pennant, formed after a powerful impulse from the buyer zone. This earlier move created a strong bullish foundation, supported by consistent reactions from the support area, which has since become a key defensive level. After the breakout from the upper boundary of the previous ascending channel, the price entered a phase of consolidation. However, rather than fading, the price action has remained tightly squeezed between the support line and the resistance trendline, creating the structure of a classic pennant. This pattern usually signals continuation, especially when supported by strong preceding momentum, which is exactly what we’re seeing here. Currently, the price is hovering around the support line of the pennant and has already shown signs of bouncing back up. If this rebound continues, the next logical move is a breakout through the resistance line of the pennant, with the 3450 level as a target. It aligns perfectly with the upper boundary and represents a strong technical TP1. Please share this idea with your friends and click Boost 🚀

EGX30 Downward Trend AnalysisEGX30 stock started to fell reaching the 31,661.82 support line, showing the sellers' dominance over the buyers. This is a result of investors' waiting for the outcome of U.S.-China trade talks on the weekend. In addition, blue-chip developer Emaar Properties reported Q1 net profit of 3.71 billion dirhams that missed the analysts' estimate of 4 billion dirhams.

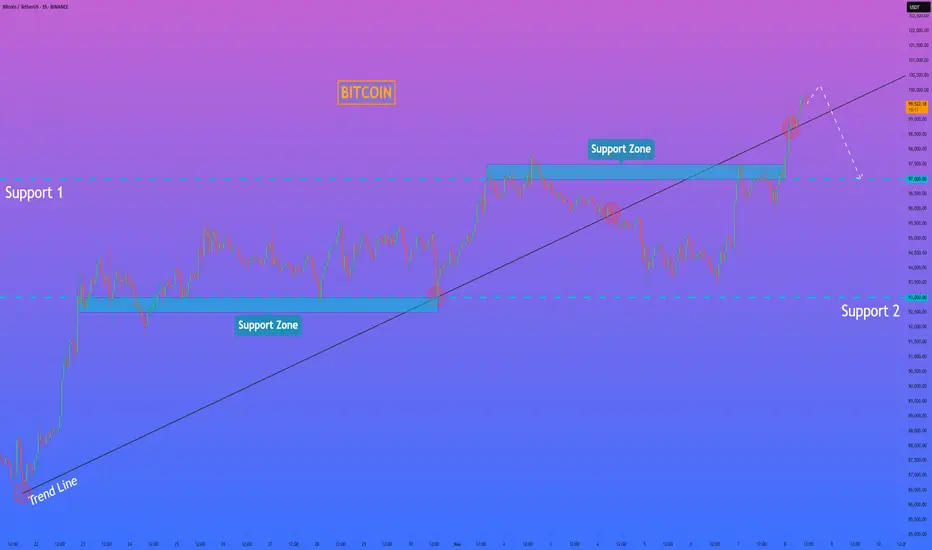
HelenP. I Bitcoin can break trend line and fall to support levelHi folks today I'm prepared for you Bitcoin analytics. After a strong rally, зкшсу has reached a critical zone, and the reaction here might become a key pivot for short-term price action. Price managed to break above the ascending trend line, but instead of continuation, we saw a clear rejection from the 99500 area, followed by a sharp drop back below the trend structure. This type of movement often indicates bull trap behavior. Breakout traders enter on momentum, but then get squeezed as the price fails to hold above the trend. At the same time, buyers are beginning to lose control, and sellers are regaining initiative near major resistance. Importantly, BTC is now pulling back toward a support zone between 97500 and 97000, which previously acted as a base for consolidation. If this level fails to hold, the next support lies around 93000, where the trend originally started. The structure is shifting. A trend line break followed by a failed retest often signals a trend reversal or, at least, a deeper correction. I expect BTCUSDT can drop to the 97000 level, breaking the trend line. If you like my analytics you may support me with your like/comment ❤️
GOLD - Price can bounce up to $3475 points, exiting from pennantHi guys, this is my overview for XAUUSD, feel free to check it and write your feedback in comments👊
A few moments ago price traded inside flat, where it two times broke $3045 levels and then made impulse up.
Price exited from flat and continued to grow inside a pennant pattern, where it later reached $3320 level.
Then Gold broke this level and rose to resistance line of a pennant, and then made a correction to support level, and then broke it.
After this, the price declined to the support line of the pennant, after which it turned around and bounced up.
Gold broke $3320 level and rose to resisance line of pennant, but recently it made correction to this level.
So, now I expect that price can bounce up from this level to $3475, thereby exiting from pennant pattern.
If this post is useful to you, you can support me with like/boost and advice in comments❤️

Gold Friday Volatility – Liquidity SweepsGold Friday Volatility – Liquidity Sweeps & Potential Channel Break Ahead
Gold kicked off Friday with intense volatility, triggering sweeping liquidity grabs during the Asian session. Price dropped aggressively into the 327x region, clearing stop zones and vacuuming liquidity — only to quickly rebound and fill the imbalance above.
This classic FVG (Fair Value Gap) behavior was especially visible on the M30 timeframe, as price repeatedly left behind inefficient zones and promptly returned to fill them. Volatility remains elevated — and traders should proceed with caution.
📉 Technical Context – End of the Downtrend?
Since Thursday, gold has been trading in a clean descending parallel channel, respecting lower highs and pushing downward. However, late in the Asian session today, a bullish momentum surge appears to be testing the upper boundary of this channel.
We are now watching the 3324 level very closely.
A confirmed breakout above this zone — with candle closure outside the trendline — would suggest a structure shift and open the door for BUY setups on the retest.
Until then, we observe. Let price confirm. We trade the reaction, not the assumption.
🌍 Macro Risk – Trade Tensions & Weekend Volatility
The market remains extremely reactive to:
Geopolitical risks: Military tensions are still simmering.
US–China tariff discussions: President Trump is expected to make remarks on tariff policy.
Any surprise here could heavily impact USD and gold.
⚠️ Liquidity sweeps are common on Fridays — especially into London and NY sessions — so risk management is critical today.
📌 Key Technical Levels to Watch
🔺 Resistance:
3345 → 3364 → 3395
🔻 Support:
3280 → 3270 → 3256 → 3244 → 3225
The 3324 and 3366 zones are particularly critical.
If price closes firmly above these zones, bullish continuation becomes more likely.
If price gets rejected, we stay within range and look for sell opportunities.
🎯 Trade Plan – Friday, May 10
🟢 BUY ZONE
Entry: 3280 – 3278
SL: 3274
TPs: 3285 → 3290 → 3295 → 3300 → 3305 → 3310 → 3320
🔴 SELL ZONE
Entry: 3364 – 3366
SL: 3370
TPs: 3360 → 3356 → 3352 → 3348 → 3344 → 3340 → 3330
🧠 Final Thoughts:
Friday often delivers unexpected liquidity traps.
With news expected from the White House and technical structure on the verge of a break, this session could offer both risk and reward — if approached with discipline.
✅ Use clear levels.
✅ Respect TP/SL.
✅ Stay sharp as NY volume enters.
📣 Let’s end the week strong. Drop your charts and ideas below!

#ETH Breakout is incoming!$ETH/USDT – Breakout Watch
Ethereum is currently retesting a key descending resistance line after an extended period of consolidation. The structure suggests growing bullish momentum.
🟢 A successful breakout and daily close above the $1,900–$2,000 zone could trigger a move toward $2,200–$2,400 in the coming sessions.
Watch for confirmation with volume expansion and retest behavior. Rejection at this level could delay the move, but the pressure is clearly building.
Key Levels:
Resistance: $1,900–$2,000
Target: $2,200–$2,400
Support: $1,800
Chart looks clean breakout potential is real.
DYOR NAF
BINANCE:ETHUSDT BITSTAMP:ETHUSD

Fundamental Market Analysis for May 9, 2025 USDJPYUSDJPY:
The Japanese yen (JPY) rises against its US counterpart during the Asian session on Thursday and reverses part of the previous day's correction from a one-week high. Minutes from the Bank of Japan's (BoJ) March meeting showed that the central bank remains open to further tightening if the economic and price outlook persists. This, along with a rebound in safe-haven demand, is lending support to the Japanese Yen, which, along with the emergence of fresh US Dollar (USD) selling, is keeping the USD/JPY pair below the 144.00 round figure.
Optimism over the start of trade talks between the US and China, which will take place this week in Switzerland, is fading rather quickly amid uncertainty over how a new deal between the world's two largest economies might be structured. In addition, US President Donald Trump has denied that he will reduce tariffs against China, dampening hopes of a speedy resolution to the trade war between the world's two largest economies. In addition, persistent geopolitical risks kept investors on edge and proved to be the key factor that influenced the yen's growth amid the general weakening of the dollar.
Trading recommendation: SELL 145.80, SL 146.00, TP 144.90

Euro may correct to support area and then start to move upHello traders, I want share with you my opinion about Euro. Looking at this chart, we can see how price has been confidently trending within an upward channel, supported by strong impulses and consistent demand from the lower boundary. The price initially rebounded from the buyer zone, which later became the launchpad for a major upward move. After breaking the resistance line of the channel, the Euro made a clean breakout and confirmed its strength with a retest from above, a clear sign of bullish continuation. This upward momentum carried price directly into the support area, which has since served as a key zone for consolidations. The market then shifted into a horizontal range, trading within well-defined boundaries, with repeated rejections near the top and steady rebounds from the bottom support. What’s crucial now is that the Euro is again testing the lower border of this range while holding above the current support level at 1.1270. Given this structure, a strong preceding trend, clean reaction at the bottom of the range, and ongoing consolidation without deeper breakdowns, I expect the price to rebound from this zone and continue higher. My TP1 is set at 1.1575, the upper boundary of the current range, which remains a logical magnet for price in the short term. Please share this idea with your friends and click Boost 🚀

btc . tue . recapApproaching the cmLow during 2/4pm (utc+2) on tuesday, brought the tiny SFP liquidity and and a NO LOOK BACK push upwards. The SHORT wasn't taken as the the bounce showed no weakness
The intraday LONG turned out to be a runner.
entry . 93454
tp1 . 94854 . +1.5%
- this seems a 'too early tp', correct but: thought as an intraday . securing the daily minimum: PROFIT TAKEN
tp2 . 100477 . +7.5%
tp3 . 103626 . +10.8%
The long entry is now at average 94863 . ish prv tp1
- I was waiting for lower, to add LONG position size
But upon not seeing follow through and strong bounces on lower TFs, I went with a 30% of original trade size addition during wednesday 8/10pm.
Now it's 10:30am, we've just pushed another 1h leg higher. I'll ride this to my next TPs, bigger reactions at this point I see only at higher prices.
This thing is BULLISH
(always hungry for good SHORT trades, but paytient for reactions)

XAU/USD 08 May 2025 Intraday AnalysisH4 Analysis:
-> Swing: Bullish.
-> Internal: Bullish.
Analysis and bias remains the same as analysis dated 23 April 2025
Price has now printed a bearish CHoCH according to my analysis yesterday.
Price is now trading within an established internal range.
Intraday Expectation:
Price to trade down to either discount of internal 50% EQ, or H4 demand zone before targeting weak internal high priced at 3,500.200.
Note:
With the Federal Reserve's dovish stance and persisting geopolitical uncertainties, heightened volatility in Gold is expected to continue. Traders should proceed with caution and adjust risk management strategies in this high-volatility environment.
Price could also be driven by President Trump's policies, geopolitical moves and economic decisions which are sparking uncertainty.
H4 Chart:
M15 Analysis:
-> Swing: Bullish.
-> Internal: Bullish.
analysis and bias remains remains the same as yesterday's analysis dated 07 May 2025.
As mentioned in yesterday's analysis that I would continue to monitor price and depth of bearish pullback following previous bullish iBOS.
Price did not pull back with any significance, therefore, I will apply discretion and not mark the previous iBOS. I have however marked this in red.
Price continued bullish and subsequently printed a bearish iBOS to indicate, but not confirm bearish pullback phase initiation.
Price is now trading within an established internal range, however, I will continue to monitor depth of pullback.
Intraday Expectation:
Price to trade down to either discount of internal 50% EQ, or M15 supply zones before targeting weak internal high priced at 3,435.055
Note:
With the Federal Reserve maintaining a dovish stance and ongoing geopolitical tensions, volatility in Gold prices is expected to remain elevated. Traders should exercise caution, adjust risk management strategies, and stay prepared for potential price whipsaws in this high-volatility environment.
Trump's tariff announcement will most likely cause considerably increased volatility and whipsaws.
M15 Chart:

Nifty preparing itself for Big Momentum Today 8may 2025 Nifty traded in just tiny range even on expiry Day. so, what will be next Move?
it is ready for bearish momentum ?
First reason: I have noticed multiple weakness through Wick which is representing by arow on chart.
Second reason: whenever market traded in narrow range (around 8-10 hourly candle) in past few days it gave breakdown represented drawing 4 yellow area see on chart.

XAU/USD - Fed warns of Economic UncertaintyThe XAU/USD pair on the M30 timeframe presents a Potential Buying Opportunity due to a recent Formation of a Bullish Flag Pattern. This suggests a shift in momentum towards the upside and a higher likelihood of further advances in the coming hours.
Possible Long Trade:
Entry: Consider Entering A Long Position around Trendline Of The Pattern.
Target Levels:
1st Resistance – 3473
2nd Resistance – 3519
🎁 Please hit the like button and
🎁 Leave a comment to support for My Post !
Your likes and comments are incredibly motivating and will encourage me to share more analysis with you.
Best Regards, KABHI_TA_TRADING
Thank you.

Fundamental Market Analysis for May 8, 2025 GBPUSDEvents to pay attention today:
15:30 EET. USD - Number of Initial Jobless Claims
14:00 EET. USD - Bank of England Key Interest Rate Decision
GBPUSD:
GBP/USD was down six-tenths of a per cent on Wednesday as markets continued to hold on to the safe-haven US dollar. The Federal Reserve (Fed) left rates unchanged as markets had expected, but Fed policymakers, still adopting a wait-and-see stance, curbed risk appetite during the midweek market session. The Bank of England (BoE) will hold its own rate meeting on Thursday and is expected to cut rates by another quarter point.
Forex Today: All eyes on the Bank of England
Market sentiment declined after Fed Chairman Jerome Powell's press conference. He said that US trade tariffs could hamper the Fed's inflation and employment targets this year. Powell warned that continued policy instability could force the Fed to take a ‘wait-and-see’ approach to interest rates. While the Trump administration's tariffs have weighed heavily on consumer and business sentiment, the lack of significant negative economic data makes it difficult for the Fed to justify an immediate change in interest rates.
Powell: The right thing to do is to wait for further clarity
The Bank of England is expected to cut the rate by a further quarter point at its upcoming meeting on Thursday, marking the fourth rate cut since it peaked in 2023. The Bank of England's Monetary Policy Committee (MPC) is expected to vote nine to one in favour of another rate cut in an attempt to support the faltering UK economy.
Trading recommendation: SELL 1.3330, SL 1.3350, TP 1.3230

$RATS Heating Up — 100% Move on the Table?$RATS – Pressure Building, Breakout Imminent
$RATS is quietly loading up for a massive breakout. Price has been grinding higher with strong demand stepping in at every dip — support structure is holding beautifully.
🧠 Key Observations:
Clean ascending structure
Consistent higher lows
Testing a major resistance zone
Volume creeping up = Accumulation signs
📈 Breakout Potential:
Once $RATS clears this resistance zone, the chart opens up for a sharp move — a 100%+ pump is well within reach based on the current range.
📌 What I’m watching for:
Break & close above resistance
Volume confirmation on breakout
Retest = entry zone for momentum chasers
The structure’s solid, the risk is tight, and the upside is explosive. Eyes on $RATS — the move could be BIG.Image

XAUUSDStrong trend movement up, then range. This movement is considered another rise for me as an analysis of 3469, 3506, but any political news, especially from a press conference, is unexpected and the analysis may end up falling. Today we have important news, which is the US interest rate decision and a press conference.

EURO - Price can start fall to support line of pennant patternHi guys, this is my overview for EURUSD, feel free to check it and write your feedback in comments👊
Some days ago price traded inside triangle, where it declined below $1.1310 level, but then made upward umpulse.
Price exited from triangle pattern and broke the $1.1425 level, after which it entered to pennant pattern.
In pennant, Euro reached the resistance line, after which it turned around and in a short time declined to the $1.1310 level, breaking $1.1425
Then the price some time traded between these two levels and later dropped to the support line of the pennant.
But recently it backed up and now traded very close to resistance line of pennant, so, I think it can rise a little.
After this movement, in my opinion, Euro can start to decline to $1.1300 support line of pennant.
If this post is useful to you, you can support me with like/boost and advice in comments❤️
