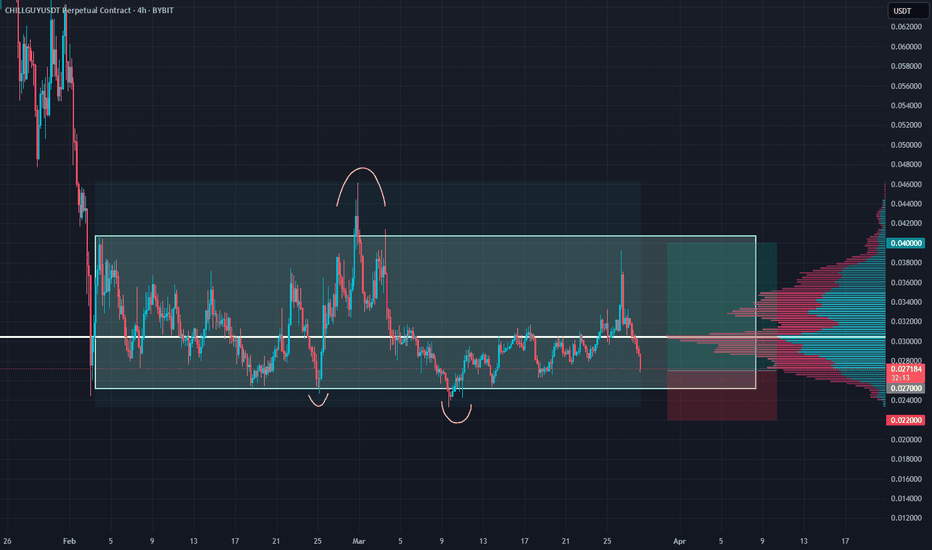
CHILLGUY: The Perfect Range Play Before Lift-Off!CHILLGUY has been in solid sideways accumulation, with a few deviations along the way. Now, it’s sitting near the bottom of the range, setting up for a strong move up. A sharp breakout is on the table, targeting a gap fill.
Entry: Now
TP: 0.03-0.04
SL: 0.022
Stay tuned and follow me so you don’t miss the next big setups! 🚀
Analysis
#KAITO #KAITOUSDT #Analysis #Eddy#KAITO #KAITOUSDT #Analysis #Eddy
Everything is clear and I have clearly drawn the important areas in the chart and the labels and names of the areas are included. Depending on your analytical style, you can get the necessary confirmations and see the reduction from the marked areas to the specified targets.
DXY Monthly Analysis: Key Support Holding, Bullish Move Ahead?📊 DXY Monthly Chart Analysis (March 27, 2025)
Key Observations:
Current Price Action:
The U.S. Dollar Index (DXY) is trading near 104.267, with notable resistance ahead.
Price is consolidating within a key demand zone (~102.5–104) after rejecting higher levels.
Technical Levels:
Support Zone: 100.2–104 (Highlighted in purple)
Resistance Zone: 112.5–114.7 (Highlighted in purple)
Major Resistance: 114.77 (Previous high, acting as a supply zone)
200-MA Support: Located below current price, offering a long-term bullish confluence.
Market Structure:
Price remains in a higher time-frame bullish trend but is experiencing a correction.
The "BOSS" level (Break of Structure) suggests a prior bullish breakout.
If the demand zone holds, a bullish continuation towards 112.5–114.7 is possible.
Projected Move:
A bounce from 102–104 could trigger a rally toward the upper resistance zone (~112.5).
A break below 100.2 could indicate a shift in trend and further downside.
Conclusion:
DXY is at a critical decision point. Holding the current support zone (~102–104) could fuel a bullish continuation toward 112–114, while a breakdown below 100.2 would weaken bullish momentum.
XAU/USD Analysis–Bearish Continuation Within Descending Channel📉 Gold (XAU/USD) H1 Analysis – March 26, 2025
🔻 Descending Channel Formation:
The price remains confined within a downward-sloping channel, signaling continued bearish pressure.
Lower highs and lower lows confirm the short-term downtrend.
📍 Key Levels & Structure:
Current Price: $3,019
Resistance Zone: Around $3,025 - $3,030 (upper boundary of the channel)
Support Zone: $3,000 psychological level and potential lower boundary near $2,985
📌 Market Imbalance (MB) Not Filled:
A minor liquidity gap remains unfilled above, indicating a possible short-term retest before continuation.
📉 Bearish Expectation:
If price fails to break above the resistance trendline, we could see a drop toward $3,000 or even lower.
Watch for rejection signals at the upper boundary for short opportunities.
🔎 Trade Considerations:
Bearish Bias: Short entries from resistance with targets at $3,010 - $3,000.
Invalidation: A breakout above $3,030 could signal bullish strength.
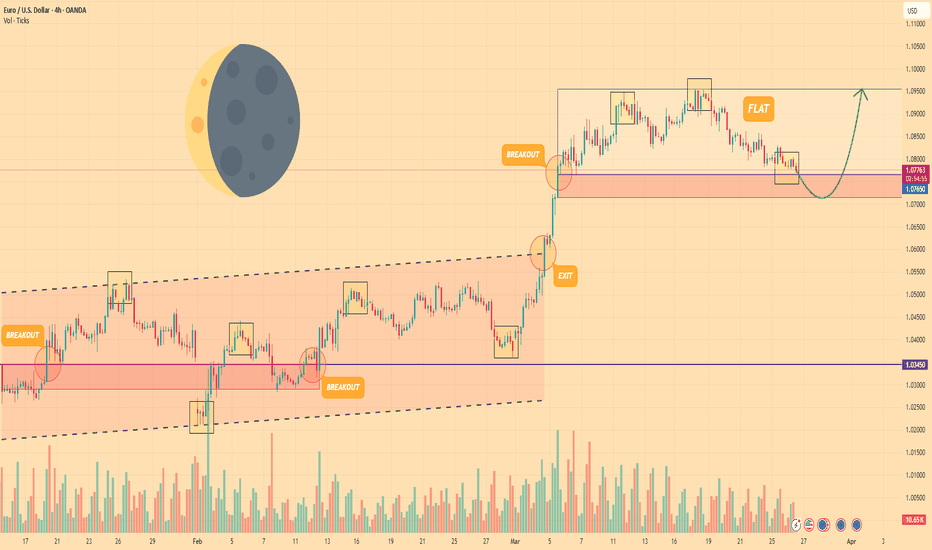
EURO - Price can correct to support area and rise to $1.0955Hi guys, this is my overview for EURUSD, feel free to check it and write your feedback in comments👊
Some days ago price started to grow inside a rising channel, where it broke the $1.0345 level and then it reached the resistance line.
Next, price made correction to support line of channel and then it quickly reached $1.0345 level and broke it again.
After this, price continued to grow in the channel, and later, it exited from it and rose to $1.0765 level.
Soon, price broke this level and started to trades inside flat, where it reached top part of flat and some time traded near.
Then it started to decline, so, now I expect that Euro can bounce up from support area and rise to $1.0955 points.
If this post is useful to you, you can support me with like/boost and advice in comments❤️
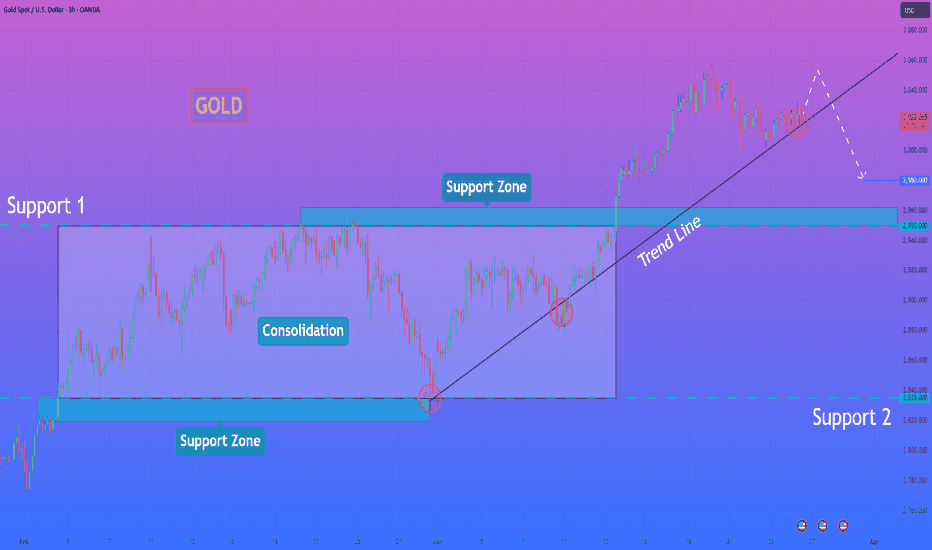
HelenP. I Gold will break trend line and continue to fallHi folks today I'm prepared for you Gold analytics. A while back, the price climbed to the level labeled Support 2, which also aligned with the support zone. After breaking through this level, it began to consolidate. This was followed by a retest, after which the price continued its upward movement and eventually reached Support 1 — a level that matched the upper boundary of the previous range. From there, a correction took place, bringing the price down to the trend line. Shortly after, gold resumed its climb and nearly reached the upper edge of the consolidation area again, but another correction to the trend line followed. Then, XAUUSD continued to rise, eventually reaching Support 1 and breaking above it, effectively exiting the range. Following this breakout, gold rallied to 3056 points before pulling back to the trend line. Since then, the price has been moving upward along this line. Currently, I anticipate that XAUUSD could rise to around 3050 points once more, then reverse and break below the trend line, continuing its downward move. In this scenario, my goal is set at 2980 points. If you like my analytics you may support me with your like/comment ❤️
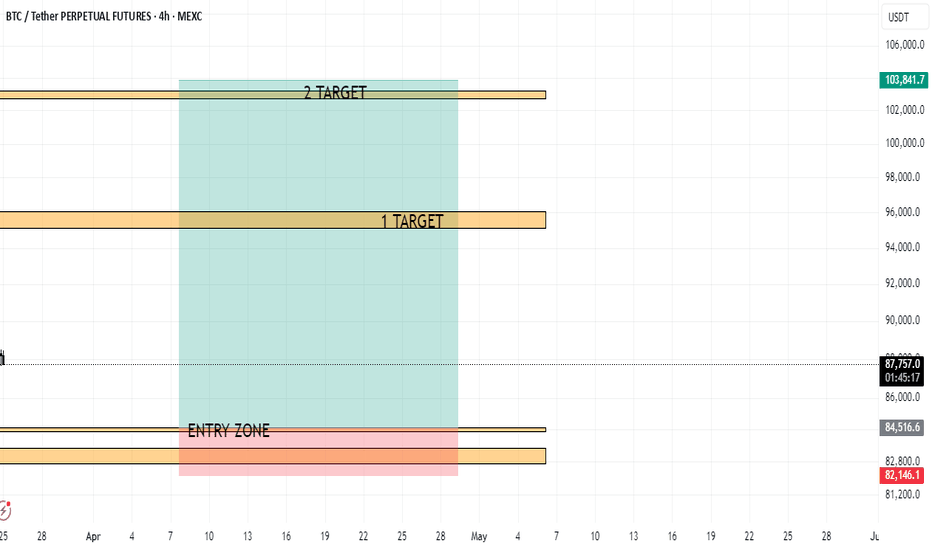
HelenP. I Bitcoin may grow to trend line and then drop to $82200Hi folks today I'm prepared for you Bitcoin analytics. Looking at the chart, we can observe how Bitcoin made a strong upward impulse, reaching the trend line and breaking through the resistance level that aligned with the resistance zone. After that move, the price began to decline within a wedge pattern and soon dropped below the same resistance level, effectively breaking it again. BTC then attempted to recover, climbing back up, but the growth was short-lived — the price failed to hold and fell toward the support level, eventually breaking below it and even dipping under the resistance once more. Following this drop, Bitcoin reversed and gained momentum. Shortly after, it broke through the 82200 level, successfully retested it, and continued moving higher. Later on, the price reached the trend line again — a level that also acted as resistance — but failed to break above and started pulling back from that area. At this point, I anticipate that BTCUSDT may retest the trend line once more before making a move downward toward the support level, potentially breaking out of the wedge pattern. For now, my goal is the 82200 support level. If you like my analytics you may support me with your like/comment ❤️
WhiteBIT Coin $WBT: Getting Ready for a New ATHMarkets often react to major events, whether political statements or high-profile initiatives in the crypto industry. For instance, the impact of Donald Trump’s economic policies and regulatory decisions on asset prices and the market capitalization of crypto exchanges has been widely discussed - coinmarketcap.com
In particular, market volatility following such developments has led to a decline in the market value of leading crypto exchanges. However, beyond global factors, internal ecosystem growth drivers also play a crucial role.
One such trigger could be the International Crypto Trading Championship (ICTC)—WhiteBIT’s trading tournament, which will be the first-ever global live-streamed trading competition.
What does this mean for WhiteBIT Coin?
Increased platform activity → higher demand for internal assets.
Greater trader engagement → potential impact on trading volumes and liquidity.
Media exposure of the event → attracting global attention to the WhiteBIT ecosystem.
Currently, WBT is trading at $29.20 (-0.26% over the past 24 hours), down 6.29% from its ATH of $31.16. However, given the growing interest in the platform and the impact of market supply dynamics, this tournament could act as a catalyst for reassessing current price levels. If exchange activity intensifies, it’s reasonable to expect that WBT could retest its ATH zone or even break through it.
Whether this scenario plays out remains to be seen. But one thing is certain—ICTC will be a key indicator of WBT’s momentum and overall market sentiment. 🔥
What are your thoughts? Will this tournament give WBT a new boost?
XAU/USD - H1 Chart - Trendline Breakout (27.03.2025)The XAU/USD pair on the H1 timeframe presents a Potential Buying Opportunity due to a recent Formation of a Breakout Pattern. This suggests a shift in momentum towards the upside and a higher likelihood of further advances in the coming hours.
Possible Long Trade:
Entry: Consider Entering A Long Position around Trendline Of The Pattern.
Target Levels:
1st Resistance – 3051
2nd Resistance – 3065
🎁 Please hit the like button and
🎁 Leave a comment to support for My Post !
Your likes and comments are incredibly motivating and will encourage me to share more analysis with you.
Best Regards, KABHI_TA_TRADING
Thank you.
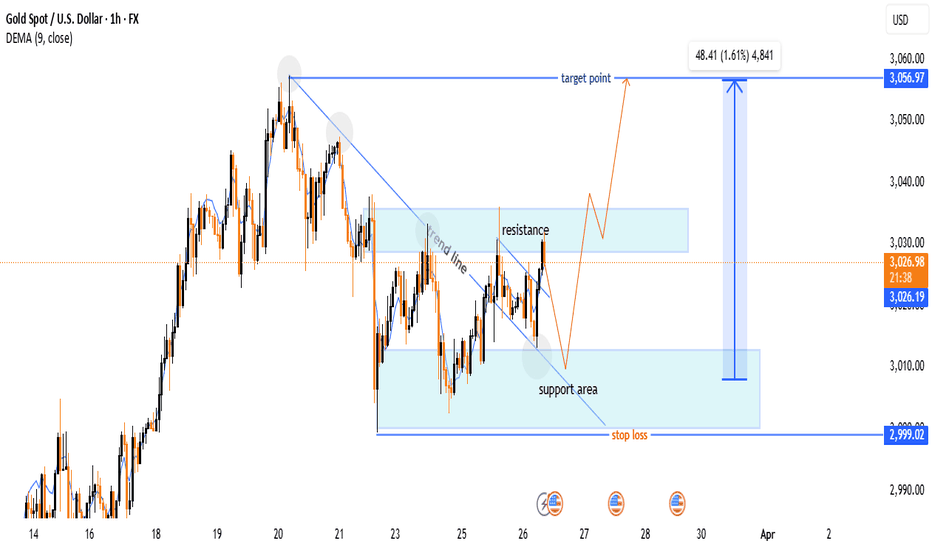
Gold (XAU/USD) Bullish Breakout – Trade Setup & Key Levels🔍 Key Observations:
🔹 Trend Line Breakout:
📉⬇️ A downward trend line was broken, signaling a potential bullish reversal.
📈✅ The price has moved above the trend line, confirming the breakout.
🔹 Support & Resistance Zones:
🟦 Support Area: $3,000 - $3,010 (Buy Zone)
🟥 Resistance Area: $3,030 - $3,040 (Sell Pressure)
📊 Trade Setup:
✅ Buy Plan:
🔄 Wait for a pullback to the support zone (🟦 light blue area) before entering.
🎯 Target: $3,056.97 📈🏁
🛑 Stop Loss: $2,999.02 ❌🚨
📈 Indicators & Confirmation:
📊 DEMA (9-period) = $3,026.48 (near the current price, suggesting a neutral-to-bullish trend).
🔥 Conclusion:
🔵 Bullish Setup Active 🚀
⚠️ Wait for price reaction at support before entering.
❌ If price drops below $2,999, the setup is invalidated.
📌 Final Tip: Watch for a bullish candlestick pattern 📊 at support before executing the trade! 🎯
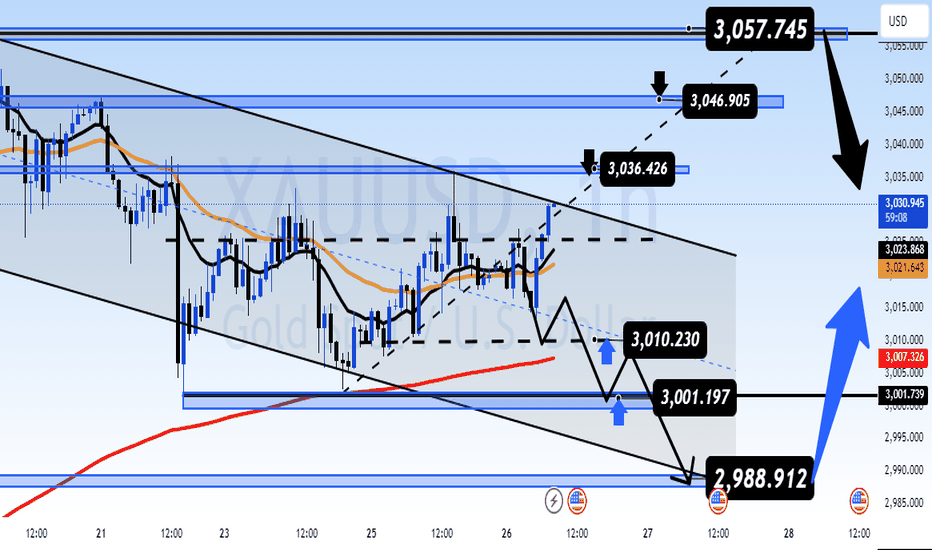
GDP Data in Focus – Gold Traders Prepare for Volatility⚠️ GDP Data in Focus – Gold Traders Prepare for Volatility
🟡 Market Brief – 27/03/2025
📰 Trump’s Latest Tariff Remarks Leave Markets Unshaken
Earlier this morning (end of US session), Donald Trump made new comments on tariff policy.
However, unlike previous occasions, his speech did not trigger significant market volatility.
He stated:
“Reciprocal tariffs will be eased, broadly applied to all countries, but not harshly.”
🔹 A 25% import tariff on cars will take effect from April 2
🔹 No additional tariffs for now on semiconductors or pharmaceuticals
→ It appears the market had already priced in this announcement, resulting in a muted reaction.
📊 Today’s Spotlight – Final US GDP (q/q)
This is the broadest measure of inflation, reflecting price changes for all goods and services included in GDP.
Given the weakness in recent US inflation indicators (CPI & PPI),
AD anticipates today’s GDP may also come in weaker than expected.
⚠️ However, market reaction might remain limited (≈30 pts),
as Core PCE data tomorrow is expected to be the true driver of weekly volatility.
🟡 Gold Strategy – Intraday Setup
Gold may retest resistance levels or recent highs,
before a potential strong move to the downside – the BIG SHORT scenario AD has been tracking.
📌 Plan for Today:
Look for intraday BUY opportunities during the Asian and European sessions,
especially near key support levels marked on the chart.
🧭 Key Technical Levels:
🔻 Support: 3019 – 3011 – 3002 – 2988
🔺 Resistance: 3036 – 3046 – 3056
🎯 Trade Zones – 27/03:
🟢 BUY ZONE: 3002 – 3000
SL: 2996
TPs: 3006 – 3010 – 3014 – 3018 – 3022 – 3026 – 3030
🔴 SELL ZONE: 3055 – 3057
SL: 3061
TPs: 3051 – 3047 – 3042 – 3038 – 3034 – 3030
🧠 Final Note:
This week’s volatility hinges on two major macro releases:
✅ Today’s Final GDP report
✅ Tomorrow’s Core PCE data
→ During Asia & London sessions: respect the levels and trade reactively
→ For New York session: stay alert — AD will update instantly if needed
Good luck, trade safe, and stay disciplined.
— AD | Money Market Flow
CHF/JPY Triangle Pattern (27.3.25)The CHF/JPY Pair on the M30 timeframe presents a Potential Selling Opportunity due to a recent Formation of a Triangle Pattern. This suggests a shift in momentum towards the downside in the coming hours.
Possible Short Trade:
Entry: Consider Entering A Short Position around Trendline Of The Pattern.
Target Levels:
1st Support – 169.06
2nd Support – 168.46
🎁 Please hit the like button and
🎁 Leave a comment to support for My Post !
Your likes and comments are incredibly motivating and will encourage me to share more analysis with you.
Best Regards, KABHI_TA_TRADING
Thank you.
Gold Outlook – Steady Range Before Key Data Hits🟡 Market Context:
Gold has been trading in a steady range since the start of the week, with no significant breakout or momentum shift observed.
Today’s session is expected to remain quiet, as there are no major economic events scheduled.
All eyes are on the Thursday GDP release and Friday’s PCE inflation data from the US — both of which are likely to determine the direction for gold into the end of the month and quarter.
📆 Key Data to Watch:
Thursday: US Quarterly GDP
Friday: US PCE Price Index (Federal Reserve’s preferred inflation gauge)
These events are considered high-impact catalysts that may trigger sharp moves in gold, especially if surprises occur.
🔍 Technical Structure:
Price continues to respect key support and resistance zones identified earlier this week.
There is no confirmed breakout yet, so the strategy remains range-based:
➡️ Trade the levels. Watch for reaction signals at extremes.
➡️ Wait for clearer momentum following the macro releases.
🧭 Key Price Levels:
🔺 Resistance: 3,010 – 3,036 – 3,046 – 3,057
🔻 Support: 3,010 – 3,001 – 2,988
🎯 Trade Plan – 26/03
BUY ZONE: 2988 – 2986
SL: 2982
TP: 2992 – 2996 – 3000 – 3004 – 3008 – 3015
SELL ZONE: 3045 – 3047
SL: 3051
TP: 3042 – 3038 – 3034 – 3030 – 3026 – 3020
🧠 Final Notes:
The market remains in accumulation mode ahead of key US data.
No need to rush — protect your capital, wait for clean setups, and let the market reveal its hand.
— AD | Money Market Flow
GOLD - Price can correct to support level and continue to growHi guys, this is my overview for BTCUSDT, feel free to check it and write your feedback in comments👊
Some time ago price started to grow inside a rising channel, where it reached the $2880 level and broke it.
Next price bounced from this level and some time rose in the channel, but then it made a correction, exiting from this channel.
After this, price turned around and continue to move up in another rising channel, where later it reached $3000 level.
Then Gold broke this level and made retest, after whcih it rose to resistance line of channel and then fell to support area.
Recently price started to decline, so, I think that Gold can decline to the support level and then bounce up to $3095
If this post is useful to you, you can support me with like/boost and advice in comments❤️
Euro can drop to 1.0650 points, breaking support levelHello traders, I want share with you my opinion about Euro. Earlier, the price was moving inside a range, bouncing between the boundaries and forming a buyer zone near the lower support area. After several rebounds, EUR started to grow and eventually broke out from the range, making a strong upward impulse. The growth continued with a breakout through the support level, which later turned into a support area. From there, the price continued its bullish trend, but after touching the resistance line, it turned around and entered a correction phase. Over the last few sessions, Euro has been forming a pennant pattern, trading between the resistance line and the support line. Now the price is consolidating near the apex of the pennant, showing weak momentum. I expect a false breakout to the upside, followed by a sharp decline from the resistance line. In this scenario, the price would likely break through the current support area and move toward the 1.0650 points - this is my TP1. Given the recent price structure, the correction phase, and the weakening bullish pressure, I remain bearish and anticipate further decline. Please share this idea with your friends and click Boost 🚀
USD/JPY(20250326)Today's AnalysisToday's buying and selling boundaries:
150.12
Support and resistance levels:
151.50
150.98
150.65
149.59
149.25
148.73
Trading strategy:
If the price breaks through 150.12, consider buying, the first target price is 150.65
If the price breaks through 149.59, consider selling, the first target price is 149.25
Shiba Inu (SHIB) Shows First Major Bullish Signal Amid Market ReAfter weeks of downward pressure, Shiba Inu (SHIB) (traded on WhiteBIT) has recorded its first notable bullish retrace, hinting at a potential trend reversal. The asset is currently trading near $0.00001337 and has successfully broken above the 26-day EMA—a key technical level that often signals the start of broader upward momentum.
This breakout is significant, marking SHIB’s first major move above resistance since February’s downtrend. The token’s local support now sits at $0.0000122, and if bullish momentum continues, SHIB could target the next major resistance at the 50 EMA ($0.0000145). A further push above this level could solidify the reversal.
Additionally, the Relative Strength Index (RSI) at 50.75 suggests growing buying pressure. A move above the 55-60 zone would reinforce the bullish setup and potentially trigger further gains. With market liquidity also increasing, traders seem to be re-entering SHIB, setting the stage for possible continued upside.
Bull Trap Confirmed: HOOD's 8% Rally Faces ExhaustionHey Traders after the success of our last month trade on Tesla hitting all targets more than 35%+
With a Similar Trade setup I bring you today the NASDAQ:HOOD
Short opportunity on Hood
Based on Technical + Fundamental View
-Market structure
-Head and shoulder pattern
-Currently will be trading at supply zone which was a recent support and now an ideal place for a reversal to create the right shoulder of the bigger head and shoulder pattern - Daily time frame.
1. Declining User Growth and Transaction-Based Revenue
2. Regulatory and Legal Challenges
3. Rising Costs and Profitability Pressures
4. Intense Industry Competition
5. Macroeconomic and Market Volatility
Technical View
Head and shoulder pattern - Pretty visible. Right shoulder is yet to be formed, Which makes an ideal place to SELL with a great Risk Reward ratio.
Pro Tip
Wait for a bearish candle stick pattern to execute trades on end of the day keeping stop loss somewhere above the supply zone.
Target 1 - 35.52$
Target 2 - 30.81$
Target 3 - 26.26$
Stop Loss - 44.72$
Fundamental View
1. Declining User Growth and Transaction-Based Revenue
Robinhood’s revenue model relies heavily on Payment for Order Flow (PFOF), which makes it vulnerable to fluctuations in trading activity. After a pandemic-driven surge in 2020–2021, user growth stalled, with monthly active users dropping 34% YoY to 14 million by mid-2022. Transaction revenue fell 55% in Q2 2022, and while assets under custody grew to $140 billion by Q2 2024, the platform’s dependence on volatile crypto and meme-stock trading amplified revenue instability.
2. Regulatory and Legal Challenges
The SEC’s scrutiny of PFOF and proposed trading rule changes threaten Robinhood’s core revenue source. In 2022, New York regulators fined Robinhood’s crypto unit $30 million for anti-money laundering violations. Ongoing legal risks, including backlash from the 2021 GameStop trading restrictions, have further eroded institutional trust.
3. Rising Costs and Profitability Pressures
Operating expenses surged due to aggressive marketing, technology upgrades, and compliance investments. Despite workforce reductions (23% layoffs in 2022), profitability remains strained. The company’s shift toward diversified products like retirement accounts and credit cards has yet to offset these costs.
4. Intense Industry Competition
Traditional brokers like Fidelity and Charles Schwab adopted zero-commission trading, neutralizing Robinhood’s initial edge. Newer platforms like Webull and Public.com also captured younger investors with advanced features, while Robinhood’s limited product range (e.g., lack of wealth management services) hindered retention of high-net-worth clients.
5. Macroeconomic and Market Volatility
- Interest Rate Sensitivity: As a growth stock, HOOD declined amid rising rates in 2022–2023 and broader tech-sector sell-offs.
- Recent Market Turmoil: On March 10, 2025, HOOD dropped 18% alongside crypto-linked stocks like Coinbase due to Bitcoin’s price volatility and fears of inflationary tariffs under new U.S. policies.
- Retail Investor Pullback: Reduced discretionary investing and crypto crashes (e.g., Bitcoin’s 71% plunge in 2022) dampened trading activity.
NOT AN INVESTMENT ADVISE
USD/JPY(20250325)Today's AnalysisToday's buying and selling boundaries:
150.25
Support and resistance levels:
151.62
151.11
150.78
149.73
149.40
148.89
Trading strategy:
If the price breaks through 150.78, consider buying, the first target price is 151.11
If the price breaks through 150.25, consider selling, the first target price is 149.73
XAU/USD Analysis: Bearish Pullback Towards $3,000 SupportXAU/USD (Gold Spot vs. U.S. Dollar) Technical Analysis - 1H Chart
1. Price Action & Trend Analysis
The market has been in a strong uptrend, characterized by higher highs and higher lows.
Recently, the price faced resistance near the $3,040 level, leading to a rejection.
A pullback is currently in progress, suggesting a possible retracement to a demand zone.
2. Key Levels
Resistance Zone (Supply Zone): Around $3,040 - $3,045 where price has been rejected multiple times.
Support Zone (Demand Zone): Around $3,000 - $3,005, a previous accumulation area.
Current Price: $3,023.695
3. Market Structure & Expected Move
The price tested the resistance zone, failed to break above, and is now reacting downward.
A bearish projection (as shown in the chart) suggests a potential move toward the $3,000 - $3,005 support zone.
If the price reaches this level and finds buying pressure, we could see a reversal or continuation of the uptrend.
4. Indicators & Confluence Factors
Support-Resistance Flip: The previous support at $3,000 could act as a strong support again.
Bearish Momentum: Short-term price action suggests sellers are gaining control after rejection at resistance.
Liquidity Zones: The highlighted purple zones represent institutional order blocks where significant buy/sell orders exist.
5. Trading Plan & Strategy
Bearish Scenario: If price breaks below $3,000, we could see further downside pressure.
Bullish Scenario: A bounce from $3,000 could provide buying opportunities for another attempt at breaking $3,040.
6. Conclusion
The market is currently retracing from resistance, and a short-term bearish move is expected toward $3,000.
Traders should watch for price reaction at $3,000 to determine if it holds as support or breaks for further downside.
Gold (XAU/USD) – Possible Reversal from Resistance XAU/USD (Gold Spot vs. U.S. Dollar) on the 1-day timeframe and shows an ascending channel with key price levels and technical annotations.
Key Observations:
Trend Direction:
The price has been in a strong uptrend since late 2024.
It is currently near the upper boundary of the ascending channel.
Liquidity & Market Structure:
INT.LQ (Internal Liquidity): This suggests an area where liquidity is expected to be taken before a potential move.
MB Unfilled (Market Balances Unfilled): These indicate inefficiencies in price movement that the market may revisit.
Projected Price Action:
The chart shows a potential short-term pullback from the upper boundary.
Expected retracement towards the "fair value range" around $2,800–$2,850.
If this scenario plays out, it would align with price rebalancing and a healthier uptrend continuation.
Key Levels:
Resistance: Around $3,050, which aligns with the upper trendline.
Support Zones: Around $2,950 and deeper at $2,800.
Potential Trading Strategy:
Bearish Case: If rejection occurs at $3,050, short opportunities could exist targeting $2,900–$2,850.
Bullish Case: If price retraces and finds strong support in the fair value range, it could resume its uptrend.
