Quick take on the S&P500From the very short-term perspective, the SP:SPX is currently stuck in a tight range. Waiting for a little breakout.
Let us know what you think in the comments below.
Thank you.
75.2% of retail investor accounts lose money when trading CFDs with this provider. You should consider whether you understand how CFDs work and whether you can afford to take the high risk of losing your money. Past performance is not necessarily indicative of future results. The value of investments may fall as well as rise and the investor may not get back the amount initially invested. This content is not intended for nor applicable to residents of the UK. Cryptocurrency CFDs and spread bets are restricted in the UK for all retail clients.
Analysis

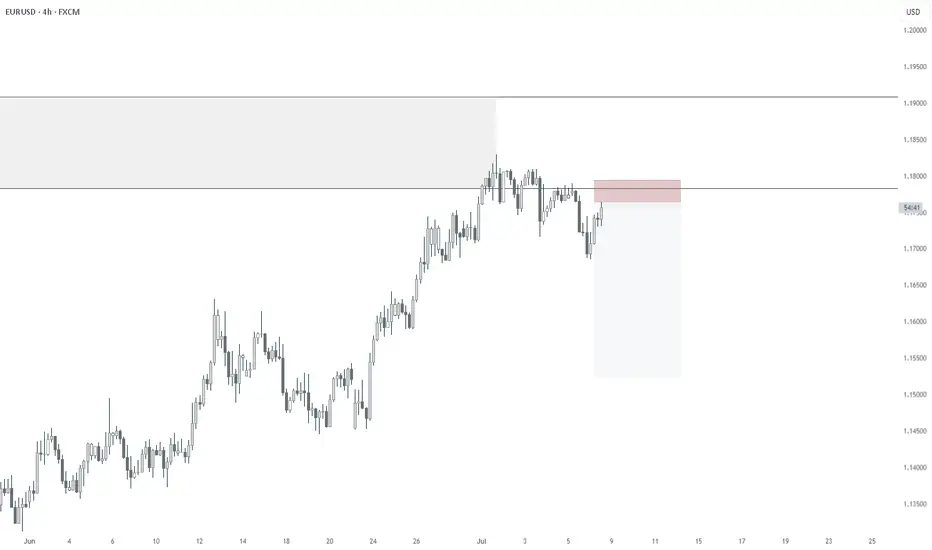
07/08/2025 - EURUSD - HEDGE SHORTHedge Short for FX:GBPUSD
COT Retailer still extended
We are on the higher timeframe weekly zone
Substructure is already confirmed bearish
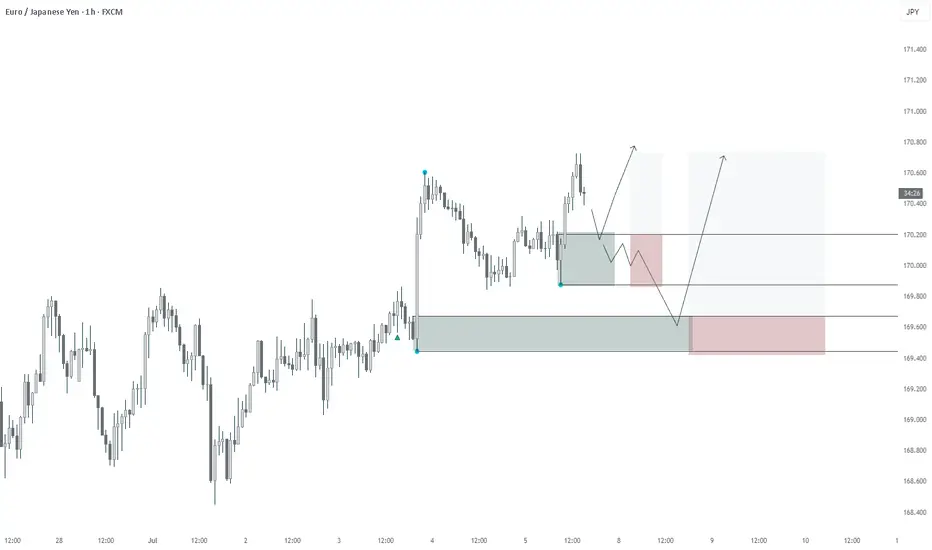
Fundamental Market Analysis for July 11, 2025 USDJPYThe dollar is holding steady at 146.500 against the yen: another rise in US yields and stable demand for safe US assets following comments from the Fed are fueling appetite for the USD, while demand for the JPY remains sluggish.
The tariff front exacerbates the imbalance: the White House has already imposed 25% tariffs on Japanese goods, and new ideas for “umbrella” tariffs are heightening fears of a trade war, forcing investors to flow into financing currencies. Reuters notes that the yen weakened to 146.400, recording a weekly decline of more than 1%.
At the same time, the Bank of Japan is not yet ready for aggressive tightening: a decline in inflation to 1.8% y/y and weak real wage dynamics make it difficult to raise rates above 0.5%. The divergence in monetary policy and expectations for Japanese macro data (machine tool orders, industrial production) until July 14 form the fundamental basis for the pair's growth to 147.500 and above, while the risks of correction are limited to the 145.900 zone.
Trading recommendation: BUY 146.500, SL 145.900, TP 147.500

XAG/USD (Silver) - Triangle Breakout (09.07.2025)The XAG/USD (Silver) pair on the M30 timeframe presents a Potential Buying Opportunity due to a recent Formation of a Wedge Breakout Pattern. This suggests a shift in momentum towards the upside and a higher likelihood of further advances in the coming hours.
Possible Long Trade:
Entry: Consider Entering A Long Position around Trendline Of The Pattern.
Target Levels:
1st Resistance – 3749
2nd Resistance – 3781
🎁 Please hit the like button and
🎁 Leave a comment to support for My Post !
Your likes and comments are incredibly motivating and will encourage me to share more analysis with you.
Best Regards, KABHI_TA_TRADING
Thank you.
Disclosure: I am part of Trade Nation's Influencer program and receive a monthly fee for using their TradingView charts in my analysis

Bitcoin Breaks All-Time High: What’s Next?Bitcoin (BTC) has once again captured the world’s attention by smashing through its previous all-time high (ATH). This milestone has sparked excitement and speculation across the crypto community and beyond. But the key question remains: Will BTC continue its upward trajectory, or is a correction on the horizon?
Long-Term Outlook: The Bullish Case
In the long run, the fundamentals for Bitcoin remain strong. Several factors support a positive outlook:
Institutional Adoption: More institutional investors are entering the market, providing greater liquidity and legitimacy.
Scarcity and Halving Cycles: Bitcoin’s fixed supply and periodic halving events historically drive long-term price appreciation.
Macro Trends: Ongoing concerns about inflation and fiat currency devaluation continue to make BTC an attractive hedge.
Given these dynamics, we believe Bitcoin’s long-term trajectory remains upward.
Short-Term Caution: A Correction May Be Coming
While the long-term view is optimistic, the short-term picture may be less rosy:
Overheated Market Indicators: Rapid price surges often lead to overbought conditions, increasing the likelihood of a pullback.
Profit-Taking: After breaking ATH, some investors may lock in gains, adding selling pressure.
Technical Resistance: Historical patterns suggest that corrections often follow major breakouts.
We anticipate a potential correction, possibly pulling BTC back to the $90,000 range. This adjustment could unfold in the coming week or weeks as the market digests recent gains.
What Should Investors Do?
Stay Calm: Volatility is part of the crypto landscape. Corrections are healthy for sustainable growth.
Focus on Fundamentals: Remember why you invested in BTC in the first place.
Consider Dollar-Cost Averaging: Spreading out purchases can help mitigate the impact of short-term swings.
Conclusion
Bitcoin’s break above its all-time high is a testament to its enduring appeal and the growing confidence of investors. While a short-term correction may be likely, the long-term case for BTC remains compelling. As always, prudent risk management and a focus on fundamentals are key to navigating the exciting—and sometimes turbulent—world of crypto.
Do not consider it as investment advice.
#crypto #bitcoin #analysis

GBP/AUD - Bearish Flag (10.07.2025)The GBP/AUD Pair on the M30 timeframe presents a Potential Selling Opportunity due to a recent Formation of a Bearish Flag Pattern. This suggests a shift in momentum towards the downside in the coming hours.
Possible Short Trade:
Entry: Consider Entering A Short Position around Trendline Of The Pattern.
Target Levels:
1st Support – 2.0671
2nd Support – 2.0607
🎁 Please hit the like button and
🎁 Leave a comment to support for My Post !
Your likes and comments are incredibly motivating and will encourage me to share more analysis with you.
Best Regards, KABHI_TA_TRADING
Thank you.
Disclosure: I am part of Trade Nation's Influencer program and receive a monthly fee for using their TradingView charts in my analysis.

Bitcoin can rebound up from support line of upward wedgeHello traders, I want share with you my opinion about Bitcoin. In this chart, we can see how the price dropped from the 102800 support level, which coincided with the buyer zone, and later entered to wedge upward. In this pattern, price made an impulse up from the support line of the wedge pattern and broke the 102800 support level, after making a retest, and continued to move up. Bitcoin rose to the current support level, which coincided with a support area and even entered this area, but soon turned around and fell below. Next, price rose to this area again and then made a correction movement, after which it turned around and made an impulse up to the resistance line of the wedge, breaking the 108000 level. After this movement, the price bounced from this line and fell back to the current support level, where it some time traded in the support area. Later price rebounded and continued to move up. Now, I expect that BTC can correct to support line of the wedge and then rise to the resistance line of this pattern. That's why I set my TP at the 112600 points, which coincided with this line. Please share this idea with your friends and click Boost 🚀
Disclaimer: As part of ThinkMarkets’ Influencer Program, I am sponsored to share and publish their charts in my analysis.

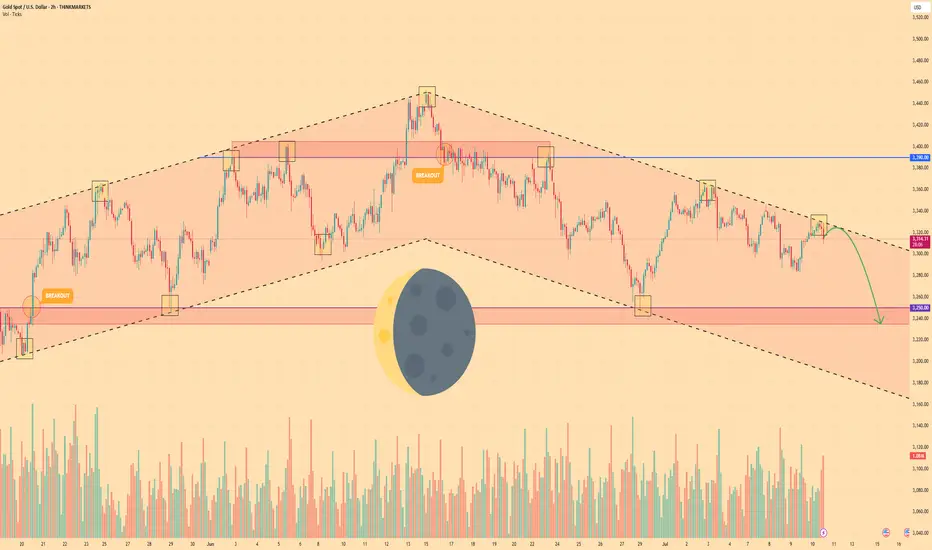
GOLD - Price can bounce down from resistance line of channelHi guys, this is my overview for XAUUSD, feel free to check it and write your feedback in comments👊
Gold broke out of its long-term rising channel and hit $3390 resistance level before momentum definitively stalled.
That failure marked a shift in control, as sellers forced price into a falling channel, establishing lower highs and lower lows.
Price fell to support level, after whcih it turned around and bounced up to resistance line of falling channel.
Now, Gold tests the upper boundary of the falling channel near $3318, where each bounce has been capped by declining volume.
Key support lies in the $3250 - $3235 area, aligned with multiple prior demand tests and the former rising-channel floor.
I expect Gold to reverse from the channel resistance and slide toward $3235, decisively breaking below the $3250 level.
If this post is useful to you, you can support me with like/boost and advice in comments❤️
Disclaimer: As part of ThinkMarkets’ Influencer Program, I am sponsored to share and publish their charts in my analysis.
Fundamental Market Analysis for July 10, 2025 GBPUSDEvent to watch today:
15:30 EET. USD - Initial Jobless Claims
GBPUSD:
The British pound remains under pressure amid increased risk-off sentiment linked to new White House statements about additional tariffs from August 1. This is boosting demand for the US dollar as a safe haven and prompts investors to take profits on long GBP positions.
Domestic factors in the UK also have a negative impact: revisions to social spending programs and weak manufacturing PMI and retail sales data signal a slowdown in economic activity. The Bank of England is expected to keep the rate at 5.50% until year-end, which limits the pound’s attractiveness for investors.
The current GBP/USD rate is 1.35900. In the absence of positive drivers from the UK economy and persistent demand for the dollar, the pair remains vulnerable to further declines toward 1.3520.
Trade recommendation: SELL 1.36000, SL 1.36300, TP 1.35200

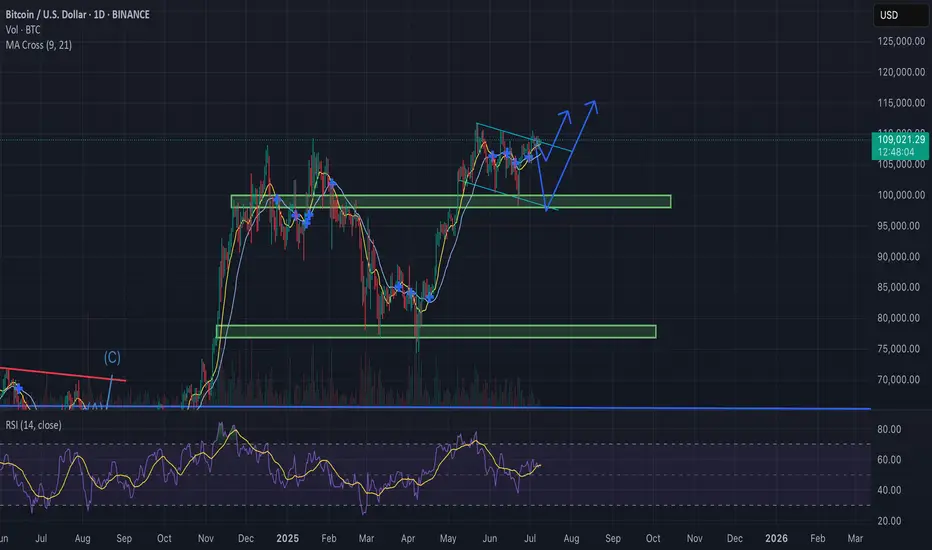
Bitcoin Update – Bullish Falling Wedge in Play?BTC/USD is currently trading near $108.8K, compressing within a falling wedge formation — historically a bullish continuation pattern, especially after a strong uptrend.
Why the Bias Remains Bullish:
Bullish MA Cross: Short-term MAs (9/21) are aligned for upside momentum.
Falling Wedge: Price compressing with lower highs and lows, coiling for a breakout.
RSI Strength: RSI (purple) remains elevated, supporting continued upside pressure.
Fundamental Catalysts:
Trump delays trade war announcements, reducing global uncertainty.
FOMC meeting in late July: Trump pushes for rate cuts, potentially bullish for risk assets like BTC.
If BTC breaks out above the wedge resistance with convincing volume:
Retest likely at ~$110K
Targets : $115K → $120K+
GOLD SELL M15Gold (XAU/USD) 15-Min Chart Analysis – July 9, 2025
The price is currently trading around the 3,295 level, after a recent Change of Character (CHoCH) and Break of Structure (BOS) indicating a shift from bullish to bearish momentum.
The market has formed a consolidation zone (highlighted in purple), suggesting a possible bearish continuation setup. Price is expected to retest the supply zone and then move lower.
Sell Setup Details:
Entry Zone: Inside the purple consolidation range (~3,295–3,297)
Stop Loss (SL): 3,305
Target (TP): 3,282
Key Support Levels:
3,292.16
3,288.16
3,282.39 (Main Target Zone)
This setup anticipates a bearish move after a rejection from the supply area, aiming for the liquidity zone near 3,282.

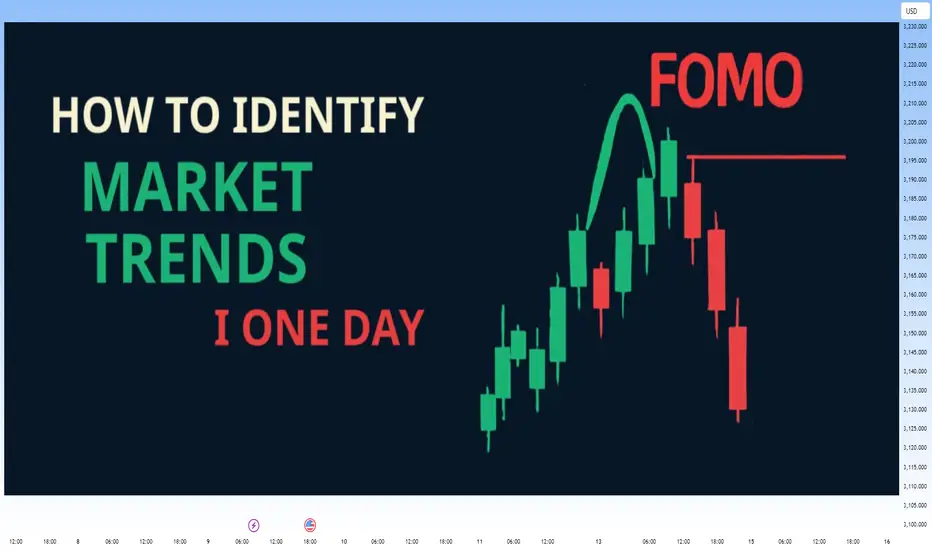
Analyzing the Market with Fundamental and Technical AnalysisAnalyzing the Market with Fundamental and Technical Analysis
In addition to technical analysis, it's important to consider fundamental factors that could influence the market. News releases, economic reports, and central bank decisions can significantly impact price movements.
Fundamental Analysis:
Keep an eye on major economic indicators like NFP, CPI, and interest rate decisions. These factors can drive the market and change its trend direction.
Technical Analysis:
Use tools like EMA, Fibonacci, and Price Action to confirm the trend and identify entry points.
For daily updates and comprehensive market analysis, join my MMFLowTrading TradingView channel, where I combine both technical and fundamental analysis to give you the most accurate insights.
Conclusion:
Identifying market trends in one day doesn’t have to be complicated. By using the right tools like EMA, Fibonacci, and Price Action on TradingView, you can make better trading decisions every day. To take your trading to the next level, join my MMFLowTrading TradingView channel for daily updates, real-time trend analysis, and expert trading signals.
Ready to start trading with precision? Join my MMFLowTrading TradingView channel today for daily market insights and trading setups. Stay updated with real-time analysis, get actionable trading signals, and take your trading skills to the next level. Follow me now on TradingView!
Is a Reversal on the Horizon or a Deeper Correction? 🔘Gold Faces Strong Resistance at 3300 – Is a Reversal on the Horizon or a Deeper Correction? ⭐️
Gold has recently faced a significant price correction after bouncing off key resistance levels. As geopolitical events settle and economic data comes in, the market is now testing crucial support levels. Today’s session could provide important insights into whether gold will maintain its bullish momentum or continue to correct further.
🔹Market Overview – USD Rebounds, Creating Short-Term Pressure on Gold
The US dollar has seen a strong rebound following positive developments in the global trade talks. Several key agreements between major nations, including the US, have been signed, which seem to support the USD in the short term. This has put downward pressure on gold, as traders shift their focus towards a stronger dollar and risk appetite returning to the market.
🔹US inflation data has come in lower than expected, creating room for the Fed to hold off on rate hikes, which helps the dollar further.
🔹FOMC meeting minutes later this week could reveal insights into the Fed's stance on interest rates, which could be key for market direction.
🔹Geopolitical tensions are cooling off slightly, which has reduced demand for safe-haven assets like gold.
🔹Technical Analysis – Gold in a Range-Bound Market, Testing Key Levels
On the H1 chart, gold is forming a clear downward channel between 3360 and 3290, suggesting that the price could continue its correction within this range. If the price stays within this zone, we might see a deeper pullback toward the 3250 region.
However, as always, waiting for confirmation signals before entering any trades is crucial. The false breakout risk is high when the price moves quickly and without clear confirmation from higher timeframes.
🔹Buy Bias in the Short-TermGiven the current technical structure, a buy bias seems more likely than further selling. The market may test 3320-3325 in the near term, with the potential to bounce back if the buying momentum continues to build. Additionally, the rejection wick on the D1 candle from yesterday suggests that sellers are losing control, and we may see more buying pressure in the coming sessions.
🔹Resistance and Support Levels to Watch:
🔺Key Resistance Levels: 3302 – 3310 – 3324 – 3335 – 3361
🔻Key Support Levels: 3275 – 3259 – 3248
⬜️Trading Strategy – Buy and Sell Zones
🔺BUY ZONE:3250 – 3248
🔹Stop Loss: 3244
✔️Take Profit: 3254 → 3258 → 3262 → 3266 → 3270 → 3280 → ????
🔺SELL SCALP: 3303 – 3305
🔹Stop Loss: 3310
✔️Take Profit: 3298 → 3294 → 3290 → 3286 → 3280 → 3270 → 3260
🔺SELL ZONE:3334 – 3336
🔹Stop Loss: 3340
✔️Take Profit: 3330 → 3326 → 3320 → 3315 → 3310 → 3305 → 3300 → ????
🕖Important Notes for Today: FOMC and Trade Policy Updates
With FOMC minutes and other important trade policy updates expected today, it’s crucial to stay alert for any sudden changes in market sentiment. Always ensure that you are adhering to your TP/SL levels to safeguard your account.

ETH/USDT 1W Chart📊 Trend structure (Price Action)
Downtrend (historical):
A series of Lower Highs (LH) and Lower Lows (LL) — a classic downtrend.
Confirmed by the orange downtrend line.
A change in structure — a possible beginning of an uptrend:
A Higher Low (HL) has recently been formed after a Lower Low (LL).
Suggests a possible end to the downtrend and an attempt to break out upwards.
Currently:
The price is testing the upper downtrend line.
A breakout above the orange line may confirm a trend change.
🟢 Key Resistance Levels (Green Lines):
Level Meaning
3.058 USDT Potential target after a breakout from consolidation
2.767 USDT Nearest strong resistance - currently being tested
3.427 USDT Deep resistance level from the previous high (HH)
🔴 Key Support Levels (Red Lines):
Level Meaning
2.234 USDT Nearest support - previous breakout
1.883 USDT Early 2023 support
1.507 USDT Local bottom
1.204 USDT Historical support - LL extreme
📉 Stochastic RSI (Momentum Indicator):
Currently in the overbought zone.
This may suggest a short-term correction before an actual breakout.
However, in a strong uptrend, the indicator may "hang out" in the overbought zone for a long time.
📈 Potential scenario:
If the breakout above 2.767 and the orange trendline holds:
A possible move to 3.058 USDT as the first target.
Extended target: 3.427 USDT (HH).
If the breakout fails:
Correction to 2.234 USDT or lower.
There is a risk of returning to a downtrend.
✅ Bullish signals:
Higher Low (HL) formation after Lower Low (LL).
Testing the upper downtrend line with an attempt to breakout.
Volume is increasing (based on candles).
⚠️ Bearish threats:
Stochastic RSI in the overbought zone.
Breakout not confirmed by 100% (needs a weekly closing candle above 2.767).
Resistance at 3,058 could halt the move.
📌 Conclusion:
Ethereum (ETH) could be on the cusp of a new uptrend, but a breakout above 2,767 USDT is needed for confirmation. If it does, a move to 3,058 and then 3,427 is possible. However, the current overbought level on the Stochastic RSI could signal a short-term correction before the trend gains strength.

$1 to $2.70 Swing Pick +150% gain so far in a weekHere is updated chart from what I shared with you past week on NASDAQ:VOR
Awesome runner!

GBP/USD - Bearish Channel (07.07.2025)The GBP/USD Pair on the M30 timeframe presents a Potential Selling Opportunity due to a recent Formation of a Bearish Channel Pattern. This suggests a shift in momentum towards the downside in the coming hours.
Possible Short Trade:
Entry: Consider Entering A Short Position around Trendline Of The Pattern.
Target Levels:
1st Support – 1.3545
2nd Support – 1.3485
🎁 Please hit the like button and
🎁 Leave a comment to support for My Post !
Your likes and comments are incredibly motivating and will encourage me to share more analysis with you.
Best Regards, KABHI_TA_TRADING
Thank you.
Disclosure: I am part of Trade Nation's Influencer program and receive a monthly fee for using their TradingView charts in my analysis.

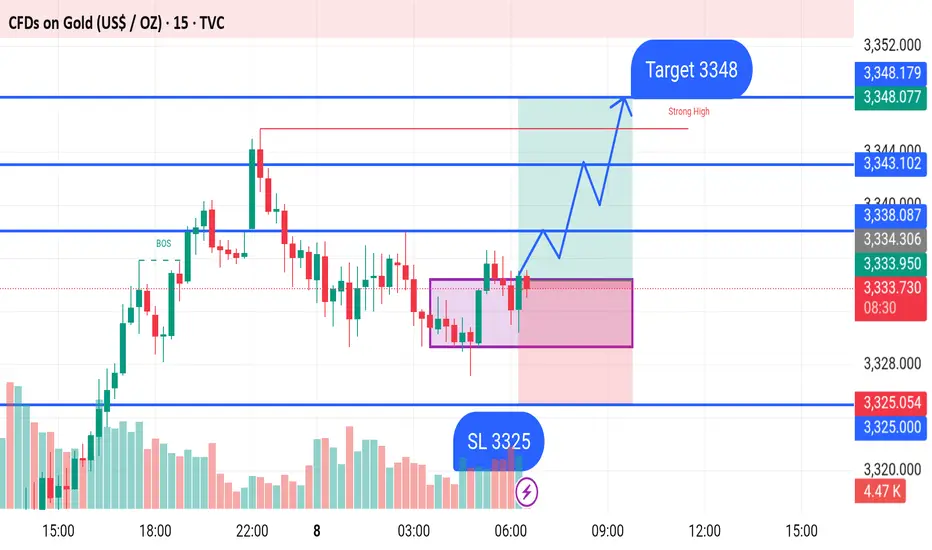
GOLD BUY M15 Gold (XAU/USD) Trade Setup – 15-Min Chart (July 8, 2025)
Entry Zone: Price is currently consolidating in a marked demand zone, forming a potential bullish setup.
Support Level (SL): 3325 – This is the stop-loss level, placed just below the support zone to minimize risk.
Buy Zone: Price is expected to rise from the current level after breaking out of the consolidation box (purple zone).
Bullish Structure: Price is forming higher lows and appears to be preparing for a breakout to the upside.
Target: 3348 – This is the marked resistance level and take-profit target, just below the "Strong High" area.
Key Levels:
Support: 3325
Current Price: Around 3334
Resistance Zones: 3343, 3348
Summary:
A bullish move is anticipated from the current price level, with an entry near 3334 targeting 3348. Stop-loss is placed at 3325 to protect against downside risk. Break of the immediate resistance could trigger upward momentum toward the target.
Fundamental Market Analysis for July 8, 2025 USDJPYThe yen remains under pressure from trade frictions. President Donald Trump has confirmed 25 percent tariffs on Japanese goods effective 1 August, fuelling U.S.-inflation expectations and reducing the odds of a near-term Fed rate cut. Ten-year Treasury yields have climbed above 4.45 percent, while the spread over equivalent JGBs hovers near 380 basis points—supportive for the dollar.
Japan’s domestic backdrop offers little relief. Nominal wage growth has slowed for a third straight month, and real household incomes have posted their deepest decline in twenty months. The weak earnings momentum complicates the Bank of Japan’s exit strategy and keeps ultra-loose policy firmly in place, encouraging further capital outflows from the yen.
Against this backdrop, USD/JPY is consolidating above its 100-day moving average around 146.40–146.50. Absent a sudden flight to safe-haven assets, the pair could break 147.00 in the coming sessions, while the 145.950–146.000 zone is widely viewed as an attractive area to add to long positions.
Trading recommendation: BUY 146.250, SL 145.950, TP 147.000

XAUUSDHello trader
Gold and the recent correction levels
Before the rally and never returning
This is one of the last opportunities to enter gold
In areas below $3,000
The final correction
If it occurs and the price enters the $2,700-$2,800 range
These are ideal buying areas.
Good luck to everyone.

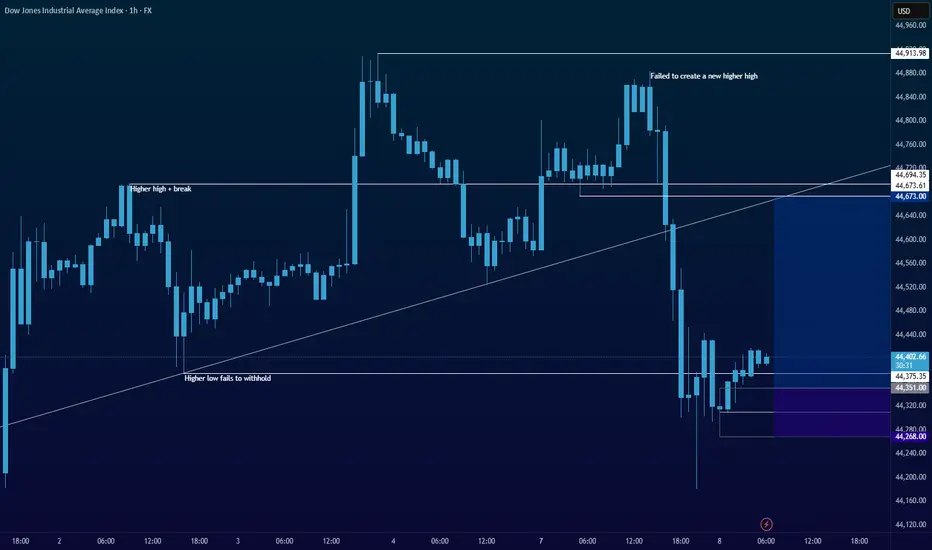
First obvious major clue may be stronger than the second.I think this shows a clear direction in price action. Strong moves addition to bullish trend line and internal structure. Now at the moment, I am looking at the trend line as a major attraction point in the current moment. Some opinions may say that it's more correct to sell down lower from the trend line, and that might be correct. Although, at this moment, price has yet to have a proper pullback after a clean breakout below. It might honestly just be too obvious that it'd go down lower after retesting trend line, so in my opinion, I think the most clear entry right now is to buy now at a low point, might as well be called a liquidity pool. So right now in this strong trend change, the next obvious major potential for move is going to be back at trend line. The next obvious move will be even more obvious, so then it might also be lacking stability, but until then, my focus here is to buy within a potential deep pullback.
EURNZD: Steep Channel continuation setupEURNZD continues to rise within a steep ascending channel, maintaining a well-structured sequence. No signs of exhaustion are evident yet, as bullish momentum remains strong and price action continues to respect both the midline and lower boundary of the channel.
This ongoing strength suggests that buyers remain in control, and unless we see a clear shift in structure, such as a break below channel support or loss of momentum, the trend remains intact.
🟢 Trend Bias: I remain bullish on EURNZD while price stays within this channel. Any pullbacks toward the lower channel boundary or previous breakout zones may offer continuation opportunities.
🎯 Target: My upside target is 1.983 , which aligns with the projected upper boundary of the ascending channel and makes a good technical target if the structure continues to hold.
🟥 Invalidation: A confirmed breakdown below the channel with follow-through would challenge this bias and signal the possibility of a deeper corrective move.
For now, the structure favors trend continuation over reversal.
Just sharing my thoughts on support and resistance, this isn’t financial advice. Always confirm your setups and manage your risk properly.
Disclosure: I am part of Trade Nation's Influencer program and receive a monthly fee for using their TradingView charts in my analysis.

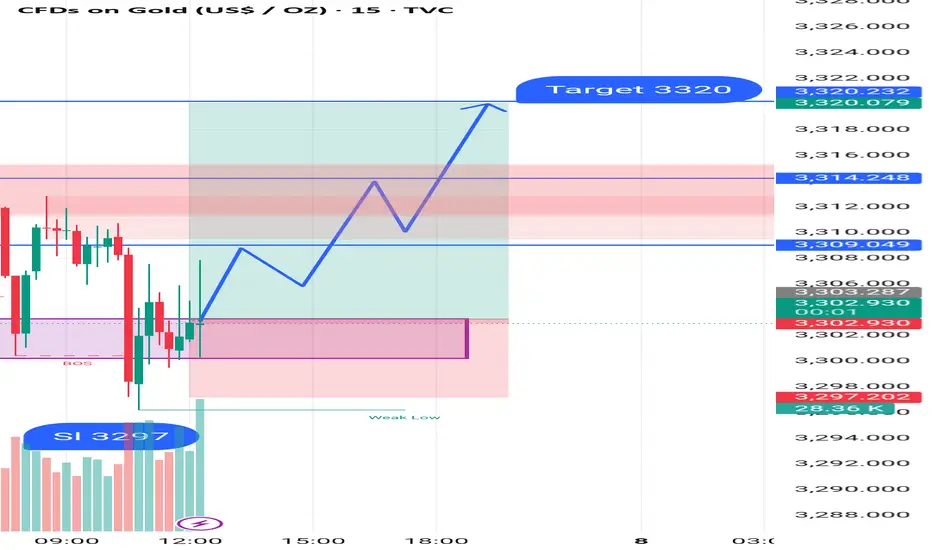
GOLD BUY M15 Gold (XAU/USD) Analysis – 15-Minute Chart
The price is currently showing signs of bullish momentum after forming a Break of Structure (BOS) around the 3297 level, which is also marked as the Stop Loss (SL) area.
After retesting the demand zone (highlighted in purple), the price has started to push upwards, suggesting a potential reversal. A bullish price path is projected, with expectations of higher highs.
Key Levels:
Entry Zone (Support): Around 3297 (SL zone)
Resistance Zones:
First Resistance: 3309
Second Resistance: 3314
Final Target: 3320
If the bullish momentum continues, the price is expected to break above the minor resistance levels and reach the target of 3320.