Harmonious growthThe upward movement occurs in a clear channel at confident volumes. Now the price is pressed to the local upper extremes. Based on this, continued growth is now very likely.
Analytics

ReboundOn the 4h timeframe a bullish pin-bar was formed. In the near future, it is quite possible to see a good rebound.

Possible false exit from the ascending channelOn the 1D timeframe, the recent downward movement can be considered as a false breakout of the ascending channel. The local picture is also quite bullish now, on the 4H timeframe. formed an inversed Head and Shoulders. Therefore, at the moment, while the price is within the boundaries of the ascending channel, an upward movement is most likely.

Price tests the main levelUnder the previous idea I wrote about the fact that the price is more likely to continue the upward movement. Now a bullish pennant has formed on the 4 o'clock timeframe, which confirms the bullish mood. Therefore, in the near future, we are likely to see another upward momentum.

Sideways or continued growth?An interesting candle is formed on the 1W timeframe. If the close occurs above 9765$, the uptrend is likely to continue. If not, then the stub may be delayed. Therefore, I am waiting for the weekly candle to close for further decisions.

The price goes upOn the 1D timeframe, an upward squeeze is formed, and a triangle with a flat top is formed. My priority is the upward movement as long as the price is kept within the triangle. If the price on the 1D timeframe is fixed below the lower border of the triangle, this will be a signal for correction, but for now the priority is ascending.

Wedge on NikeA wedge pattern was formed on the 1 hour timeframe. If the price manages to break through the support level of 85.97-87.32$, I expect a further fall.

The situation is not in favor of growthA wedge pattern is formed on the timeframe of 1 hour and 1 day. I expect the price to drop. Conservative entry into the short - from breaking the lower border of the wedge and/or from breaking the support level of 450.84-458.80$.

Expanding Triangle on BofAOn the 1 hour timeframe, the pattern of expanding triangle has formed, which indicates the readiness of the paper to continue the trend for a decrease. I expect a fall if the bears manage to lower the price below the support level of 20.89-21.52$.

The fall may continueOn the 1 hour timeframe, the flag trend continuation model is formed. If the lower border of the pattern and the resistance level is 85-87$ are broken, I expect a fall. Conservatively, you can enter the short from breaking the lower border of the flag.

Gold Pre Sell!This is my price prediction and I entered a short position carefully considering a solid risk management and stop loss. hopefully comes true.

The next move. Gold analytics.I expect a breakout and then a pull back to the yellow line. that's the best entry point to short Gold.

SNOW below 297.09As funds sell the big winners this may have more room down, thin volume that can find support around the 270.00 area.

DDOG over 99.61ConThis has moved well and been a nice trade up from the 90s and looks to continue beyond the psych level of 100.Confluence at the fib and VPOC at the 103.50 area can serve as a first target, second above at 110.92.

Lenta's stock price is expected to growConsider Lenta's shares on the London stock exchange. A wedge pattern has formed on the 1-month and 1-week timeframe. Globally, I expect this stock to grow .

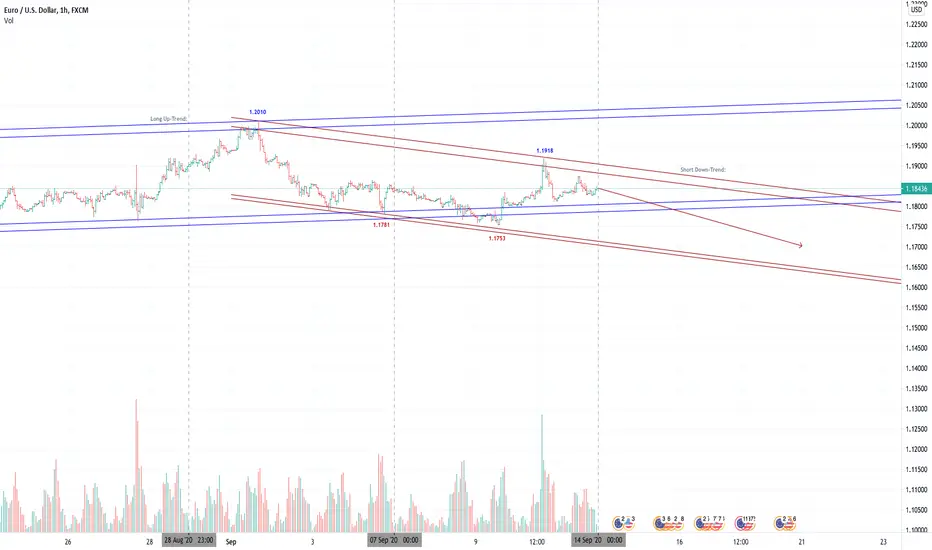
EURUSD - Down:Hello dear investors and fellow traders!
• Comment on last week:
The single European currency ended the last week on September 7-12 ambiguously, although by the end of the week the euro rose by 8 points.
Macroeconomic data, which came out better than expected, all turned out to be extremely negative, and the new restrictive measures caused by the spread of covid do cause our concerns. Thus, Austrian Chancellor Mr. Kurz announced Austria's entry into the 2nd wave of covid.
The positive reaction of the euro to Madame Marin Lagarde's speech was caused by the disappointment of market participants' expectations to hear a tougher stance on the strengthening of the bloc's currency.
However, this reaction did not last long.
"Improving economic data in the United States and its deterioration in the Eurozone, corrections in global stock markets, geopolitical tensions between the United States and China, Brexit, an increase in the number of covid cases in Europe, restrictive measures and a record large position of speculators on the growth of the euro.
All these factors make it impossible for the euro to move upward without additional intervention from the Fed.
The outlook is bearish. "
Manager, WMCI Europe Fund
Melnikov Sergey.
• Technical analysis:
H1
The shift of High and Low levels is lower than the previous indicators. The currency pair broke through the ascending channel, but returned and these attempts met a decent resistance - a local triangle was formed.
H4
The pair demonstrates a highly significant support zone for the bulls:
1.1766-1.1752.
D1
Euro continues to consolidate after the recent rally, moving lines have gathered together, rsi continues to decline, although the pair remains in an uptrend.
Respectfully
WMCI
Better Analytic tools for StrategiesWith the plethora of strategies' data one can generate with TradingView's tools and indicators, the risk of being overwhelmed by information is becoming a real issue, with the consequence of losing precious strategies' settings and backtest results, hence making bad trading decisions.
As one period's market condition is likely not the same as the previous one or the next one, the same strategy that worked for one period might not be profitable anymore, but failing to remember a specific situation will likely result in future losses. Therefore, it is becoming vital to be able to create a consistent log for those different result to in/validate a certain strategy and the related market conditions.
This is exactly the purpose of the SmartSave extension for TradingView (free) that I created.
The extension allows you to save and view all your strategies and their backtest results in one spreadsheet with the ability to filter and sort the data based on multiple columns (Profit, Ticker, Time frame, Buy & Hold perc., etc.)
This helps you create a permanent log of all your strategies, results and settings to make more informed decisions.
The extension enables you to export all your data in CSV and JSON.
With SmartSave extension, none of your data is leaving your computer (except bug reports).
Google "SmartSave extension for TradingView" and enjoy!
Side note: If you make use of the extension and like it, please give it a Like on the Chrome store.

Gold H4 - Short SetupGold H4 - Mixed signals from gold at the moment, currently consolidating after a nice selloff on our H4 support region (H&S we marked y'day). We have had a couple of attempts to push higher, but seems we have formed a consolidation range (effectively our flag). Waiting to see if we crack below this 1928 region to set new lows and break support, from here on the retest of 1928 we could look to jump in short.

EURJPY: GLOBAL 2.0Greetings dear followers!
We glad to present our system of technical analysis to finds out levels and we present levels by all popular timeframes free.
We will update it every month.
H4:
• Supports: 124.30, 123, 121.85, 120,31
• Resistance: 125.47
D1:
• Supports: 124.03, 122.70, 116.83, 114.63
• Resistance: non.
W1:
• Supports: 112.16
• Resistance: 127.16, 132.88, 134.10, 137.21
MN1:
• Supports: 101.67, 94.94
• Resistance: 142.09, 148.51, 156.14, 168.80
With Kindly regards,
WMCI

USDJPY: GLOBAL 2.0Greetings dear followers!
We glad to present our system of technical analysis to finds out levels and we present levels by all popular timeframes free.
We will update it every month.
H4:
• Supports: 104.79, 104.20
• Resistance: 106.21, 106.65, 107.36, 107.87
D1:
• Supports: 104.44, 102.68, 101.15
• Resistance: 109.71, 111.72, 112.20
W1:
• Supports: 101.15
• Resistance: 114.21, 115.21, 118.04
MN1:
• Supports: 96.83, 85.89, 76.07
• Resistance: 122.03, 125.29
With Kindly regards,
WMCI

GBPUSD: GLOBAL 2.0Greetings dear followers!
We glad to present our system of technical analysis to finds out levels and we present levels by all popular timeframes free.
We will update it every month.
H4:
• Supports: 1.3017, 1.2954, 1.2893, 1.2768, 1.2648
• Resistance: 1.3172
D1:
• Supports: 1.2720, 1.2643, 1.2079, 1,1475
• Resistance: 1.3170, 1.3220, 1.3480
W1:
• Supports: non.
• Resistance: 1.4274, 1.4631, 1.5786
MN1:
• Supports: non.
• Resistance: 1.7184, 1.9319, 2.1168
With Kindly regards,
WMCI

EURUSD: GLOBAL 2.0Greetings dear followers!
We glad to present our system of technical analysis to finds out levels and we present levels by all popular timeframes free.
We will update it every month.
H4:
• Supports: 1.1711, 1.1590, 1.1541, 1.1460
• Resistance: 1.1907
D1:
• Supports: 1.1426, 1.1201, 1.0773
• Resistance: 1.1907
W1:
• Supports: 1.0894
• Resistance: 1.2070, 1.2474, 1.3966
MN1:
• Supports: 1.4932, 1.5840
• Resistance: 0,8495
With Kindly regards,
WMCI

Growth continuationOn local timeframes, we have an extremely organic upward movement on large volumes. Today, there was a correction and retest of the global, mirror support zone, which was previously the main resistance zone. Therefore, in the near future, continued growth looks very likely.
