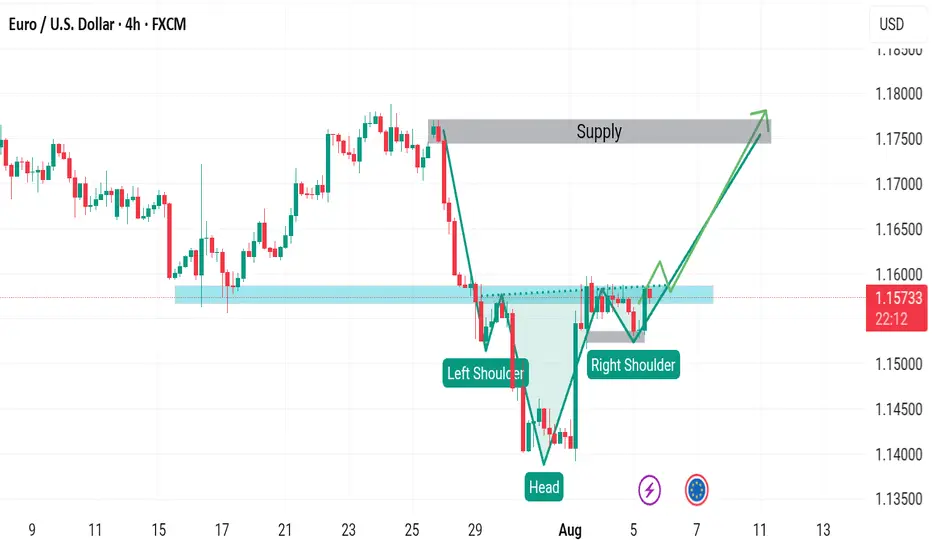
EURUSD BUY SETUPThe price will form a head and shoulders pattern because the candle in the second shoulder is very strong, which indicates that it will break the neck of the pattern. We also have a stronger bounce from below, so I expect an uptrend.
Analyze
USD/JPY AnalysisOn the daily timeframe, a downward movement toward the 147.014 level is expected, followed by a short-term upward move projected to reach 153.550
This analysis is brought to you by the FXonbit Traders Team

GBPJPY Bullish After RetestI see that GBPJPY will experience a decline and enter the demand area, our plan is to take a BUY setup if the price enters the demand area with a realistic target of 1: 2, setup, see chart image. Thank you happy trading.
Note: this is not trading advice. All risks are not our responsibility. Secure your account.

SOLUSDT 4H SHORT Hello traders, today I see that Solana needs time to return to the price of 88 USDT. I decide to enter at 97 USDT, but as you can see, the stop loss is very small to recover in the next trade. The profit target for this setup is 10% as the first goal and 28% as the second goal. I am basing this on Fibonacci and order block zones. Good luck.

#YFIIt is moving in a short-term ascending channel, and this upward correction can continue the downward trend until the specified areas. Therefore, with a pullback to the upper area, it can continue the downward trend.

#EURUSDAccording to the previous analysis, the EURUSD currency pair has started to correct around the resistance zone, which after a complete cycle can continue the trend in the specified support zone to retest the previous ceiling. But to confirm the continuation of the process, you have to wait for a double floor, one floor higher to continue the path. In the open time, this continuation of the movement path can be continued up to the range of 1.14.

#Pepe | #Usdt | Buy Zones#PEPE is a meme coin with a very high risk, as a result, you should know that the money you invest for this currency is likely to reach zero, so buy a small amount of this currency in good areas.

#BTC | #Usdt | WEEKLYBitcoin is currently supported by MA 192 on the weekly time frame
After this dynamic support, the next support is the area of 25250 to 23950
And the resistance area is 31294~32400

#BTC | #Usdt#BTC In the time frame of 15 minutes, it is located in a rectangle
The ceiling of this rectangle is the price area of 27756.6 and the price floor of this rectangle is 27282 ~ 27339.7
If the rectangle breaks upwards, the price can rise up to the green lines indicated in the chart

#Pepe | #UsdtIt is located in a rectangle in the time frame of 5 minutes
The ceiling of this rectangle is the price area of 0.00000207903 and the price floor of this rectangle is 0.0000015 ~ 0.00000153352.
If the rectangle breaks upwards, the price can rise up to the green lines indicated in the chart

#Btc | #UsdtBitcoin is in a bullish channel on the one-hour time frame
And its momentum in the one-hour time frame is upward, but apparently its energy has decreased
The first static resistance in the area of 30041~29977
Next static resistance area 30532~30763
And it has a very strong daily resistance in the area of 31245~32707

#PEPE | #Usdt#PEPE currency was able to break the key resistance of 0.0000015 in the 15-minute time frame, and it is currently in an ascending channel, if the support price falls, it is indicated on the chart.
And if the price continues to rise, the resistances are also indicated in the chart.

FTM USDT CHART ANALYSIS WITH PROFFESIONAL COACH The FTM/USDT cryptocurrency pair is currently showing a bearish trend and may continue to decline towards the zone of 0.3900. Please note that cryptocurrency markets are highly volatile and can change rapidly. It's important to conduct thorough research and exercise caution when making investment decisions."

What is the golden rule of taking profits?
For trading stocks, futures, or forex, taking profits is also part of the trading process. For investors, taking profits and adhering to it during a trade is effective. When to take profits? Where is the best position for stop loss and take profit? Which strategy is more profitable? Taking profits and stop loss is one of the most important aspects of trading. If not handled properly, it could lead to losses. In previous articles, we have discussed the rule of stop loss. This chapter will discuss the rule of taking profits.
Investors are advised to follow and read this article. If it is helpful, please give it a like. Thank you.
Methods of taking profits
Taking profits means closing the position and securing profits when the trading goal is achieved to prevent market reversal. Taking profits can be divided into static and dynamic methods.
Static taking profits means setting a target for taking profits and closing the position when the target is reached. For example, if the profit expectation is 100 points and the price has risen 100 points, the position is closed to take profits. The target for taking profits is fixed and static.
Dynamic taking profits means the profit target is dynamic and is held until the price meets a dynamic standard before closing the position. For example, when holding a long position and floating profits, close the position when the market price breaks the bearish level. Traders cannot know in advance where the bearish level will appear and need to monitor the market dynamics.
Next, we will discuss five methods of taking profits.
Method 1: Fixed point profit taking
This is the simplest method of static taking profits. After entering the position, set a fixed profit space. This profit-taking method is more suitable for intraday and short-term trading. For example, after entering an intraday trading position, set a fixed profit-taking point of 50 points.
Intraday trading has a relatively obvious characteristic of fluctuating trends, and market prices tend to rebound and even fluctuate repeatedly. The profits from holding positions during market rebound may be given back, so setting a fixed profit-taking point can be more advantageous during trading.
In practical trading, the number of fixed stop-loss points should be set according to the volatility of different products. For products with high volatility, set a larger number of fixed stop-loss points, and for products with low volatility, set a smaller number of fixed stop-loss points.
Please note that this method should not be underestimated simply because it is simple. Whether this method is useful or not depends on the specific usage environment.
Method 2: Fixed profit and loss ratio take profit. This is a commonly used static take profit method in medium and short-term trading. First, let's talk about the profit and loss ratio. The ratio of the profit space of an order to the stop loss space is the profit and loss ratio. For example, if the profit is 100 points and the stop loss is 50 points, the profit and loss ratio is 2:1. Fixed profit and loss ratio means that the take profit is set according to a fixed ratio based on the stop loss space. For example, if the stop loss of an order is 100 points, setting the take profit at 100 points results in a profit and loss ratio of 1:1. Setting the take profit at 150 points results in a profit and loss ratio of 1.5:1. Setting the take profit at 200 points results in a profit and loss ratio of 2:1, and so on. The fixed profit and loss ratio method is easy to operate and highly executable. Moreover, when the market fluctuates and the stop loss space expands, the take profit space will also expand accordingly, making it very flexible.
Method 3: Take profit combined with technical indicators. This is also a static take profit method. After entering an order, the take profit is set based on technical indicators. For example, setting the take profit at the level of previous highs and lows, or at the support and resistance levels of the Bollinger Bands or important moving averages, is feasible. In addition, in practical trading, it is common to enter and exit at small time frames while looking at the support and resistance levels of larger time frames. For example, entering at the 5-minute level and setting the take profit at the support and resistance level of the 1-hour chart, or entering at the hourly level and setting the take profit at the Bollinger upper and lower bands of the daily chart, is essentially a logic of "going small and looking big".
Method 4: Take profit following the trend. This is a dynamic take profit mode and a trend-based take profit strategy. After entering an order, the position is held following the trend indicator, and the position is held until a reversal signal is issued, at which point the take profit is closed. Tracking with trend lines, channel lines, and turning points in the market are all common practices in daily trading.
Method 5: Combination of multiple methods, batch-wise profit taking.
The above four methods are the most mainstream and commonly used methods, but each method has its pros and cons.
For example, the fixed profit and loss ratio method cannot hold onto trend profits, and the trend tracking method cannot make profits in volatile markets. Therefore, some clever traders combine these methods and take profits in batches.
For example, after the order is entered, when the profit and loss ratio reaches 1:1, part of the position is closed, and the remaining position is exited using the trend tracking method to achieve greater profits.
In practical trading, traders can combine the above profit-taking methods in different ways, such as combining the support and resistance levels of the previous high with the fixed profit and loss ratio, or combining the support and resistance levels of the previous high with the trend tracking method.
After discussing these five profit-taking methods, it is only providing traders with an idea, and the specific results of practical trading must be reviewed and analyzed in combination with their own trading systems.
OANDA:XAUUSD FXOPEN:XAUUSD

DXY visionhello
my analyze on DXY chart is a bullish channel
price hit top of channel and then goes down, 1 week ago hitted an Support(Was Resistance before) and react to it, now i can goes top again or break it and then goes to bottom of channel.
also here it is 0.618 Fibo from last bullish wave but price have bearish momentum ,
lets see what will happen and waiting for confirmations.
Hope you enjoy this analyze and like it,
comment your idea about DXY.
Follow for more analyze.

Weekly Outlook - SMC Daily AnalysisWeekly Outlook + Daily Analysis for AUDUSD
Daily Chart
s3.tradingview.com
After a reaction from a flip zone on the daily decisional demand we can see that more recent price action caused a daily change of character. At this point, we can start to anticipate the possibility that the higher time frame is going to turn around and continue the swing trend bearish.
4hr Chart
s3.tradingview.com
After a daily bos or change of character we can now expect a retracement to a daily discount level (if not a sweep if the daily high to form a failed higher high on the daily)
We can see that the 4hr is clearly bullish, heading to a deeply discount range, if not to clear the daily high.
15m chart
s3.tradingview.com
Here is the general expectational order flow that we can look for trade setups within. We understand "what should happen" while simultaneously trading "what is happening" , in other words lets continue to trade with the 4hr and 15m trends until we get a very clear indication of market reversal.

GBPUSD October 11th 2022i saw today news at 2am NY time market not really moving and clear low that been form on 30 sept 2022 and at 5m TF i saw that BMS to upside at 3am..so im entry when it retrace to FVG at 5m TF
my target is Monday high cause market CLEARLY make equal high on Monday

BAL is Ready For LONG PositionBAL /USDT is Going to get a good setup for LONG POSITION
you can get this position with LEV7 X
Good Luck & dont forget to set SL & TP


What will happen to wti?hello guys!
as you may know, yesterday oil decreased a lot and for a commodity like oil, average weekly movement is 80 pip (weekly atr=80) but this week, wti move 140 pip so far, so I predict that this 2 remaining days it will to correct last move and when touch that gray zone and trendline at same time, moving downward until the demand zone.
thank you for your attention.
good luck

EURUSD 1H this is my eurusd analyze, tell me ur opinion :)
i think we can whait a few more days/weeks and then, after it touch rezist, short :)

How to analyze any market from scratch #3Hello everyone:
Many of you have asked me to continue making more of these analysing from scratch video, so I have prepared another one here for you today.
Not only will we refresh the previous 2 educational videos on this topic, I will go into a bit more details on the confirmation on the lower time frames with multiple examples in the chart.
Recall from the previous videos I made, when we want to analyze the chart from scratch, we always start:
1. From the higher time frames (HTF) to identify the impulse/correction phases of the market conditions so we can come up with a possible bias and direction of the current price.
2. Once we have a possible direction and bias, then we go down to the lower time frames (LTF) to also identify the impulse/correction phases which will lead to your confirmation and entry.
These are simple steps to follow, based on multi-time frame analysis, top down approach.
Many have told me it's not hard to identify the HTF’s impulse and correction, but what can be classified as a LTF confirmation before entry?
Let's take a detail look into a few examples:
A LTF confirmation is when the price is developing a few more price action structures/patterns that align with your HTF direction and bias.
These can be continuation/reversal corrections on the LTF; impulse phases on the LTF that go with your bias on the HTF; multiple corrections within the larger corrections (patterns within patterns)...etc.
The more of these LTF price actions you can identify, the more it strengthens your analysis and forecast on the HTF.
Thank you
Do check out my previous educational contents on this same topic to better learn my approach to analyse any market from scratch.
How to analyze any market from scratch #1
How to analyze any market from scratch #2

GBPUSD, 45 Short positionThe price downwards and fixes in the short zone. Potential price movement to the zone in the chart. That's my opinion to survey and follow.
