AND

NZDUSD good time for sellGBPUSD reached resistance line and broked the up trend. now you can place a sell order. if you like my idea please like ,comment and share . thank you


Possible Cup & Handle forming for Siacoin Hi all,
Main TA Points;
***
1. Golden Cross Formed.
2. Seem to have found support at the 61.8 FIB.
3. Descending triangle invalidated.
4. Breakout accompanied by strong volume.
5. Promising fundamentals.
6. Find bottom indicator as well as MACD suggest return to uptrend likely.
7. Ichimoku offering support as well.
***
Talking Points;
***
A promising project and team that has delivered a working product for some time. Fundamentally speaking a strong contender, and according to my estimations not at risk of SEC attention as they did not hold an ICO. Siacoin is not to be mistaken for Siafunds which are in fact securities and have been sold as such.
We recently had a significant break out early January with higher time frames suggesting that S/R flip has occured.
The current support of 61.8 fib does seem to be painting a cup. The fib retracement has been set from the high of August of 2020. The current local high has exceeded this. We could expect the handle to be formed as a retest of Augusts high and subsequent longs could be placed from the break of the neck line with stop loss just below handle at 88.3 fib as a guide. Example trade would offer 3.34 R/R ratio.
***
Estimates;
***
The run up to 1 US cent might have a retest of the 0.007 range, but short to mid term targets based off historicals would suggest as a run up to the 1 US cent range as the stronger resistance.
Price action expected to occur over the next 14 days.
Good luck,
***
***
Any trading advice provided has been prepared without taking into account your objectives, financial situation or needs. Before acting on the information provided you should consider the appropriateness of the information, having regard to your objectives, financial situation and needs. You should seek professional personal financial advice before making any financial or investment decisions.
All investment and trade decisions, no matter how well investigated, involve risk.
***

Bull Trap? Possible Head and Shoulders Down to $254xxBTC topped at 34800, then created a right shoulder of a smaller H & S that triggered last night. But whales usually signal the end of selling with a really large red volume candle. The drop this morning produced a long red volume candle, but not incomparable to the price candle, so I don't think this is the end. Correction? End of the rally? I won't try and call that but we do have another H & S forming (see one hour chart) which would take us down to 25424, probably tonight. I know we are in bull territory still but I am highly suspicious of this bounce. It may reach as far as 33000ish.
Care in trading is required as this is a crossroad move. Normally, bull cycles end with a 25% drop. This would make 27%. Be sure to secure profits for a re-buy much later if need be.
Also of note, I see no bullish divergence on the RSI as of yet, giving credence to the bull trap theory. This H&S is negated if BTC is able to rise above $34800.

macro week bounce zonedepending on how we play out for the next couple days. Watch for that 21k i was speaking of

Break and rest There was a strong resistance area that was never tested , and we have a support trendline now we just waiting for the golden third touch.


BTC possible head and shoulders possible head and shoulders pattern on the 30M and 1H. we will reach 25k on the 25th

XRP - Reality Over 350 financial institutions use Ripple's payment network, RippleNet, to receive payouts in more than 40 currencies across 55-plus countries. The present RippleNet members settle transactions in three to five seconds, compared to the hours or days it could take traditional services.
Ripple has the $ and resources to hire the best lawyers on the planet... that will happen. Combine this all with the fairly WEAK accusation that the SEC has brought forward... we will see short-term volatility YES - but I believe that XRP will prevail in the long term... especially if they win their case. XRP is a utility token, if you acknowledge XRP as a utility token for network usage, it’s nearly impossible to classify it as a security. The SEC's entire case is paper thin. I believe that the SEC is using XRP to place fear into the crypto community.

audjpy head and shoulder pattern long Time Trade #TradeWithMky
AuDJpy if pass this channel would be bullish for long time
there are some good signals for head and shoulder pattern in AUDJPY right now
so its good time to Go Long
actually head and shoulder would be more confirmed if these things happen
1 : at the end of a Movement
2 : confirmed channel for neck line
3 : pull back after passing neck line
goodluck !

BBY-0.682*LOW $LOW Lowe's Companies vs. $BBY Best Buy CoQuantamental Tools for Proprietary and Retail Investors.
Statistical Arbitrage Opportunities Delivered to Your Inbox.
QuantChart. io
Long 1000 $BBY
Short 682 $LOW
Mean Reversion Time: 12 Trading Days

Inverted Head and should One more example of Inverted head and shoulders pattern which is change in the trend . Neckline is already broken and one can pick this stock and keep stop loss below neckline

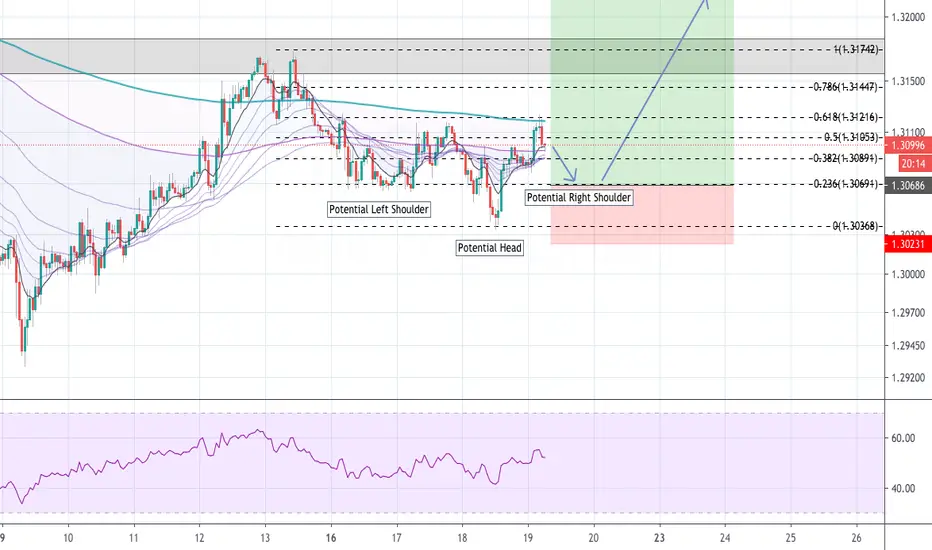
NZD/CHF Swing H&S Forming?Possible Head and Shoulders on NZD/CHF!
Lets keep watching this pair and see what happens!
DovyFX

USDJPY Potenitial bearish setup.on the 4hr timeframe i saw an ascending channel which which broke to the downside which was below the daily resistance i had drawn .


Chainlink Posible cup and handle forming *Disclaimer: no soy analista financiero ni son consejos de inversión, solo soy un gamer jugando al trading.

Great Strategy for even Beginners! Need help? AskThis strategy uses a EMA Crossover of 5 &10 on the short side and both a 100 & 150 EMA Trendlines to as kind of testing levels
It also uses a Bollinger Band of 100 on the hl2 source instead of closing price
It also features an RSI of BOTH 10 and 100 EMA lines and a stochastic of K 14 D 3 and Smooth of 1
Using both the RSI and Stochastic can determine whena trade is both OVERBOUGHT/OVERSOLD & when the pair is about to or beginning to reverse
Please message me if you need any assistance in using this.
GOOD LUCK TRADERS!


Devouring Netflix with Point&Figure analysis. Market Top. SHORT.Netflix hit an all-time high, then corrected. It crept below the uptrend line but didn't generate a sell-signal below it. It passed back above the uptrend line but hit the resistance roof. Again, it just crept below the uptrend line but without a sell-signal, suggesting that the trendline is acting as support, albeit loose support. The price climbed above again but then broke the uptrend line and generated a Double-Bottom sell-signal.
Following the double-bottom sell, it fell by a further two boxes before being supported by the original uptrend line. It then rallied upwards but couldn't reach the second uptrend line which suggests this trendline now may switch to a resistance role. The price sunk below the original trendline for the first time and generated another double-bottom sell at the level of penetration, falling a further two boxes after the double-bottom signal box. It barely snuck above the original trendline before sinking down, albeit at a higher low. What followed was a strong rally which broke through the original trendline but was met with resistance from the most validated trendline.
After very brief congestion, the price rallied through the most validated trendline by 4 boxes. This questioned the resistance power of this trendline. Though it is thought this 4 box rally above was an attempt to reach the previous all-time high. A pole developed and sunk the price through this trendline and then the original trendline again, and created a triple-bottom sell. The next X column failed to come close the original trendline. A catapult then formed with a double-bottom after the triple-bottom. The next X column failed to touch the original trendline before another double-bottom sell-signal was generated. Two downtrend lines have now formed but the area of support is yet to be full broken.
My impression is that we are experiencing a market top and that a potential reversal is imminent.
Things to look out for:
- Will minor downtrend be penetrated?
- Will major downtrend line be penetrated?
- Will the area of support be penetrated?
For a short, anticipate:
- the second downtrend line to be validated
- the area of support to be penetrated
- a double-bottom sell-signal or better

USDCADTF: 1 Hr
Looking for a retrace and a buy. Pattern seems to be potentially unfolding an inverse H and S.