AND

USDPEN DÓLAR SOL BUY CORTO PLAZO VENDER LARGO PLAZO EL ANÁLISIS FUNDAMENTAL NOS DICE QUE EL DÓLAR SOL ABRIRÍA AL ALZA DEBIDO A LA INESTABILIDAD POLÍTICA Y SOCIAL, SON BUENAS OPORTUNIDADES PARA COMPRA DE DÓLARES EN SOLES HASTA QUE LLEGUE AL PRECIO DE 3.6577, DESPUÉS POR LOS ESTÍMULOS DEL BCR Y EL ANÁLISIS TÉCNICO NOS DICE QUE ESTOS PARES DE DIVISA SE PREPARARÍAN PARA UNA VENTA SWING A PARTIR DEL PRECIO 3.6577 DEBIDO A LA BAJADA DEL PRECIO DEL DÓLAR Y TAMBIÉN EL FORTALECIMIENTO INSTITUCIONAL DEL PERÚ EN EL LARGO PLAZO.


GBP AUD showing bullish reverse head and shoulders patternDo the analysis for yourselves and learn to become a better trader. If it passes the first resistance, it will target the second resistance. It is trying to head in the upwards direction. Follow me for more tips and ideas. Also, check out my website Traderhero.tk to become a skilled trader. Stop losing money, start gaining!


ETH inverse H&SSo obviously ETH is going up along with the rest of the market, but this offers good targets to take some profits.
Whether you measure the shoulder depth, or the entire H&S depth, it matches up really well with the $440 and $480-490 resistance levels.
I expect a pullback at both of these levels, but of course ETH will go much higher in the long term.

Cup and a Handle setupMVIS is forming long term setup for bullish break at 3,01 with "Cup and a Handle " nice formation.

ATOM USDT POSSIBLE REVERSE HEAD AND SHOULDER PATTERN #ATOMUSDTNot investment advice. Take your own risk please.

YFI resumes upward after possible completion of H&SYFI has made a good volume recovery. I will be waiting for the 8hr retest of the closest S/R line and a good resumption before going long. A safer entry would be the retest and resumption around the 21000 S/R line. It would also be above the EMAs at that point.

SPY going UP, buy, buy, buyInverse head and shoulders signals conclusion of down trend. Place your buy orders now with a stop at 330. Going up, up and away.

Retest This pair is coming from a retest after break out. If the support turned resistance hold them. You can look to long it. What do you guys think 🤔

YFI is one big Head and Shoulders patternIf you want a safer entry, wait for the 8hr retest of resistance at 21000

I think I spotted an early head and shoulders pattern at NZD/CADHello guys and girls,
hier is my idea,
I think for all of you who are familiar with the head and shoulders pattern,
you know how to read my drawings on this chart. I'am already short on this one,
maybe a little bit to early, but we will see. Pleas feel free to share your
opinion about this trade in the comment section.
With best regards,
Jens

MKR to at least $750Looks to be forming several bullish signal. Good place to buy would be that ~$550 support level. If you missed the wick off there just wait.

gbpusdIf the channel fails from below, the sales profit can be opened. Sell and buy
And if you move up, it is a good buying position for the deal

AUDJPY BIAS We got price holding at weekly demand i had drawn up ( green zone ) and is creating support as you can see on the 1 hr timeframe and the 30 minute timeframe as well .Price can either break demand retest and follow through or reject and go to the upside , from what i see im leaning towards the idea of price going towards the upside BUT , you can never be to sure , only take the clues and hints the markets give you and never pull the trigger unless your 100% sure of the outcome ! , Happy trading everyone :)
This is merely MY outlook and not advice on what YOU should do just my opinion on what I see

POTENTIAL AUDCAD SHORT ?Anyone else see a potential short for AUDCAD ? , Personally not entering this trade as it doesn't fit my trading plan but It's looking like it could break that demand zone I have marked and make its way to the downside , could also be an overshoot and make its way back to the upside , who knows ? all you can do is take the hints the markets give you and create your own bias from it . Happy trading :)
- This is merely MY outlook and not advice on what YOU should do just my opinion on what I see


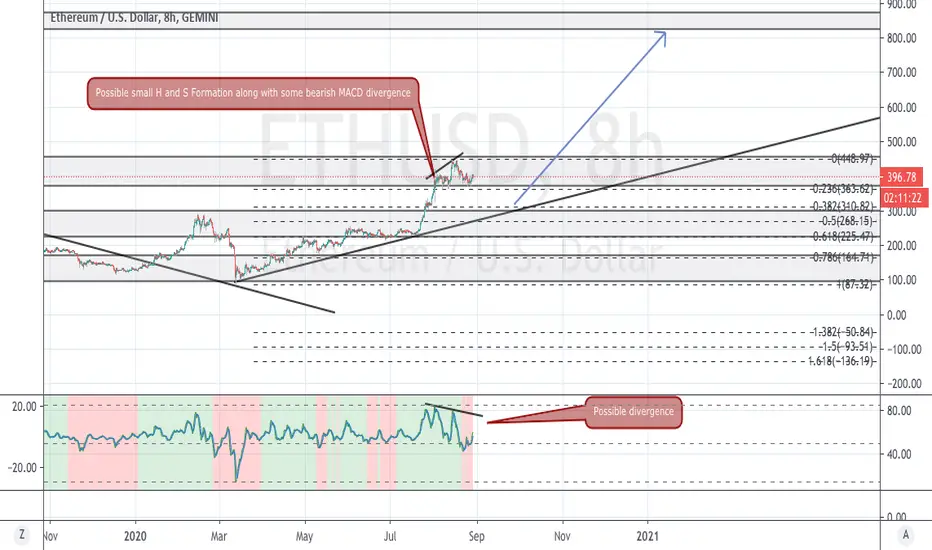
ETHUSD - Looking for a Corrective RetracementTF: 8 Hr
Possible H and S formation on the 8 hr TF. This has formed after a strong rally, and price may due for a corrective pullback. I think a retracement to the .318 looks like it may be a good area to look for longs.
This retraement area offers a few bullish confluences:
1. Area aligns with with a former broke resistance zone;
2. The 0.382 corrective retracement area is also located here
3.Aligns with a new bullish trend line
Dollar weakness looks like it may continue for the longer-term which will drive cryptos upwards. The DXY (dollar index) looks very oversold and may need to correct a bit more up which would allow ETHUSD to retrace.